


The Nifty 50 rebounded as the market was oversold after a two-day bear trap, rising nearly 1 percent on March 10 amid improving global sentiment. Comments by Donald Trump raised hopes of de-escalation in a potential Iran war situation, resulting in a sharp fall in oil prices, which are quoting well below $100 a barrel, along with a cooling India VIX. However, strong follow-up buying interest is required for a further market uptrend. If that comes true in the next few sessions, the 24,300–24,500 zone is expected to act as an immediate crucial resistance for the Nifty, followed by 24,700. On the downside, the immediate key support is placed at 24,000, according to experts.
Here are 15 data points we have collated to help you spot profitable trades:
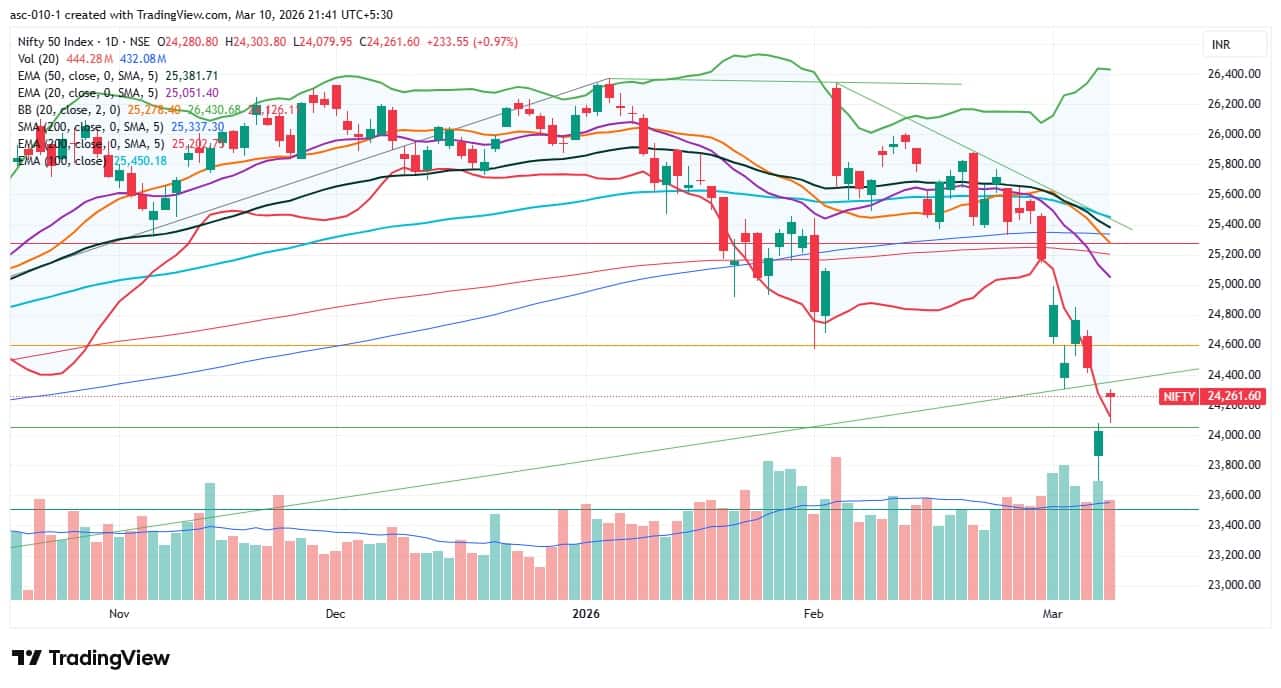
1) Key Levels For The Nifty 50 (24,262)
Resistance based on pivot points: 24,301, 24,353, and 24,439
Support based on pivot points: 24,130, 24,077, and 23,991
Special Formation: The Nifty 50 formed a small-bodied bearish candle with a long lower shadow, resembling a Doji-like candlestick pattern on the daily timeframe (though not a classical one). This indicates indecision among bulls and bears despite the rally and suggests the presence of strong overhead resistance around the 24,400–24,500 levels. The index still sustains below the upward-sloping trendline (which previously acted as support and is now acting as resistance), while closing within Monday's long bearish gap. The Relative Strength Index (RSI) rose to 34.22 after being in the oversold zone but remained below the signal line. The histogram weakness faded, but the MACD remained below the reference and zero lines. All this indicates that the market is attempting to stabilise but lacks strong bullish confirmation so far.
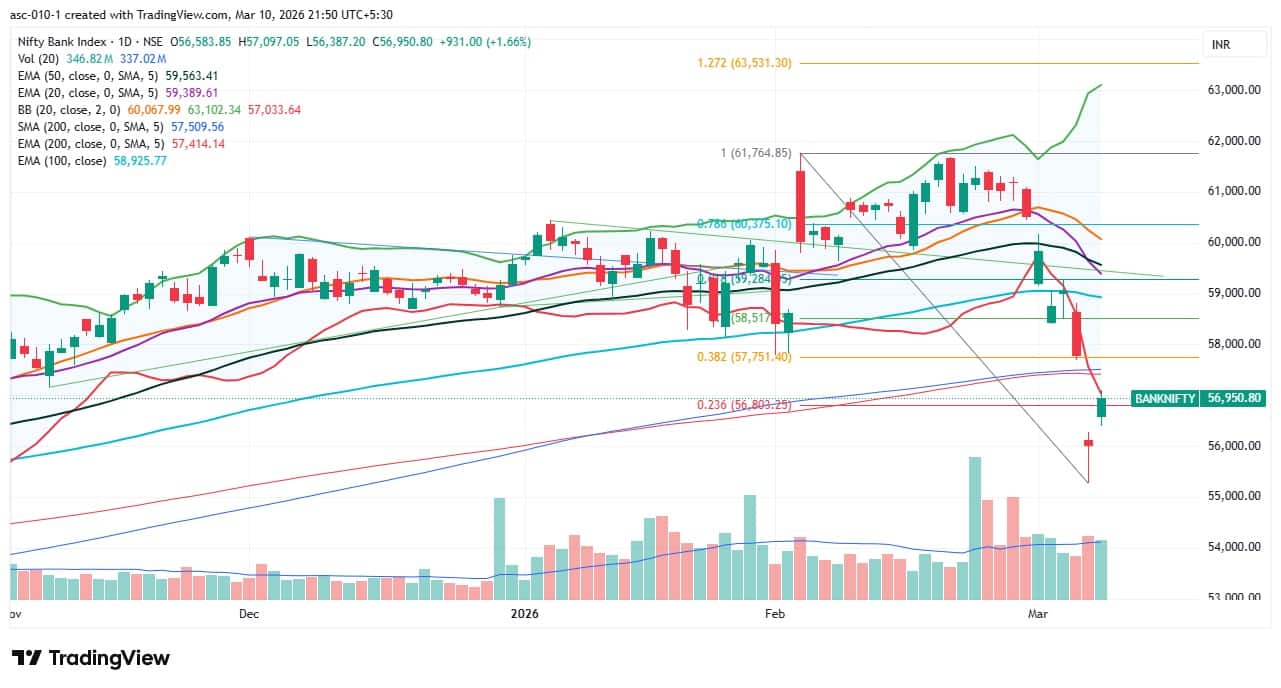
2) Key Levels For The Bank Nifty (56,951)
Resistance based on pivot points: 57,083, 57,250, and 57,522
Support based on pivot points: 56,541, 56,373, and 56,102
Resistance based on Fibonacci retracement: 57,751, 58,517
Support based on Fibonacci retracement: 56,711, 55,328
Special Formation:The Nifty Bank also saw a gap-up opening and rallied 1.66 percent, forming a bullish candle on the daily charts. However, it remained below the lower Bollinger Bands and the 200-day EMA. The 20-, 50-, and 100-day EMAs continued to trend downward, indicating a broader weak structure. The RSI climbed to 33.24 but remained below the reference line. The Stochastic RSI stayed sideways in oversold levels, while the MACD maintained a sell signal with further expansion in the red bars of the histogram. All this indicates that the broader trend still remains weak despite the short-term bounce.
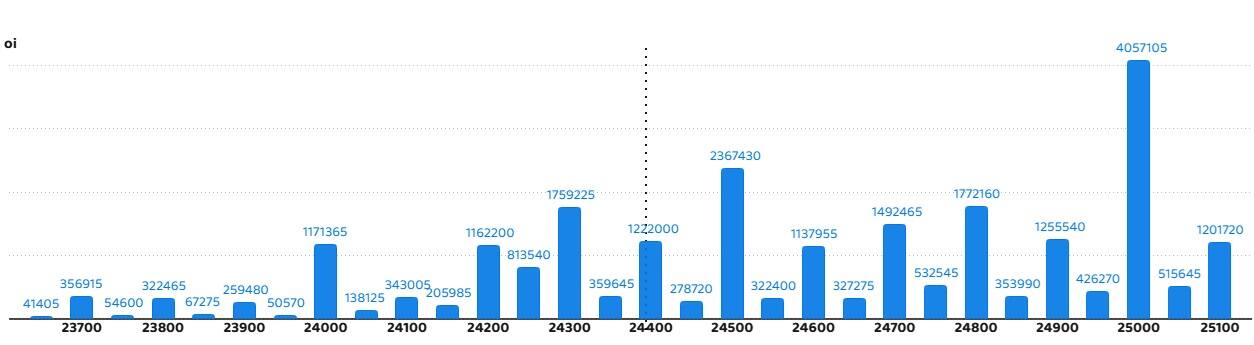
According to the weekly options data, the 25,000 strike holds the maximum Call open interest (with 40.57 lakh contracts). This level can act as a key resistance level for the Nifty in the short term. It was followed by the 24,500 strike (23.67 lakh contracts) and 24,800 strike (17.72 lakh contracts).
Maximum Call writing was observed at the 25,000 strike, which saw an addition of 18.08 lakh contracts, followed by the 24,300 and 24,800 strikes, which added 13.18 lakh and 9.8 lakh contracts, respectively. The maximum Call unwinding was seen at the 23,900 strike, which shed 1.6 lakh contracts, followed by the 24,100 and 23,800 strikes, which shed 1.38 lakh and 1.33 lakh contracts, respectively.
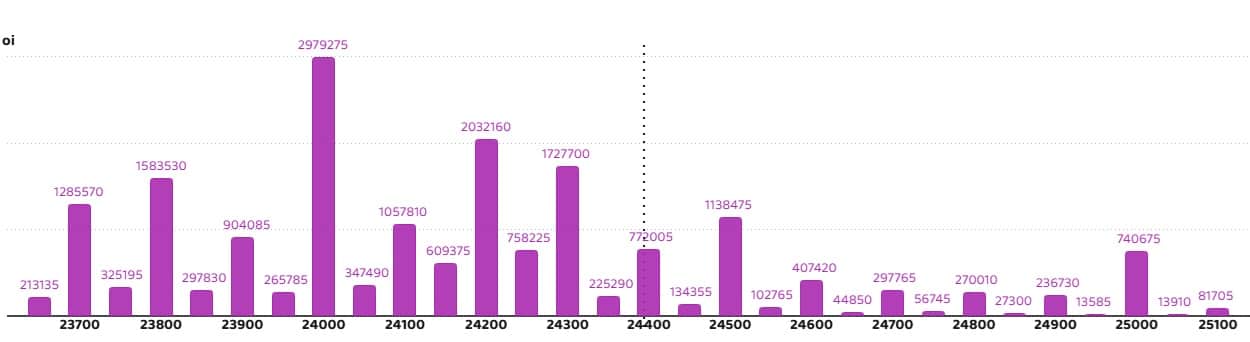
On the Put side, the maximum Put open interest was seen at the 24,000 strike (with 29.79 lakh contracts), which can act as a key support level for the Nifty in the short term. It was followed by the 24,200 strike (20.32 lakh contracts) and the 24,300 strike (17.27 lakh contracts).
The maximum Put writing was placed at the 24,200 strike, which saw an addition of 18.38 lakh contracts, followed by the 24,000 and 24,300 strikes, which added 14.48 lakh and 14.35 lakh contracts, respectively. The maximum Put unwinding was seen at the 24,700 strike, which shed 85,540 contracts, followed by the 24,650 strike, which shed 22,230 contracts.
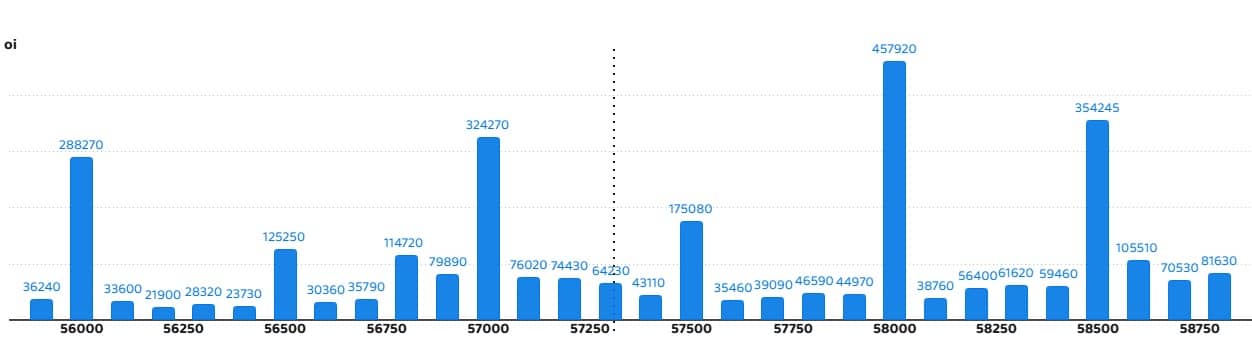
5) Bank Nifty Call Options Data
According to the monthly options data, the 58,000 strike holds the maximum Call open interest, with 4.57 lakh contracts. This can act as a key resistance level for the index in the short term. It was followed by the 58,500 strike (3.54 lakh contracts) and the 57,000 strike (3.24 lakh contracts).
Maximum Call writing was observed at the 57,000 strike (with the addition of 1.03 lakh contracts), followed by the 56,800 strike (82,440 contracts) and 56,900 strike (64,170 contracts). The maximum Call unwinding was seen at the 56,000 strike, which shed 98,430 contracts, followed by the 56,300 and 56,200 strikes, which shed 24,810 and 21,690 contracts, respectively.
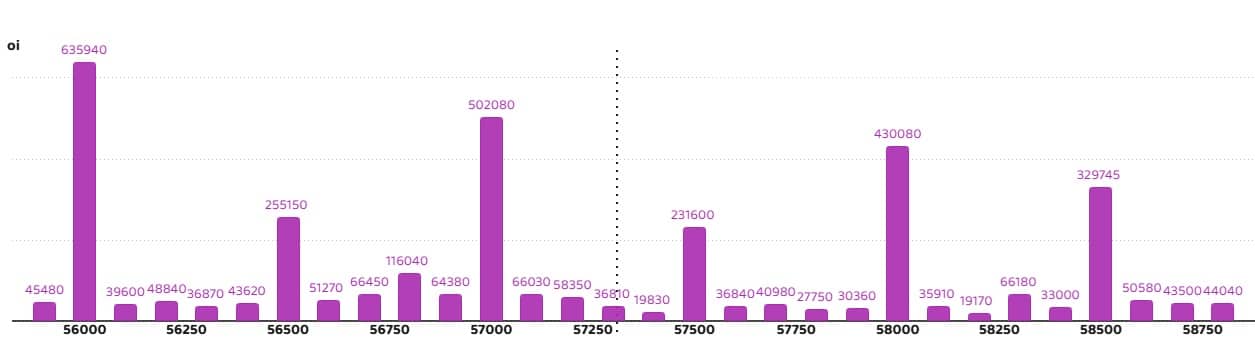
6) Bank Nifty Put Options Data
On the Put side, the maximum Put open interest was seen at the 56,000 strike (with 6.35 lakh contracts), which can act as a key support level for the index. This was followed by the 57,000 strike (5.02 lakh contracts) and the 58,000 strike (4.3 lakh contracts).
The maximum Put writing was placed at the 57,000 strike (which added 1.51 lakh contracts), followed by the 56,000 (1.3 lakh contracts) and 56,800 (96,510 contracts). The maximum Put unwinding was seen at the 56,200 strike, which shed 20,100 contracts, followed by the 58,300 and 58,500 strikes, which shed 16,170 and 11,425 contracts, respectively.
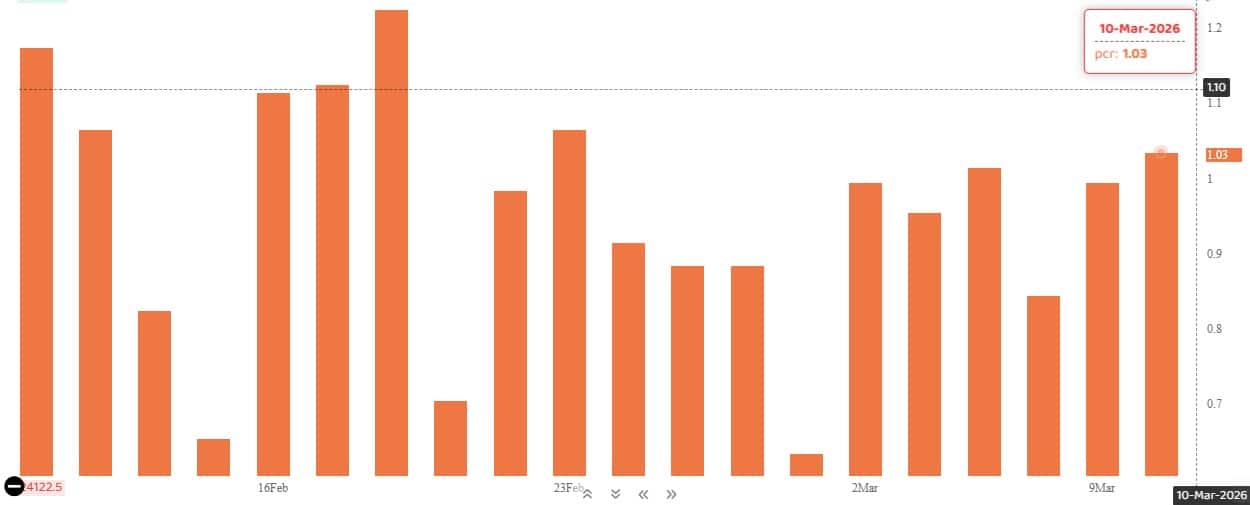
The Nifty Put-Call ratio (PCR), which indicates the mood of the market, climbed to 1.03 on March 10, compared to a 0.99 in previous session.
The increasing PCR, or being higher than 0.7 or surpassing 1, means traders are selling more Put options than Call options, which generally indicates the firming up of a bullish sentiment in the market. If the ratio falls below 0.7 or moves towards 0.5, then it indicates selling in Calls is higher than selling in Puts, reflecting a bearish mood in the market.
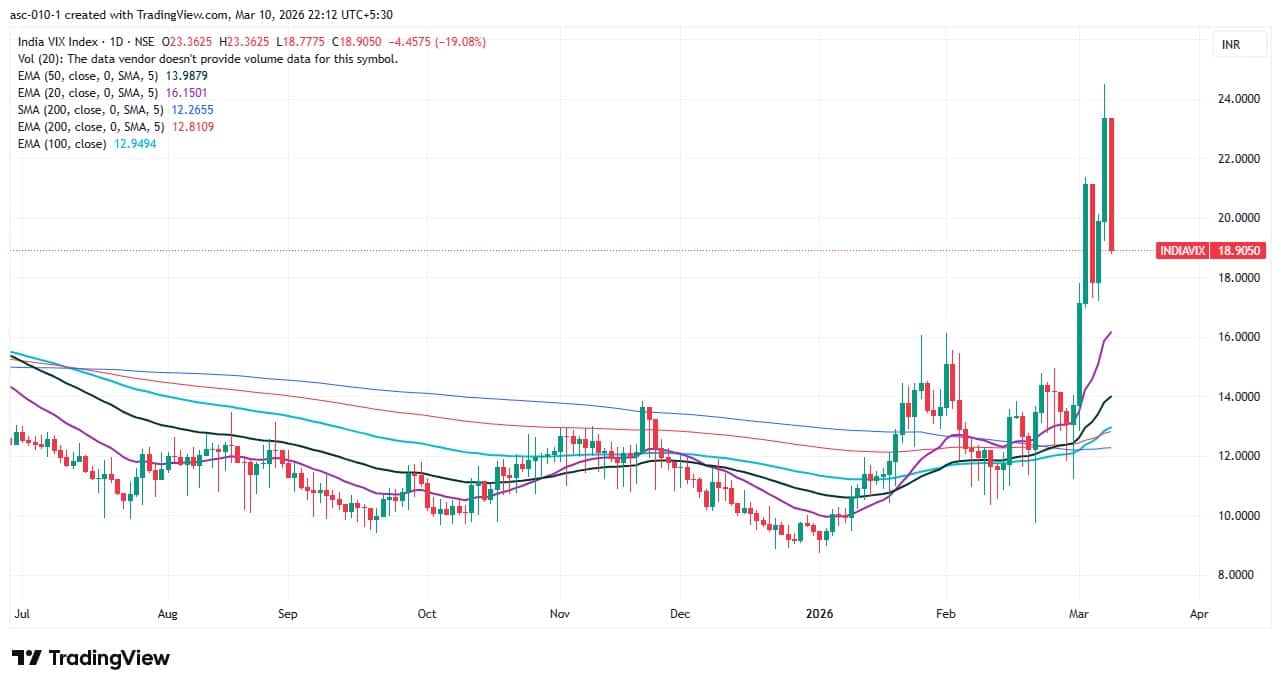
9) India VIX
The India VIX, which measures expected market volatility, plunged 19.08 percent to 18.9, signalling comfort for bulls. Despite this cooling, the VIX remains at elevated levels and needs a further gradual fall for bulls to return in strong action.
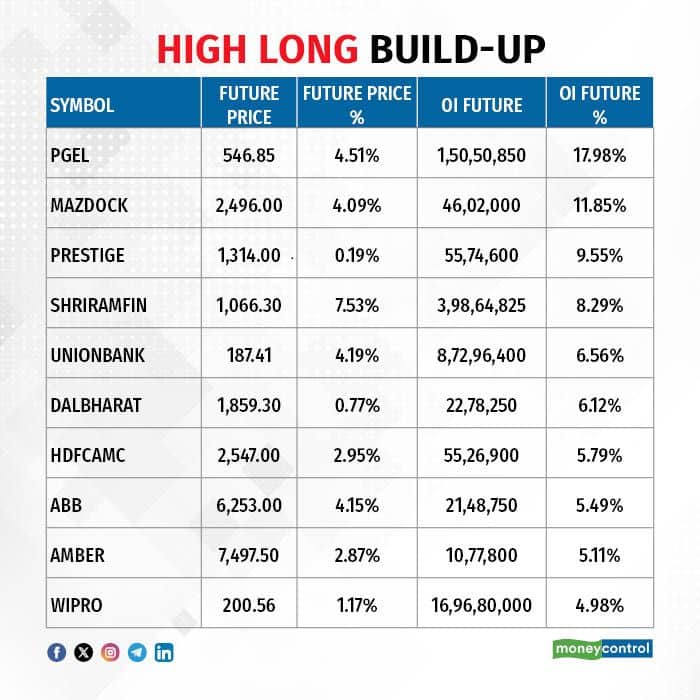
10) Long Build-up (102 Stocks)
A long build-up was seen in 102 stocks. An increase in open interest (OI) and price indicates a build-up of long positions.
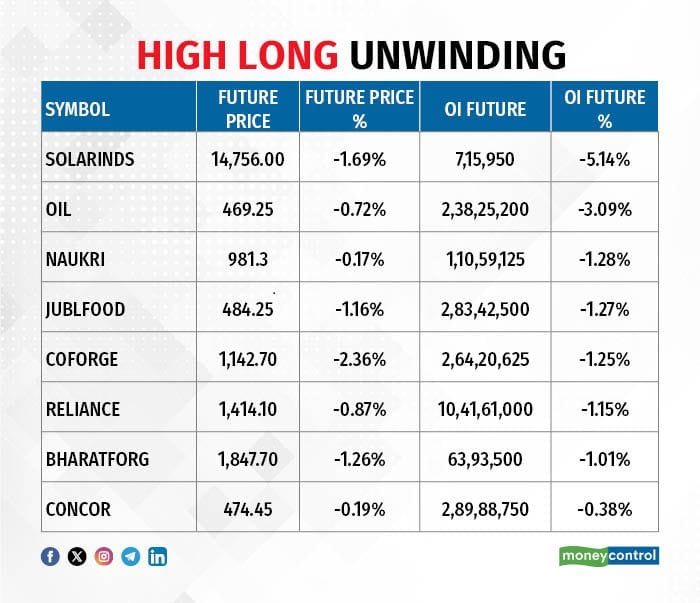
8 stocks saw a decline in open interest (OI) along with a fall in price, indicating long unwinding.
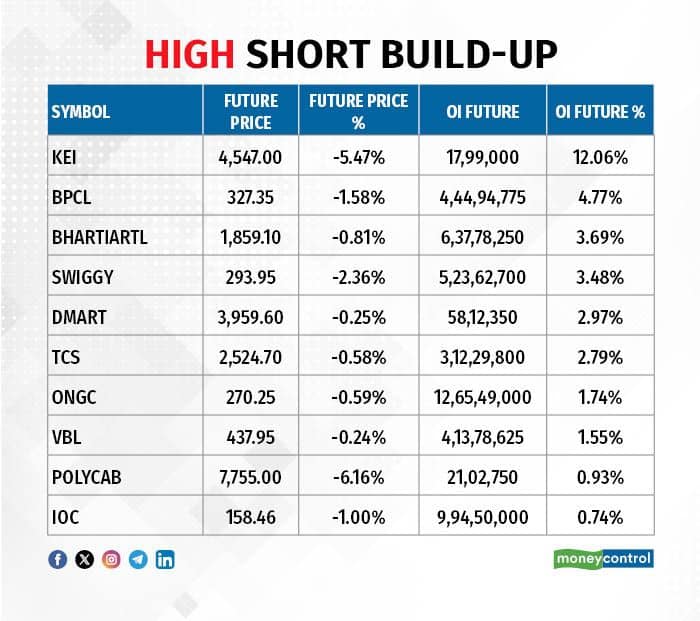
12) Short Build-up (12 Stocks)
12 stocks saw an increase in OI along with a fall in price, indicating a build-up of short positions.
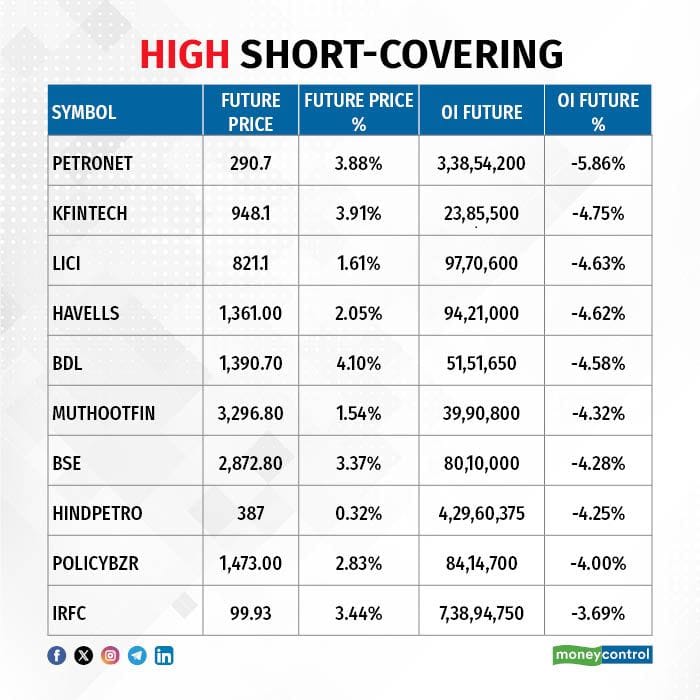
13) Short-Covering (88 Stocks)
88 stocks saw short-covering, meaning a decrease in OI, along with a price increase.
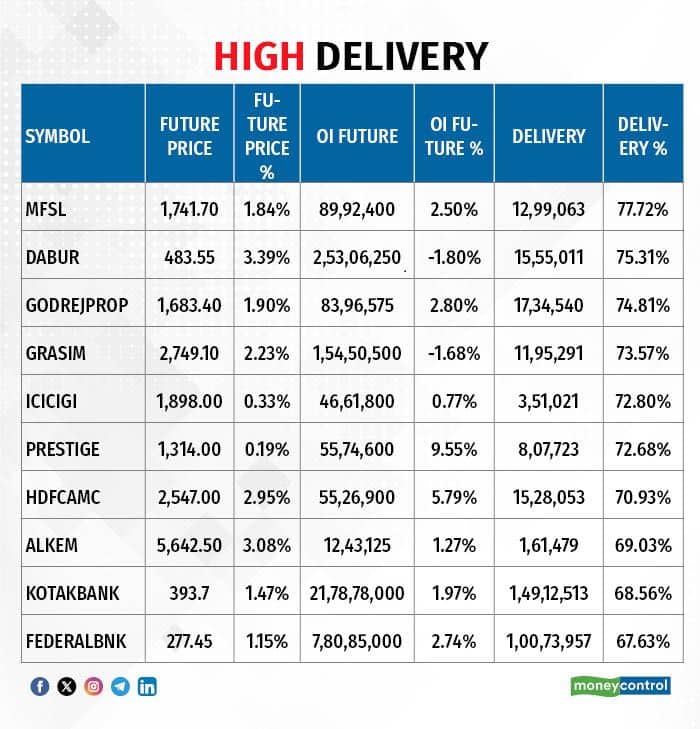
Here are the stocks that saw a high share of delivery trades. A high share of delivery reflects investing (as opposed to trading) interest in a stock.
Securities banned under the F&O segment include companies where derivative contracts cross 95 percent of the market-wide position limit.
Stocks added to F&O ban: Nil
Stocks retained in F&O ban: SAIL, Sammaan Capital
Stocks removed from F&O ban: Nil
Disclaimer: The views and investment tips expressed by experts on Moneycontrol are their own and not those of the website or its management. Moneycontrol advises users to check with certified experts before taking any investment decisions.Disclaimer: Moneycontrol is a part of the Network18 group. Network18 is controlled by Independent Media Trust, of which Reliance Industries is the sole beneficiary.Discover the latest Business News, Sensex, and Nifty updates. Obtain Personal Finance insights, tax queries, and expert opinions on Moneycontrol or download the Moneycontrol App to stay updated!
Find the best of Al News in one place, specially curated for you every weekend.
Stay on top of the latest tech trends and biggest startup news.


