


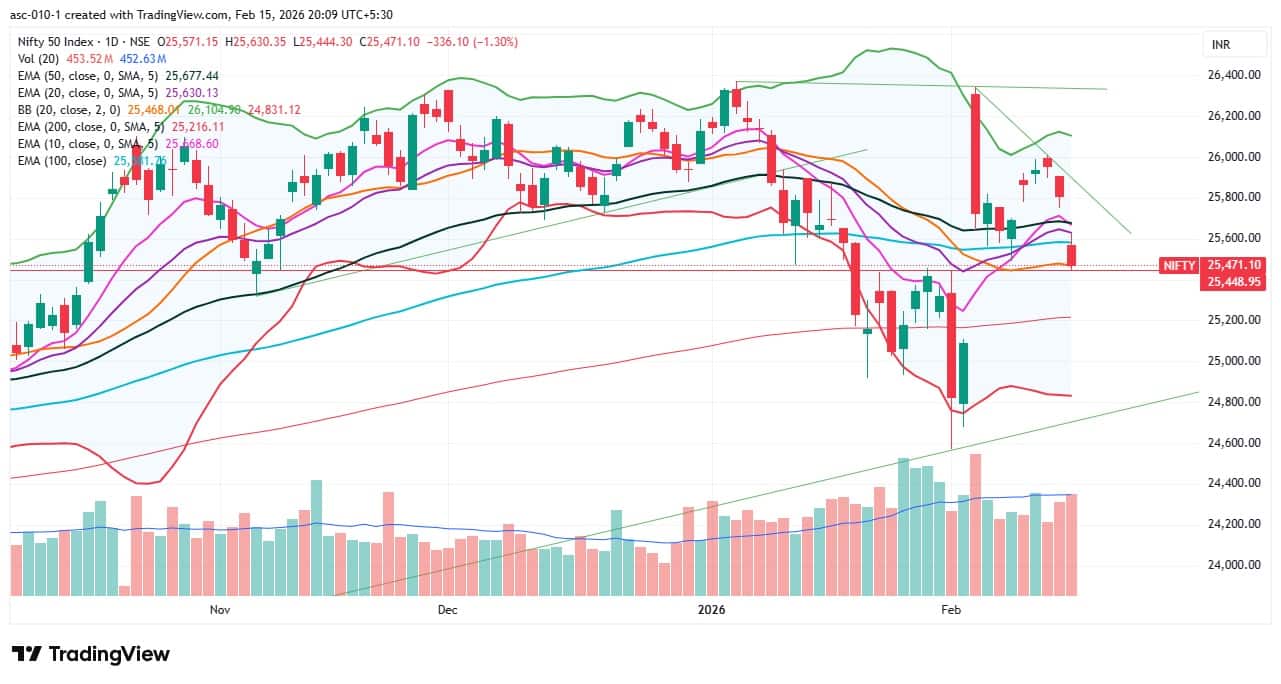
The Nifty 50 plunged 1.3 percent, marking its biggest single-day fall in the last two weeks, after a gap-down opening on February 13. The index tested the midline of the Bollinger Bands, while momentum indicators signalled caution in the near term. According to experts, the Nifty 50 is expected to see consolidation with range-bound trading as long as it trades below the 26,000 mark. However, there is a possibility of a bounce back on Monday after Friday's sharp sell-off, with immediate resistance placed at 25,600–25,700. In case of a decisive fall below the 20 DMA (25,468), the index could open the door for a decline toward 25,300.
Here are 15 data points we have collated to help you spot profitable trades:
1) Key Levels For The Nifty 50 (25,471)
Resistance based on pivot points: 25,586, 25,630, and 25,701
Support based on pivot points: 25,444, 25,400, and 25,329
Special Formation: The Nifty 50 formed a bearish candle with an upper shadow on the daily charts after a gap-down opening and fell below all key moving averages (except the 200-day EMA), signalling bearish sentiment. The index also tested the midline of the Bollinger Bands intraday. Momentum indicators also signalled caution, as the RSI dropped to 46 with a negative crossover. The Stochastic RSI maintained a bearish crossover, while the MACD inclined downward, though it stayed above the signal line and the zero line. The histogram signalled fading momentum. All these indicators suggest a cautious to bearish bias in the near term.
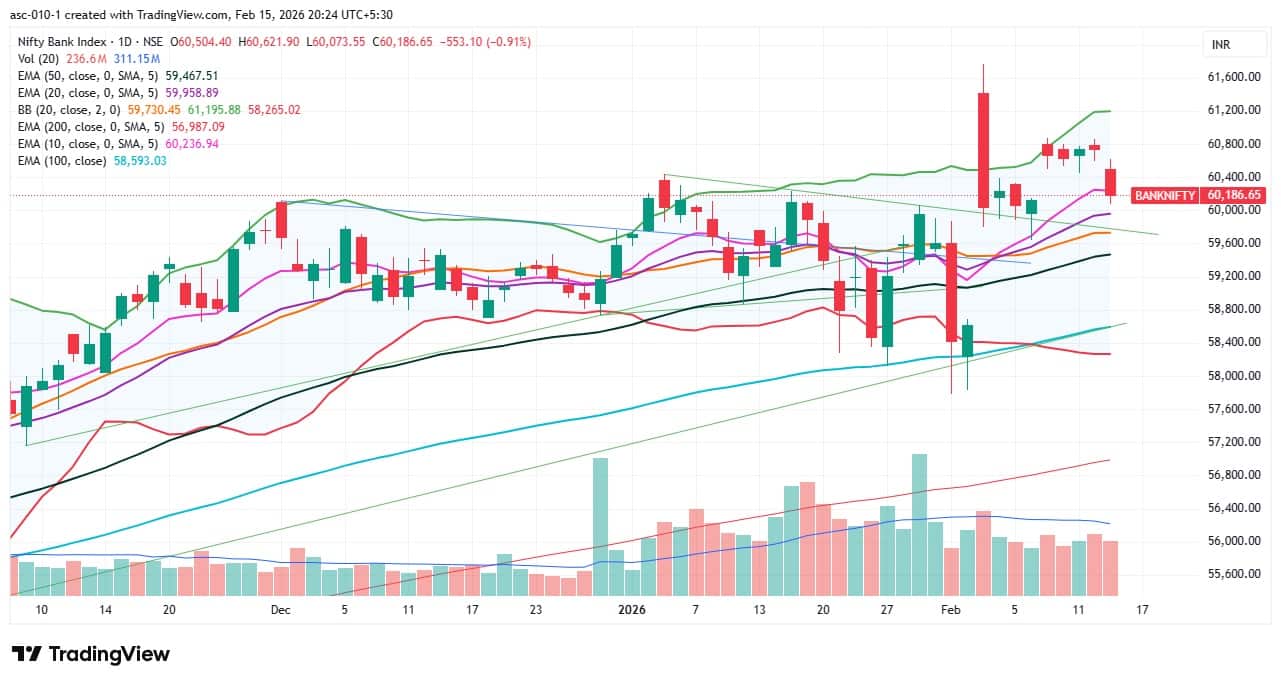
2) Key Levels For The Bank Nifty (60,187)
Resistance based on pivot points: 60,503, 60,633, and 60,842
Support based on pivot points: 60,085, 59,955, and 59,746
Resistance based on Fibonacci retracement: 61,160, 62,075
Support based on Fibonacci retracement: 60,000, 59,452
Special Formation: The Bank Nifty formed a bearish candle after recent consolidation since the start of the week and slipped below the 10-day EMA on the daily timeframe. However, it stayed well above the falling support trendline and sustained above all other key moving averages, which is positive. In fact, its performance (down 0.91 percent) is still better than that of the Nifty 50. The RSI at 53.83 just fell below the reference line, and the Stochastic RSI witnessed a bearish crossover. The MACD remained well above the signal line, though it tilted downward slightly. The histogram showed fading momentum but remained above the zero line. All these indicators suggest that while momentum is weakening, the broader structure remains relatively stronger compared to the Nifty 50.
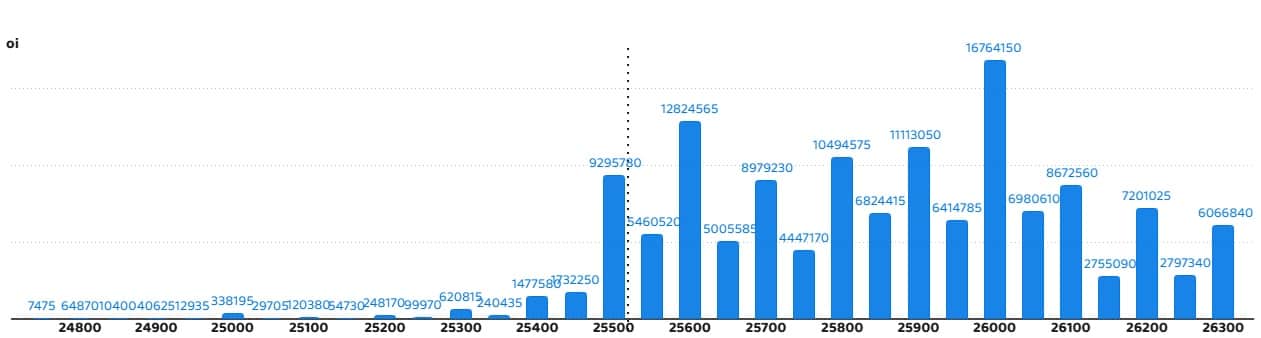
According to the weekly options data, the 26,000 strike holds the maximum Call open interest (with 1.67 crore contracts). This level can act as a key resistance level for the Nifty in the short term. It was followed by the 25,600 strike (1.28 crore contracts) and 25,900 strike (1.11 crore contracts).
Maximum Call writing was observed at the 25,600 strike, which saw an addition of 1.21 crore contracts, followed by the 25,500 and 25,700 strikes, which added 85.4 lakh and 75.18 lakh contracts, respectively. The maximum Call unwinding was seen at the 26,150 strike which shed 19.96 lakh contracts, followed by the 26,250 and 25,900 strikes, which shed 7.59 lakh and 13,455 contracts, respectively.
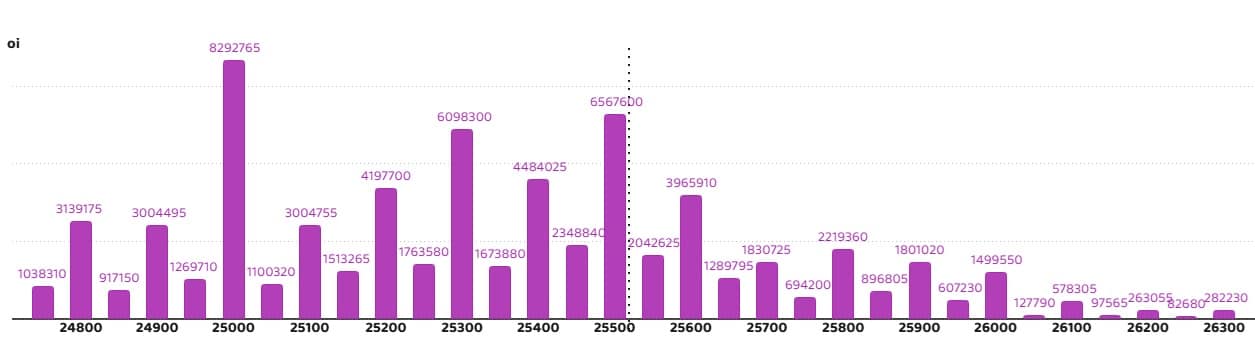
On the Put side, the maximum Put open interest was seen at the 25,500 strike (with 82.92 lakh contracts), which can act as a key support level for the Nifty in the short term. It was followed by the 25,500 strike (65.67 lakh contracts) and the 25,300 strike (60.98 lakh contracts).
The maximum Put writing was placed at the 25,000 strike, which saw an addition of 27.45 lakh contracts, followed by the 25,300 and 25,400 strikes, which added 17.36 lakh and 15.18 lakh contracts, respectively. The maximum Put unwinding was seen at the 25,800 strike, which shed 39.21 lakh contracts, followed by the 25,700 and 25,900 strikes, which shed 30.41 lakh and 21.79 lakh contracts, respectively.
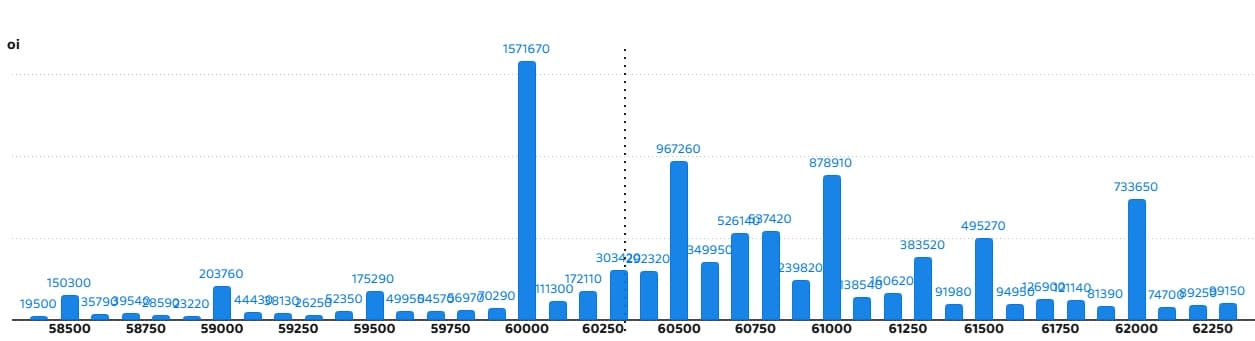
5) Bank Nifty Call Options Data
According to the monthly options data, the 60,000 strike holds the maximum Call open interest, with 15.71 lakh contracts. This can act as a key level for the index in the short term. It was followed by the 60,500 strike (9.67 lakh contracts) and the 61,000 strike (8.78 lakh contracts).
Maximum Call writing was observed at the 60,500 strike (with the addition of 2.95 lakh contracts), followed by the 60,400 strike (1.35 lakh contracts) and 60,300 strike (1.17 lakh contracts). The maximum Call unwinding was seen at the 61,300 strike, which shed 65,190 contracts, followed by the 58,500 and 62,300 strikes which shed 33,360 and 28,200 contracts, respectively.
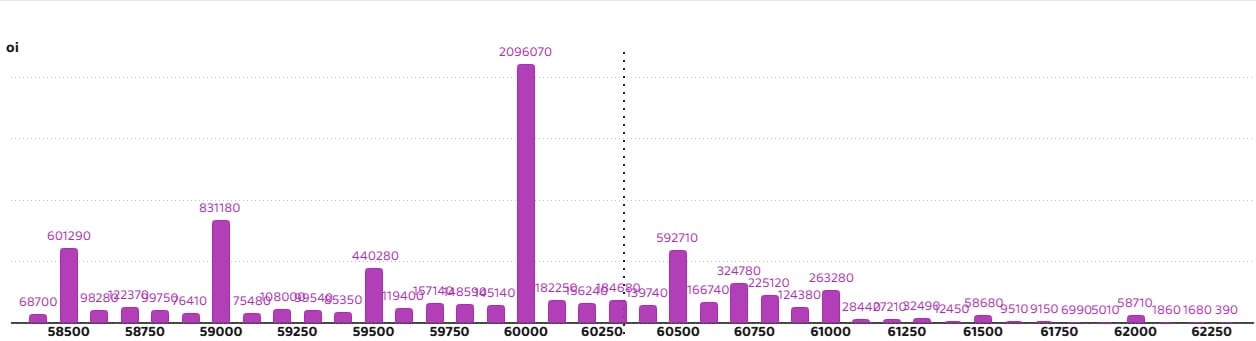
6) Bank Nifty Put Options Data
On the Put side, the maximum Put open interest was seen at the 60,000 strike (with 20.96 lakh contracts), which can act as a key support level for the index. This was followed by the 59,000 strike (8.31 lakh contracts) and the 58,500 strike (6.01 lakh contracts).
The maximum Put writing was placed at the 58,500 strike (which added 27,390 contracts), followed by the 61,900 strike (1,770 contracts) and the 62,100 strike (390 contracts). The maximum Put unwinding was seen at the 60,700 strike which shed 2.44 lakh contracts, followed by the 60,500 and 60,600 strikes, which shed 2.35 lakh and 1.63 lakh contracts, respectively.
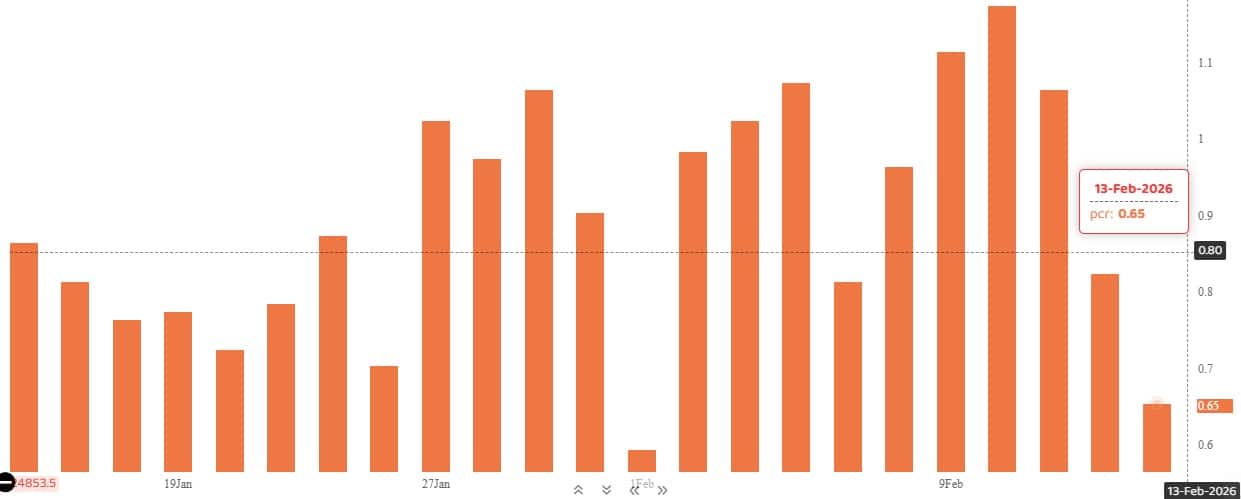
The Nifty Put-Call ratio (PCR), which indicates the mood of the market, slipped further to 0.65 on February 13, compared to 0.82 in the previous session.
The increasing PCR, or being higher than 0.7 or surpassing 1, means traders are selling more Put options than Call options, which generally indicates the firming up of a bullish sentiment in the market. If the ratio falls below 0.7 or moves towards 0.5, then it indicates selling in Calls is higher than selling in Puts, reflecting a bearish mood in the market.
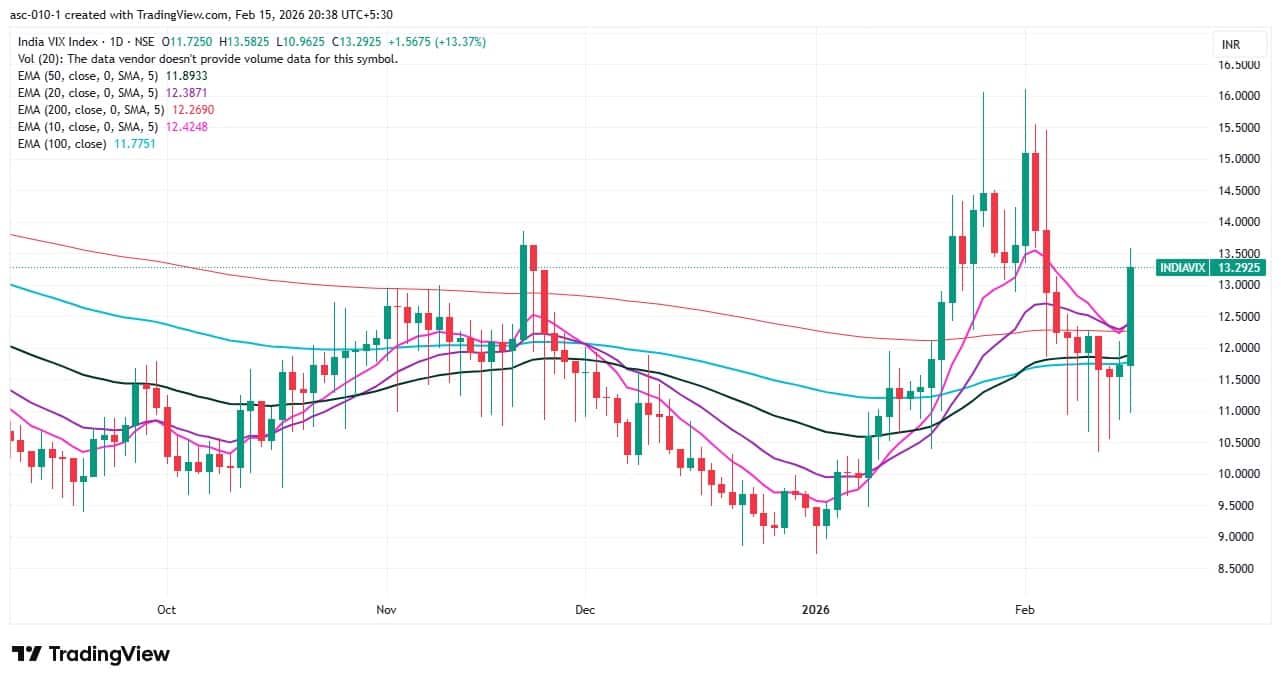
9) India VIX
India VIX, also known as the fear gauge, surged 13.37 percent to 13.29 and climbed above all key moving averages in a single session, indicating discomfort and caution among bulls. The index needs to decisively cool down below the 12 zone to provide comfort to bulls.
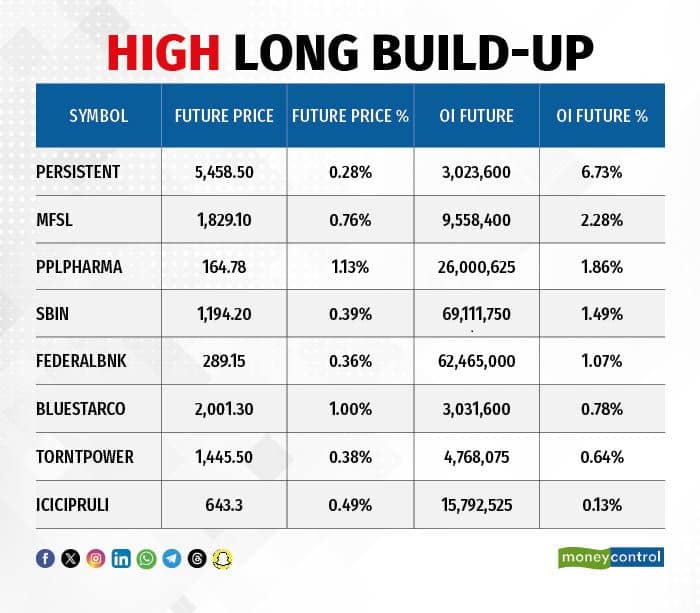
A long build-up was seen in 8 stocks. An increase in open interest (OI) and price indicates a build-up of long positions.
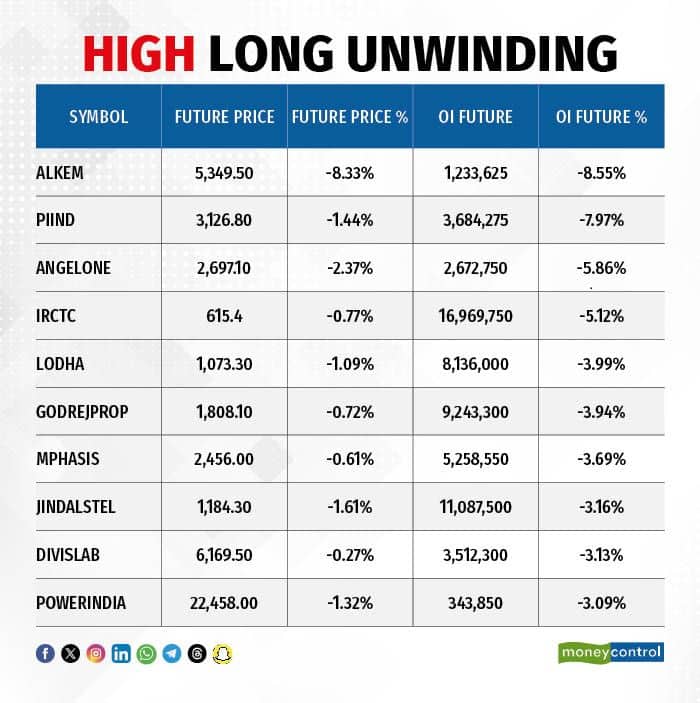
11) Long Unwinding (82 Stocks)
82 stocks saw a decline in open interest (OI) along with a fall in price, indicating long unwinding.
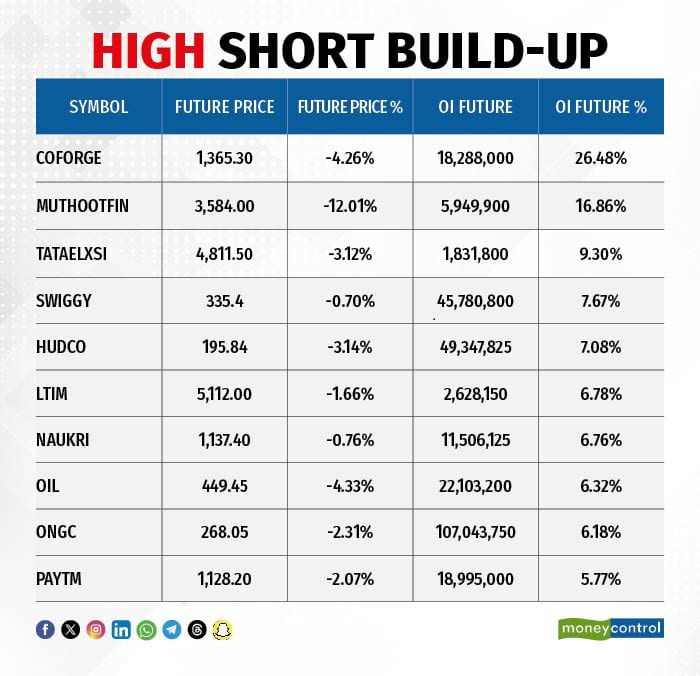
12) Short Build-up (113 Stocks)
113 stocks saw an increase in OI along with a fall in price, indicating a build-up of short positions.
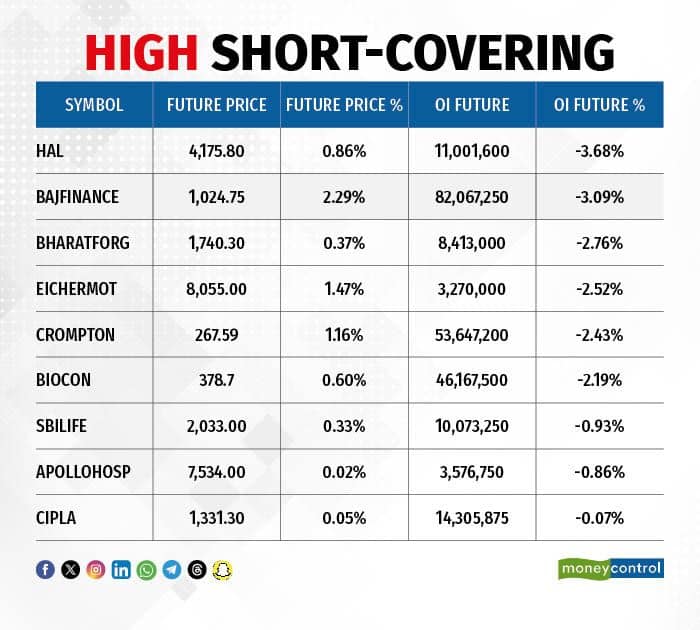
9 stocks saw short-covering, meaning a decrease in OI, along with a price increase.
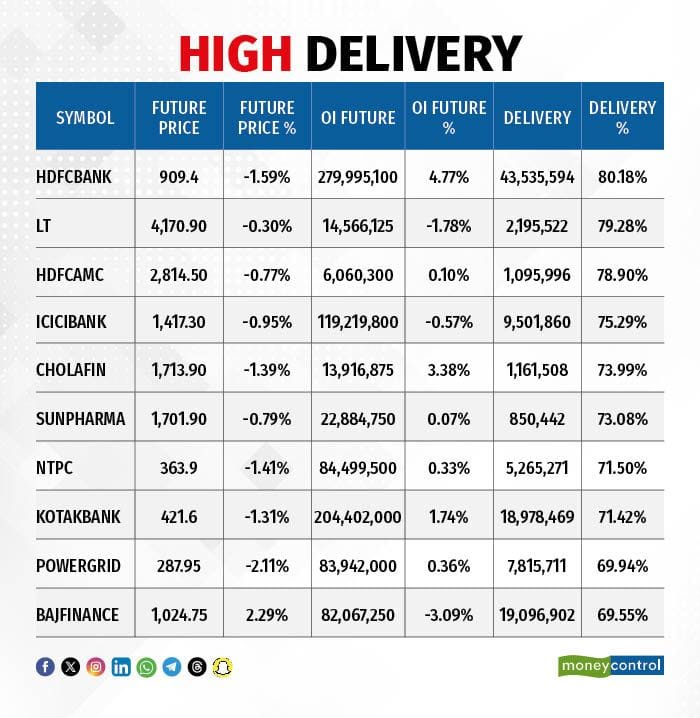
Here are the stocks that saw a high share of delivery trades. A high share of delivery reflects investing (as opposed to trading) interest in a stock.
Securities banned under the F&O segment include companies where derivative contracts cross 95 percent of the market-wide position limit.
Stocks added to F&O ban: Nil
Stocks retained in F&O ban: SAIL, Sammaan Capital
Stocks removed from F&O ban: Nil
Disclaimer: The views and investment tips expressed by experts on Moneycontrol are their own and not those of the website or its management. Moneycontrol advises users to check with certified experts before taking any investment decisions.Disclaimer: Moneycontrol is a part of the Network18 group. Network18 is controlled by Independent Media Trust, of which Reliance Industries is the sole beneficiary.Discover the latest Business News, Sensex, and Nifty updates. Obtain Personal Finance insights, tax queries, and expert opinions on Moneycontrol or download the Moneycontrol App to stay updated!
Find the best of Al News in one place, specially curated for you every weekend.
Stay on top of the latest tech trends and biggest startup news.


