


After many attempts, the Nifty50 finally succeeded in surpassing its previous all-time high and hit a new high of 19,011.25 on June 28, the monthly expiry day for June futures & options contracts, backed by buying across sectors. Metal and pharma were the leading stars, rising over 1 percent each.
The BSE Sensex intraday new high was 64,050.44 and rose 499.39 points to a record close of 63,915.42.
The Nifty50 cleared the critical resistance 18,900 level at the opening itself and remained positive throughout the session, though there was volatility in the latter half. It ended at a record of 18,972.10, up 154.7 points, extending the uptrend for the third straight trading day.
The Nifty50 has formed a bullish candlestick pattern on the daily charts, making higher highs and higher lows for yet another session, indicating a positive sentiment, going ahead.
Experts expect the rally to continue in the coming sessions, with the Nifty50 moving towards 19,100-19,200 levels. However, minor profit booking can't be ruled out after crossing those levels, while the crucial support would be in the 18,800-18,700 area.
On the weekly scale, the index has so far formed a long bullish candlestick pattern and continued with higher tops and bottoms formation for the 14th consecutive week.
“The positive chart pattern like higher tops and bottoms is intact and the present up-move is in line with the new higher top formation of the sequence. But the higher top reversal has not been confirmed yet," said Nagaraj Shetti, technical research analyst at HDFC Securities.
He said the short-term trend of the Nifty continues to be positive. Having surpassed the crucial overhead resistance of 18,900 levels on June 28, there is a possibility of more upside towards 19,100-19,200 levels in the next few sessions before shifting into a consolidation/minor weakness, whereas immediate support is at 18,830 levels, he said.
The future open interest (OI) indicated a build-up of fresh long positions in Nifty futures for the third consecutive day. Ashwin Ramani, derivatives & technical analyst at SAMCO Securities, also said the mood is upbeat in the market after a strong closing.
"The support for Nifty now shifts to 18,900 levels. On the upside, 19,100 will now act as an immediate hurdle for the index. The options activity at 19,000 strike will set the tone for future cues as we step into the July series expiry on Friday," he said.
Here’s a look at the top 10 trading ideas by experts for the next three-four weeks. Returns are based on June 28 closing prices:
Expert: Nagaraj Shetti, technical research analyst at HDFC Securities
Central Depository Services (CDSL): Buy | LTP: Rs 1,117.25 | Stop-Loss: Rs 1,025 | Target: Rs 1,215 | Return: 8.7 percent
After rangebound action with weak bias in the past few weeks, the CDSL stock price witnessed a sharp upside breakout this week and is currently trading above the hurdle of a down-sloping trendline at Rs 1,060 levels.
The stock price has moved above the crucial resistance of weekly 10- and 20-period EMA (exponential moving average) so far this week. Hence, there is a higher possibility of further extension of upside momentum in the coming week.
Volumes have started to expand during the upside breakout in the stock price and the weekly 14-period RSI (relative strength index) shows a positive indication. Hence, one may expect further strengthening of upside momentum in the stock price ahead.
Buying can be initiated in CDSL at CMP (current market price), add more on dips down to Rs 1,060, and wait for the upside target of Rs 1,215 in the next month, with a stop-loss of Rs 1,025.

JSW Steel: Buy | LTP: Rs 783.4 | Stop-Loss: Rs 738 | Target: Rs 855 | Return: 9 percent
After showing minor weakness within a narrow range movement in the past week, the stock price witnessed a sustainable upside this week and is currently trading higher. The weekly chart pattern indicates that the stock price is placed at the edge, moving above the larger multi-month hurdle at around Rs 780.
The positive sequence like higher tops and bottoms is intact, as per the weekly timeframe chart. Volumes expanded on June 28 during the up-move in the stock price and the weekly 14-period RSI shows a positive indication.
One may look to buy JSW Steel at CMP, add more on dips down to Rs 762 and wait for the upside target of Rs 855 in the next month, with a stop-loss of Rs 738.

Expert: Vidnyan Sawant, AVP - technical research at GEPL Capital
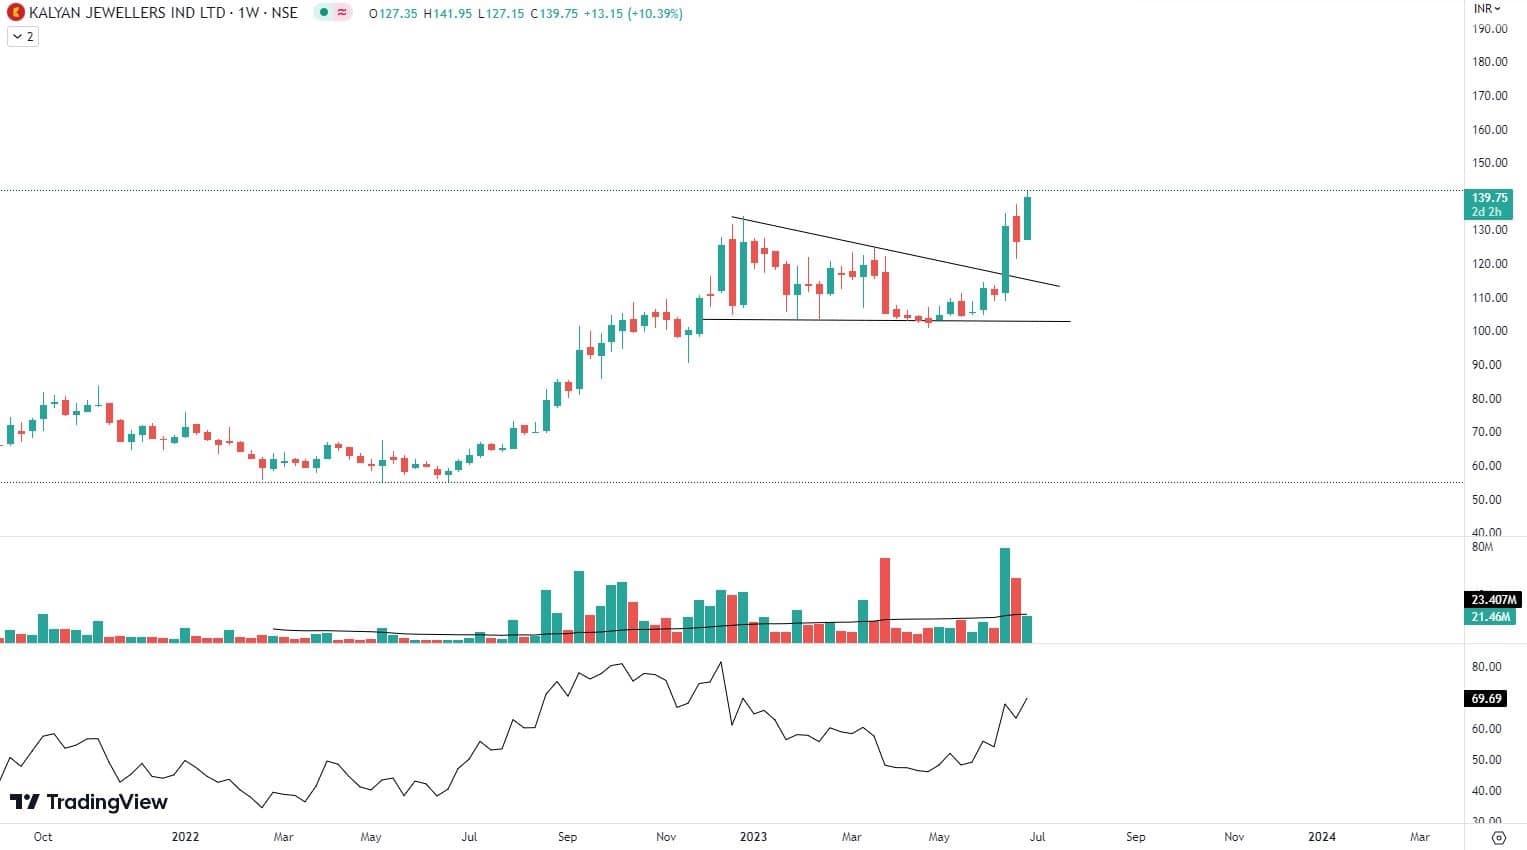
Kalyan Jewellers India: Buy | LTP: Rs 142 | Stop-Loss: Rs 130 | Target: Rs 170 | Return: 20 percent
The Kalyan Jewellers stock is currently trading at its lifetime high, demonstrating robust momentum. The recent breakout from a Descending Triangle pattern suggests a continuation of the previous uptrend.
This breakout can be further validated by observing higher trading volumes, which confirm the strength of the upward movement.
Furthermore, the stock has consistently maintained its position above the 50-day and 200-day EMAs, indicating a sustained uptrend.
On the weekly timeframe, the momentum indicator RSI has displayed a steady rise and remains above the 60 levels, signifying a positive momentum in the stock.
We anticipate the price to ascend towards Rs 170, with a strict stop-loss at Rs 130, based on closing prices.
EPL: Buy | LTP: Rs 221 | Stop-Loss: Rs 205 | Target: Rs 265 | Return: 20 percent
Following a decline from its peak in August 2020, the EPL stock has formed a solid support base within the range of Rs 145-195. Notably, the recent price action has witnessed a breakout from the Rectangle pattern in early June 2023, signalling the initiation of an upward trend.
This breakout is further validated by the accompanying higher trading volumes, which lend credibility to the upward movement.
Moreover, on the weekly timeframe, the RSI has also experienced a breakout, further confirming the presence of positive momentum in the stock.
We anticipate further price appreciation in the near future, with a potential target level of Rs 265. It is advisable to implement a strict stop-loss at Rs 205, adhering to a closing basis.

ICICI Lombard General Insurance: Buy | LTP: Rs 1,332.7 | Stop-Loss: Rs 1,290 | Target: Rs 1,545 | Return: 16 percent
The stock has sustained above a 10-month high and formed a Higher Top Higher Bottom pattern, indicating a strong positive undertone. On the weekly charts, the stock has made a base formation near Rs 1,050-1,070 levels. Also, the stock has given a Cup & Handle pattern breakout, which confirms its bullish structure.
On the daily timeframe, the stock has broken the resistance of the Descending trend line with volume confirmation a few days ago, which shows the strong participation of bulls.
The momentum indicator RSI on the weekly timeframe is rising and sustaining above 65 levels, reflecting the presence of positive momentum. We expect the prices to move higher to Rs 1,525, where the stop-loss must be Rs 1,215 strictly on a closing basis.

Expert: Viraj Vyas, CMT, | technical & derivatives analyst - institutional equity at Ashika Stock Broking
CMS Info Systems: Buy | LTP: Rs 368.5 | Stop-Loss: Rs 344 | Target: Rs 410 | Return: 11 percent
The stock has demonstrated a series of alternating price movements with intermittent periods of heightened volatility. Following its peak in November 2022, the stock transitioned into an accumulation phase, characterised by the formation of a Rounding Bottom pattern.
The recent breakout above the neckline, supported by elevated trading volumes and a gap-up, signals increased strength and deliberate accumulation by astute market participants.

Apollo Hospitals Enterprises: Buy | LTP: Rs 5,126.9 | Stop-Loss: Rs 4,850 | Target: Rs 5,800 | Return: 13 percent
The stock emerged as a standout performer in the healthcare sector during the market's recovery from the COVID-19 pandemic. It experienced a remarkable rally, surging from Rs 1,200 to Rs 5,600. However, since November 2022, the stock has undergone a phase of correction in both price and time.
Recent price action indicates the formation of a Cup and Handle pattern, which typically signifies accumulation.
The breakout was accompanied by notable trading volumes, signalling renewed bullish sentiment. As a result, the stock is expected to reach new all-time highs in the near future.

JSW Steel: Buy | LTP: Rs 783.4 | Stop-Loss: Rs 735 | Target: Rs 875 | Return: 12 percent
The metal sector has undergone a significant period of consolidation in terms of both time and price since March 2020. Within this sector, JSW Steel has stood out as an impressive performer. Over the past 27 months, the stock has been in a consolidation phase and is now making an attempt to break above its previous all-time highs.
It has demonstrated strong relative momentum and strength compared to its peers. The presence of a Cup and Handle pattern suggests a potential price objective of at least Rs 850-875 levels for the stock.

Expert: Santosh Meena, head of research at Swastika Investmart
Sun Pharmaceutical Industries: Buy | LTP: Rs 1,021.8 | Stop-Loss: Rs 985 | Target: Rs 1,070 | Return: 5 percent
The counter is currently exhibiting a classical Cup and Handle formation, which is a bullish technical pattern. This formation is occurring around the clusters of the 50-day, 100-day, and 200-day moving averages (DMA), further reinforcing its significance.
In terms of potential price targets, there is an immediate resistance level of Rs 1,020. If the counter manages to surpass this hurdle, it suggests a strong possibility of a swift upward move towards Rs 1,070.
The momentum indicator, RSI, is showing positive positioning above the 50 mark. This indicates a favourable momentum for the counter, suggesting a potential continuation of the upward trend.
Additionally, the moving average convergence divergence (MACD) is trading above the centreline, further supporting the bullish sentiment.

Rainbow Childrens Medicare: Buy | LTP: Rs 977.45 | Stop-Loss: Rs 915 | Target: Rs 1,100 | Return: 12.5 percent
The counter is currently exhibiting a bullish momentum and is poised to potentially continue this trend by breaking out of a Bullish Flag formation. In the recent pullback, it found support at the previous breakout level of Rs 885. This level also coincides with the 38.2 percent retracement of the previous rally, adding further significance to it as a support level.
Moreover, the counter is trading above its important moving averages, indicating a positive bias. This suggests that the overall trend is bullish and that the counter has the potential to continue its upward movement.

Poly Medicure: Buy | LTP: Rs 1,149.65 | Stop-Loss: Rs 1,090 | Target: Rs 1,250 | Return: 9 percent
The counter recently emerged from a two-year consolidation phase, accompanied by notable trading volumes. It has been undergoing another period of consolidation over the past few days, making a Bullish Flag formation within a shorter time frame.
To provide immediate support, the rising 20-day moving average (DMA) and the previous breakout zone in the Rs 1,090-1,070 range are expected to play a significant role. These levels have the potential to act as strong support areas for the counter in case of any pullbacks.
In terms of momentum indicators within the shorter time frame, it is worth noting that they are currently indicating a slightly overbought condition.
However, it is important to consider that overbought conditions can persist for an extended period, suggesting that the counter may continue to exhibit strength despite these readings.

Discover the latest Business News, Sensex, and Nifty updates. Obtain Personal Finance insights, tax queries, and expert opinions on Moneycontrol or download the Moneycontrol App to stay updated!
Find the best of Al News in one place, specially curated for you every weekend.
Stay on top of the latest tech trends and biggest startup news.


