


Lagging indicator follows price movements and has less predictive qualities. The most well-known lagging indicators are the moving averages and Bollinger Bands.
The usefulness of these indicators tends to be lower during non-trending periods and high during trending periods. This is because lagging indicators focus more on the trend and produce fewer buy-and-sell signals.
This allows the trader to capture the trend instead of being forced out of their position based on the volatile nature of the leading indicators.
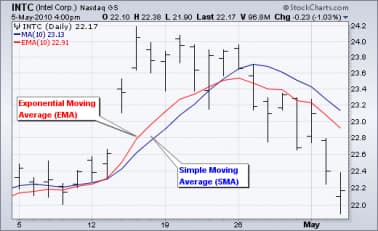
Moving AveragesMoving averages are one of the most popular and easy tools to use. They smooth a data series and makes it easier to spot trends, something that is especially helpful in volatile markets.
The two most popular types of moving averages are the Simple Moving Average(SMA) and the Exponential Moving Average (EMA).
A simple moving average is formed by computing the average (mean) price of a security over a specified period. While it is possible to create moving averages from Open, High, and Low data points, most moving averages are created using the closing price.
To remove lag in simple moving averages, EMA is used as it applies more weight to recent prices than old prices. The weighting applied to the most recent price depends on the specified period of the moving average.
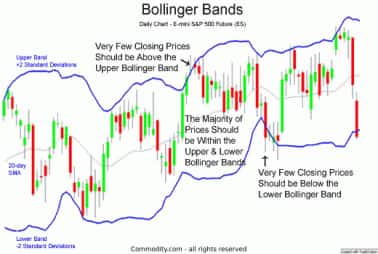
These are technical trading tools, also known as a volatility indicator. They use the mathematical concept of standard deviations to measure price volatility around a moving average to generate trading signals.
During periods of increased fluctuations, the bands will widen to take it into account and vice versa for a narrower focus to the price range.
The upper band is the standard deviation multiplied by a given factor above the simple moving average, and the lower band is the standard deviation multiplied by the same given factor below the simple moving average.
Discover the latest Business News, Sensex, and Nifty updates. Obtain Personal Finance insights, tax queries, and expert opinions on Moneycontrol or download the Moneycontrol App to stay updated!
Find the best of Al News in one place, specially curated for you every weekend.
Stay on top of the latest tech trends and biggest startup news.


