


Bata India, part of the Bata Shoe Organization, has mostly been an underperformer so far in 2021. Its shares rose by just 11 percent compared with the 18 percent gain in the Nifty50, and 20 percent in the S&P BSE 200 index.
However, in the last three months it has rallied over 20 percent to enter the bullish territory. It hit a fresh 52-week high of Rs 1,767.90 on August 18, and the momentum could well take it towards Rs 2,000 which translates into an upside of 13 percent from the last close of Rs 1,758 on the BSE.
Bata India, with a market capitalization of more than Rs 22,000 crore, is India’s largest retailer and leading manufacturer of footwear in India with about 1,600 retail stores.
The company’s portfolio includes casuals, fitness, and essential categories covering sneakers, open and sandals styles which have led to a faster pick-up in its volume growth.
Bata India has maintained healthy operating cashflows, asset turns (~8x) and EBITDA margins over the years, making it a capital-efficient business, said a report.
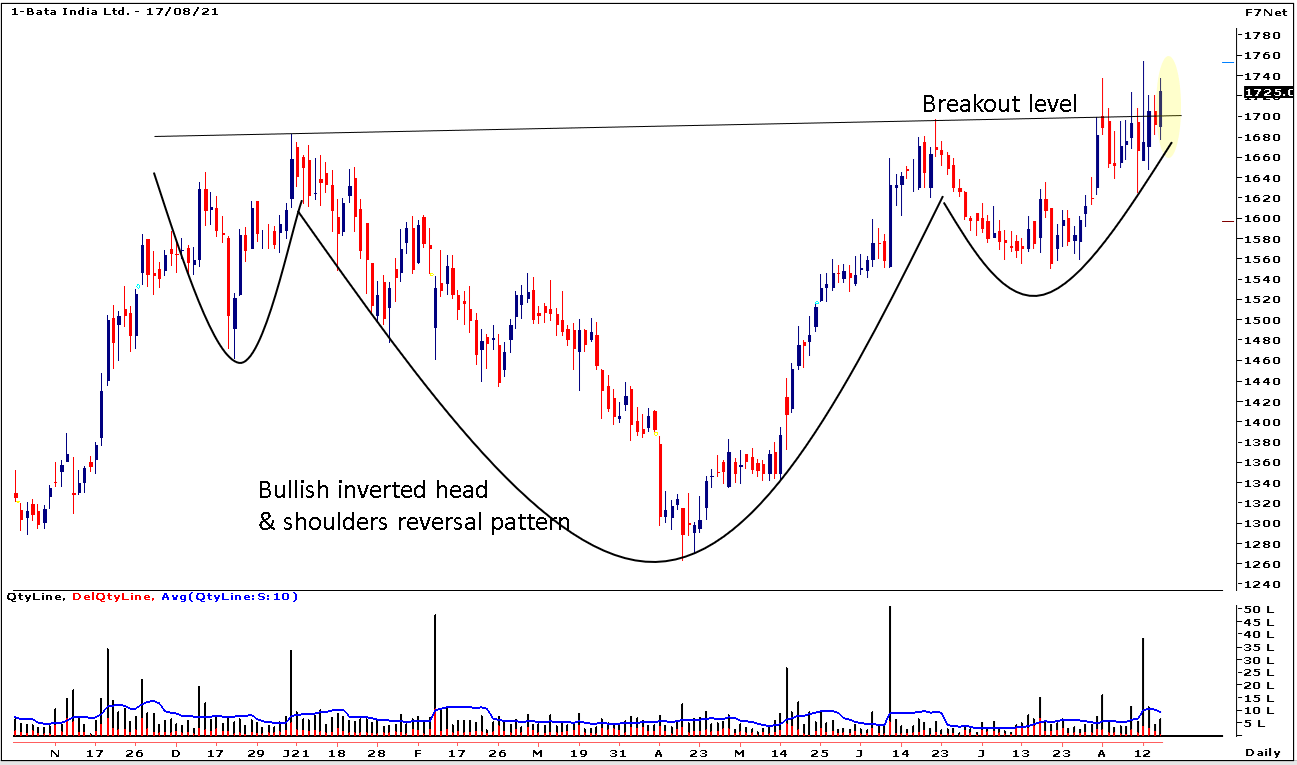 In terms of technicals, the stock is trading well above the short- and long-term moving averages. Pricewise, the stock has formed an inverted head and shoulders pattern, which projects a bearish-to-bullish trend reversal. The reversal pattern is formed after a downtrend and its completion marks a trend reversal to the uptrend. “Inverse Head and Shoulders is a bullish bottoming out pattern. For the last couple of weeks stock has been consolidating at breakout level and closed at a new high above the breakout level,” Ashish Chaturmohta, Director Research, Sanctum Wealth Management, said. “Moving average convergence and divergence (MACD) indicator has given positive crossover with its average on the monthly chart indicating long term shift in trend,” he said. Chaturmohta suggests investors buy the stock at current levels or on dips towards Rs 1,720, with a stop loss below Rs 1,640, and a target of Rs 2,000 can be seen in the coming 4-6 months. Disclaimer: The views and investment tips expressed by experts on Moneycontrol.com are their own and not those of the website or its management. Moneycontrol.com advises users to check with certified experts before taking any investment decisions.
Discover the latest Business News, Sensex, and Nifty updates. Obtain Personal Finance insights, tax queries, and expert opinions on Moneycontrol or download the Moneycontrol App to stay updated!
Find the best of Al News in one place, specially curated for you every weekend.
Stay on top of the latest tech trends and biggest startup news.


