


Alkem Laboratories Ltd shares are witnessing a breakout from sideways consolidation phase, accompanied by significant long positions being added in futures.
"The stock has also seen a bullish crossover in its momentum indicator, MACD, on both daily and weekly charts, which is a positive sign for the stock in the short to medium term," says Jay Thakkar, Head of Quantitative and Derivative Research at ICICI Securities.
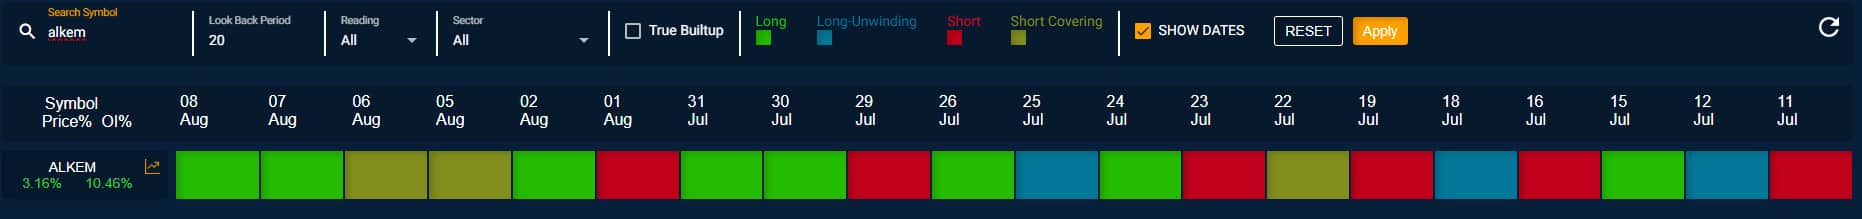 Above is the Futures OI built up cycle indicating long built up in august series in Alkem Ltd |Source: ICICI SecuritiesProtective Put Strategy Recommended by Thakkar:
- Buy 1 Lot of Alkem Futures at CMP: Rs 5,712
- Buy 1 Lot of Alkem 5500 PE at Rs 145.60
- Breakeven: Rs 5,857.60
- Stop Loss: Rs 5,500 on a closing basis
- Target: Rs 6,300 and Rs 6,600
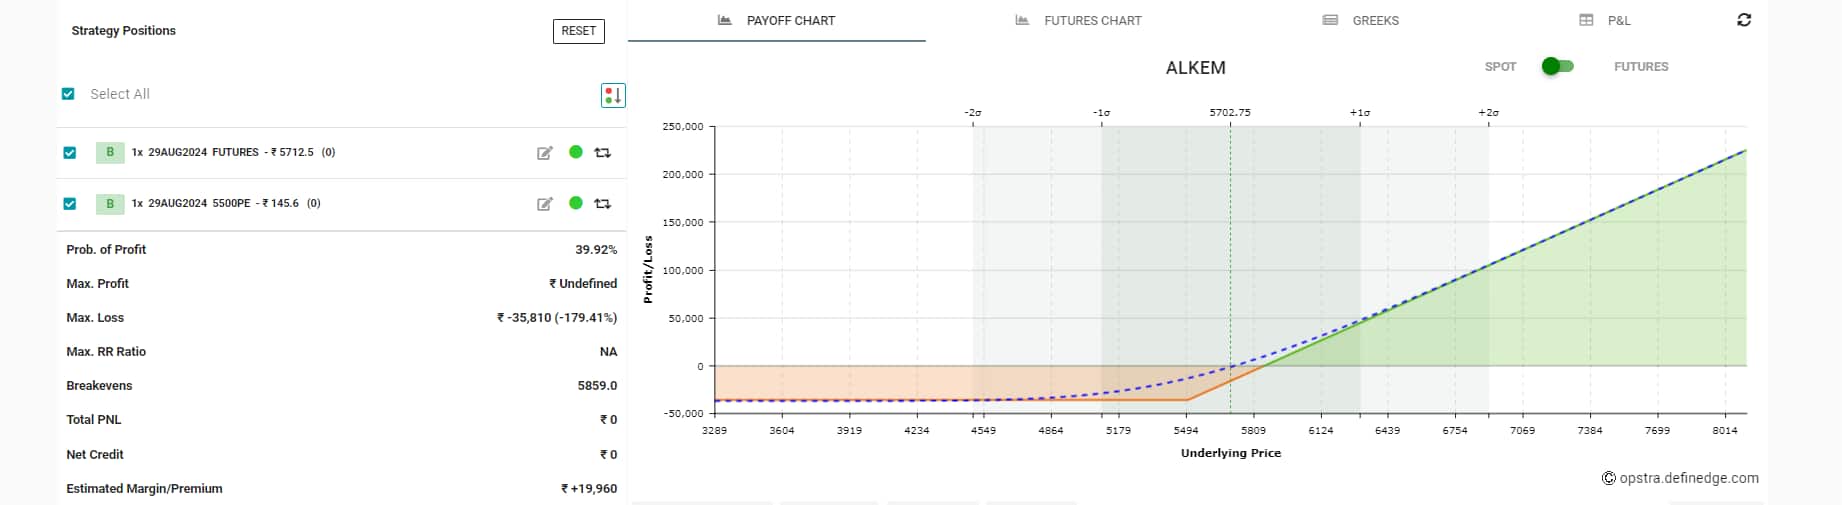 Payoff chart showing protective put strategy on Alkem Ltd| Source: opstra.definedge.comTechnical Setup
Thakkar says that Alkem stock's breakout from a sideways consolidation pattern resembles a rectangular structure or a sideways range. "This range spans approximately 800 points on a closing basis, with the breakout level above Rs 5,500. As long as the stock trades above Rs 5,500, the overall outlook remains positive," he adds.
Additionally, the stock has broken out above an upward-sloping channel that was forming within the sideways consolidation range. According to Thakkar, this indicates a multiple-range breakout for the stock, with increased volumes, making it a price-volume-momentum breakout.
Derivatives DataThe stock has seen a significant long buildup in its futures data for the August series. The max pain and modified max pain levels are Rs 5,450 and Rs 5,569, respectively, and the stock is trading well above these levels, signaling a short-term positive outlook.
"The stock has provided a breakout with significant long additions as open interest (OI) has surged by more than 10%, along with an increase in price and volumes. This suggests a positive outlook for the stock in the August series," says Thakkar.
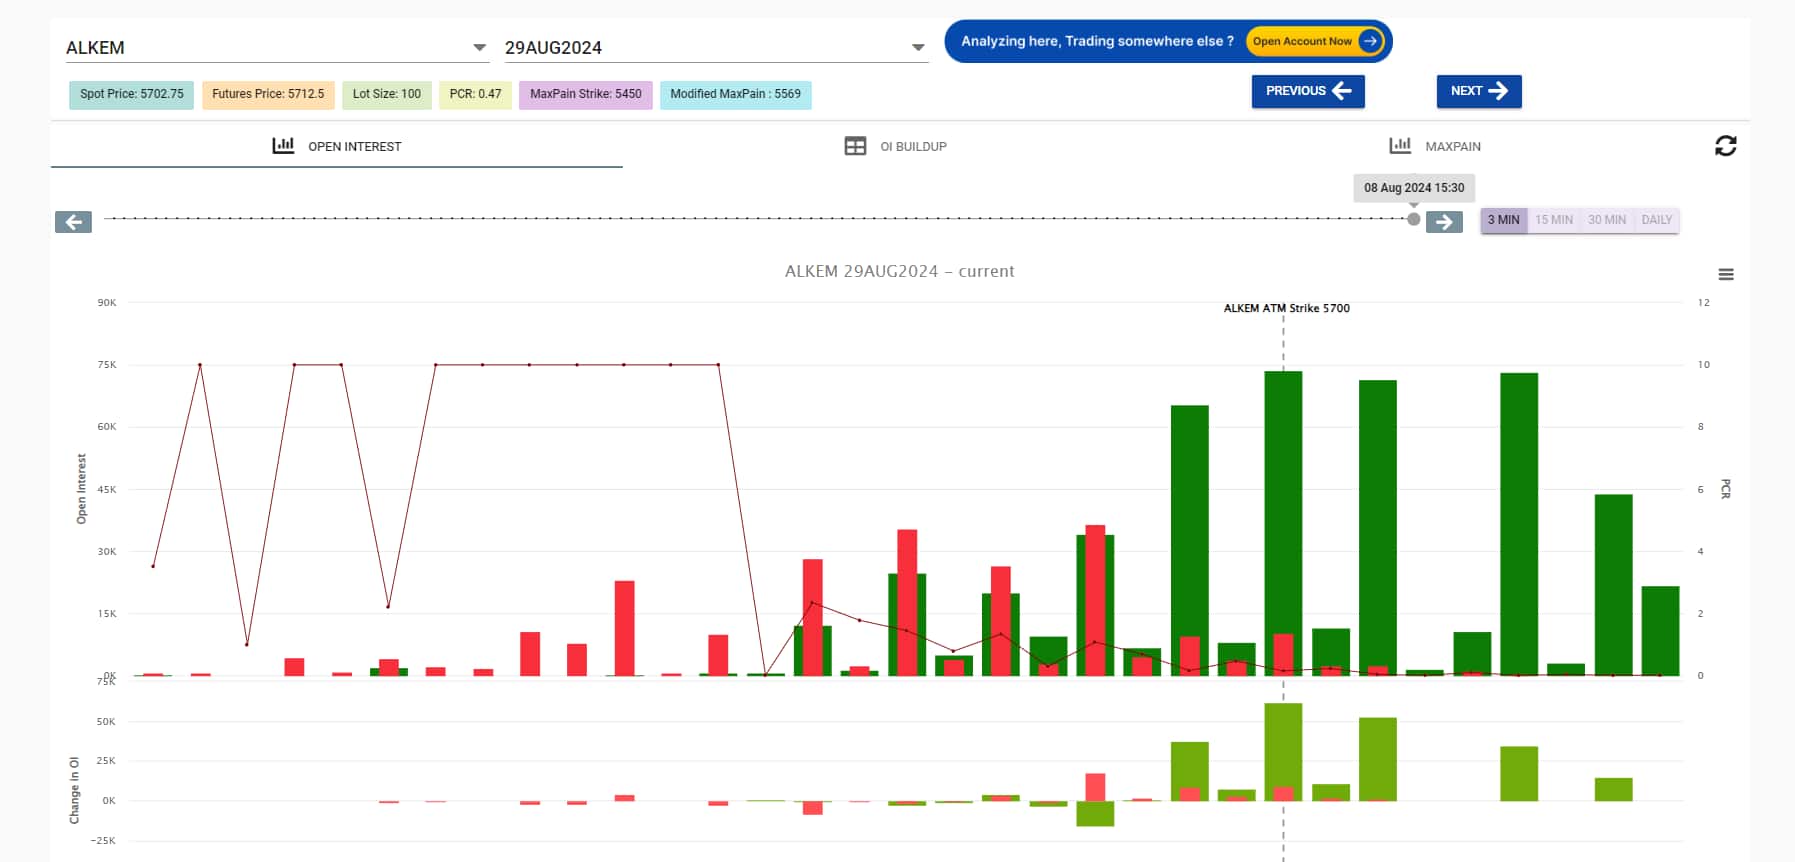 Chart showing options chain of Alkem Ltd
Thakkar further notes that options data indicates clear unwinding of call options at lower levels, especially at the Rs 5,500 strike, which is the breakout level. There has also been substantial OI addition from Rs 5,500 to Rs 5,200 levels. "However, the put-call ratio (PCR) is still below 1, indicating an oversold condition due to significant call OI from Rs 5,600 to Rs 5,800, which may act as resistance going forward. Therefore, hedging naked longs is advisable, and a protective put strategy is recommended, where a long position in futures is hedged with a long put."
Disclaimer: The views and investment tips expressed by investment experts on Moneycontrol.com are their own and not those of the website or its management. Moneycontrol.com advises users to check with certified experts before taking any investment decisions.
Discover the latest Business News, Sensex, and Nifty updates. Obtain Personal Finance insights, tax queries, and expert opinions on Moneycontrol or download the Moneycontrol App to stay updated!
Find the best of Al News in one place, specially curated for you every weekend.
Stay on top of the latest tech trends and biggest startup news.


