


The Nifty exhibited volatility throughout the day but managed to recover from the lowest point of the day before closing. The overall market trend remains bearish, with the Nifty trading below critical moving averages.
Looking ahead, the market may continue to follow a bearish trend as long as it remains below 19,500, with initial support likely around 19,330, a fall below the said level might take the Nifty towards 19,250-19,200.
The bears in the Bank Nifty maintained their control, causing the index to break below the support at 44,200. The next immediate support level is positioned at 43,800, and a breach below this level could trigger aggressive selling pressure, potentially leading to a further 2 percent correction in the index.
On the upside, the immediate resistance is in the range of 44,250 to 44,300. A breakout above this range may incite some short-covering moves in the index.
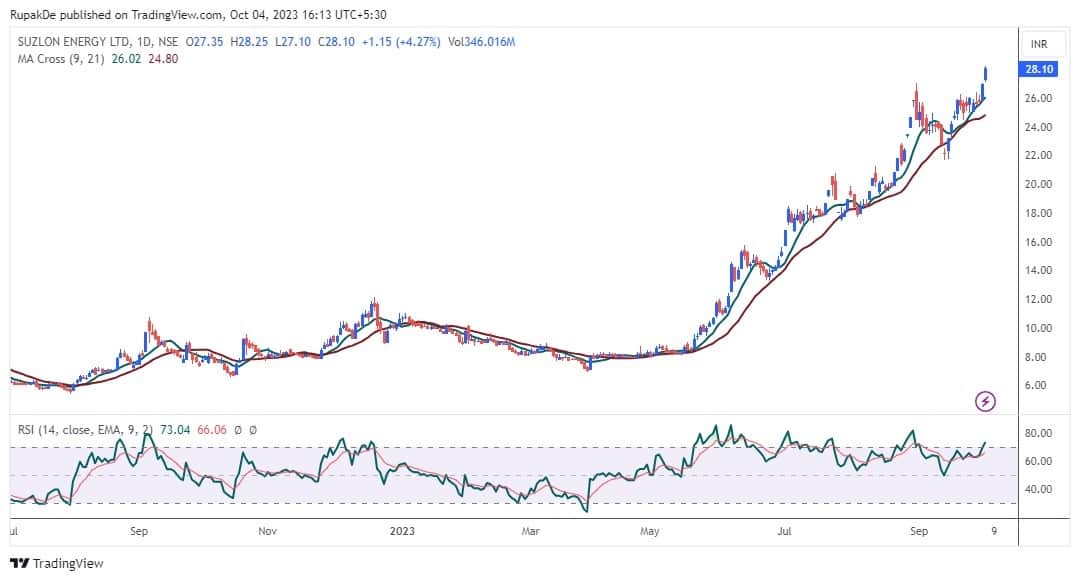
Here are three buy calls for short term:Suzlon Energy: Buy | LTP: Rs 28.10 | Stop-Loss: Rs 27 | Target: Rs 30-32 | Return: 14 percentSuzlon has experienced upward momentum over the past two days after breaking out of a consolidation phase. Additionally, the stock has remained above a crucial moving average.
The relative strength index (RSI) is currently showing a bullish crossover and is on the rise. The support is established at Rs 27 on the lower end, while resistance is observed in the range of Rs 30 to Rs 32 on the higher end.
TCS exhibited a bullish sentiment as it formed a Bullish Engulfing candlestick pattern on the daily chart, signaling a bullish reversal. Furthermore, the stock managed to close above its 20-day moving average (20DMA), confirming its bullish undertone.
The momentum indicator RSI is poised for a positive crossover, further affirming the presence of strong momentum. The support for TCS is currently at Rs 3,430, with potential upside levels at Rs 3,640 and Rs 3,800.

HDFC Bank has shown a strong upward movement, rebounding from the day's low. Multiple swing highs and lows can be observed around Rs 1,515, suggesting that this level is likely to provide support for the stock price.
Additionally, a positive divergence is evident on the daily chart. In the short term, it is anticipated that the stock will advance towards Rs 1,650. On the downside, the support is positioned at Rs 1,485.


Discover the latest Business News, Sensex, and Nifty updates. Obtain Personal Finance insights, tax queries, and expert opinions on Moneycontrol or download the Moneycontrol App to stay updated!
Find the best of Al News in one place, specially curated for you every weekend.
Stay on top of the latest tech trends and biggest startup news.


