


The Nifty has gained about 50 percent from the lows in March 2020. The markets haven’t corrected despite India’s first quarter GDP growth plunging to a multidecadal low. There is still a lot of chatter around the fact that the markets currently don't reflect the fundamentals.
There are many questions in a retail investor’s mind: is it a good time to buy? Will the market go up from here or is it a good time to sell? Stock market experts and analysts too, present differing views. Here a not-so-often used ratio can come to the rescue.
As per Investopedia, the Bond Equity Earnings yield Ratio (BEER) is a yardstick used to evaluate the relationship between bond yields and earnings yields in the stock market. Earnings yield is just the inverse of the price-to-earnings (P-E) multiple. The BEER is simply Bond Yield divided by Earnings Yield. If the ratio is above 1.0 the stock market is said to be overvalued; a reading of less than 1.0 indicates the stock market is undervalued.
In the Indian context, we recommend using a variant of this ratio, which for simplicity, we have named PREITY (PRice Earnings by Inverse of Tbill Yield). Using this ratio will help retail investors track the stock markets, make decisions regarding asset allocation and optimize returns.
PREITY Ratio = (P-E Ratio X 91 Day T-Bill Yield) / 100)The P-E ratio is available on a daily basis on the NSE website since 2000. Data on the 91 day T-Bill primary rate can be sourced from RBI’s website as well as from the sites of any debt market trading aggregator.
We have used the 91-day Treasury bill as it coincides with the frequency of quarterly results announcements of listed companies. It is also at the lowest end of the tenure spectrum and thereby captures the sentiment regarding prevailing interest rates.
The chart below depicts the ratio over the last 20 years.
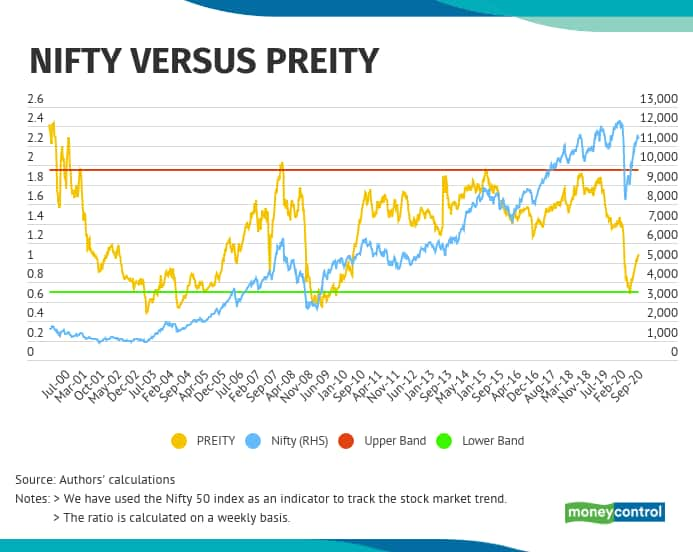
In order to simplify the visual we have also incorporated a range band (0.70-1.95) capturing PREITY’s trend. (Statistically, it depicts PREITY’s 1.5x standard deviation).
Whenever PREITY is at or above 1.95 then it’s a signal to sell and a buy signal gets triggered whenever it’s at or below 0.7. PREITY’s average weekly movement shows that it has hovered within 0.70 to 1.95 band about 90 percent of the time during the last 20 years.
Also, during this period, whenever PREITY has either increased or decreased. Nifty’s average weekly close too has correspondingly increased or decreased, about 80 percent of the time.
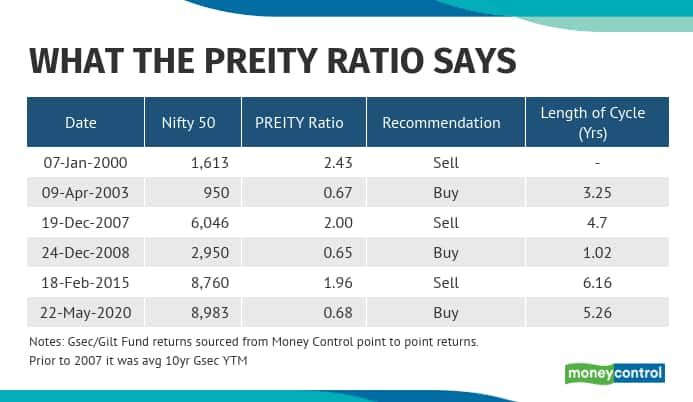
PREITY tends to move uni-directionally. Once it breaches 1.95 it keeps falling till it reaches 0.7 and after that it starts rising till it again reaches 1.95 and thus the cycle continues. Till date, it has completed two full cycles. Now, between Feb 2015 and May 2020 it completed one half of that cycle (1.95 to 0.7).
Contrary to expectations, PREITY movement’s is influenced more by interest rates rather than EPS growth. For example, between 2010 and 2013, when the Nifty’s EPS grew 50 percent, the index itself rose only 20 percent because interest rates increased from 3.4 percent to 8.7 percent.
Similarly, between 2013 and 2018, the Nifty doubled despite its EPS remaining flat, because interest rates had fallen to below 4 percent.
In 2000 when the PREITY was higher than 2.3, Nifty’s P-E was hovering between 25-26. Today when the P-E is around 32, the highest level in 20 years, PREITY is around 1.0. In January 2020 when the Nifty touched its all-time high, its P-E was 28.6 and when it touched a low in May 2020, its P-E was 21.0.
This shows that standalone or absolute P-E ratio levels seem to be less relevant.
Our analysis shows that the Nifty has historically made new highs every time PREITY crossed 1.95 and sharply corrected till PREITY fell below 0.7 levels, post which it started rising again.
PREITY has been moving in a steady pattern of either falling or rising without much sideways movement. This also coincided with Nifty’s rallying and subsequent correction.
However, starting 2015 till 2019 after touching 1.95, PREITY started moving sideways (within 1.5-1.9 band, barring in 2017 when it was between 1.3-1.5). During this period Nifty continued to rise and made new highs.
However, even during these times if one had stuck to PREITY’s guidance one would have been handsomely rewarded.
For example, in Feb 2015, PREITY was at 1.95 and the Nifty at around 8700. If one had sold equity at those levels and shifted to debt then the returns would have been higher than equity. (Gilt funds over the last 5yrs have yielded around 9 percent CAGR while Nifty touched around 9k in May 2020 yielding only 0.5 percent CAGR).
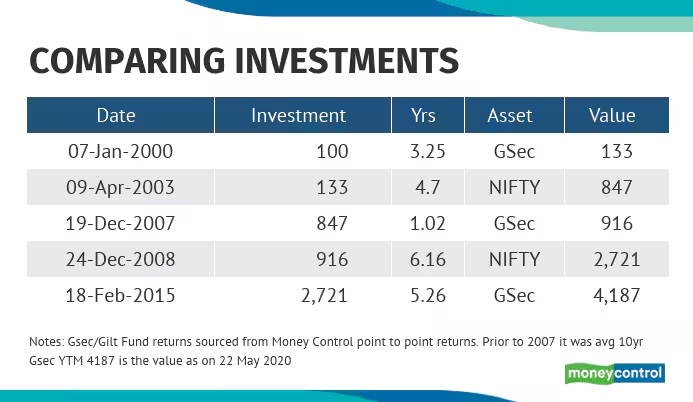
Hence, guided by PREITY along with patience and diligence, an investor can not only book profit on equities at an appropriate time but also optimize returns by shifting between equity and debt.
Rs. 100 invested according to this strategy would have become Rs. 4,187 in 20 years while Rs. 100 invested in NIFTY would have become approx. Rs. 750. This table also in a subtle way captures the need to keep rotating / allocation between equity and debt to optimize returns.
PREITY’s peak and trough level do not coincide with Nifty’s peak or trough; but within a short span of time Nifty’s movement follows the PREITY’s trend. NIFTY 50 reached its low of 7,610 on March 23, 2020 when the PREITY ratio was 0.95. PREITY reached the 0.7 levels only 2 months later on May 22, 2020 when NIFTY reached 8,983 levels.
It helps in optimizing your returns rather than maximizing it. PREITY like its name suggest is a pretty good indicator for investment (BUY & HOLD and SELL & WAIT) rather than speculation and hence using it for trading (intra-day/week/month) may not optimize returns / turn risky
It cannot be replicated on individual stocks as they are also impacted by non-P&L centric issues like balance sheet, corporate governance, industry specific issues etc.
To sum up, currently the ratio is at 1.05 levels, indicating it is still some distance from 1.95. To maximize the returns, one should not worry about the current volatility and sell in panic.
Discover the latest Business News, Sensex, and Nifty updates. Obtain Personal Finance insights, tax queries, and expert opinions on Moneycontrol or download the Moneycontrol App to stay updated!
Find the best of Al News in one place, specially curated for you every weekend.
Stay on top of the latest tech trends and biggest startup news.


