


Technical charts of Hindustan Aeronautics Limited (HAL) suggest a breakout on upper side on the daily scale, supported by a spurt in volumes. Sudeep Shah, Head of Technical and Derivative Research at SBI Securities, expects the stock to move to Rs 3,010 in the near term and subsequently to Rs 3,070.
At 10.55 am on January 4, HAL was trading at Rs 2,907.35 on the National Stock Exchange, up 37.35 points, or 1.3 percent, from the previous close.
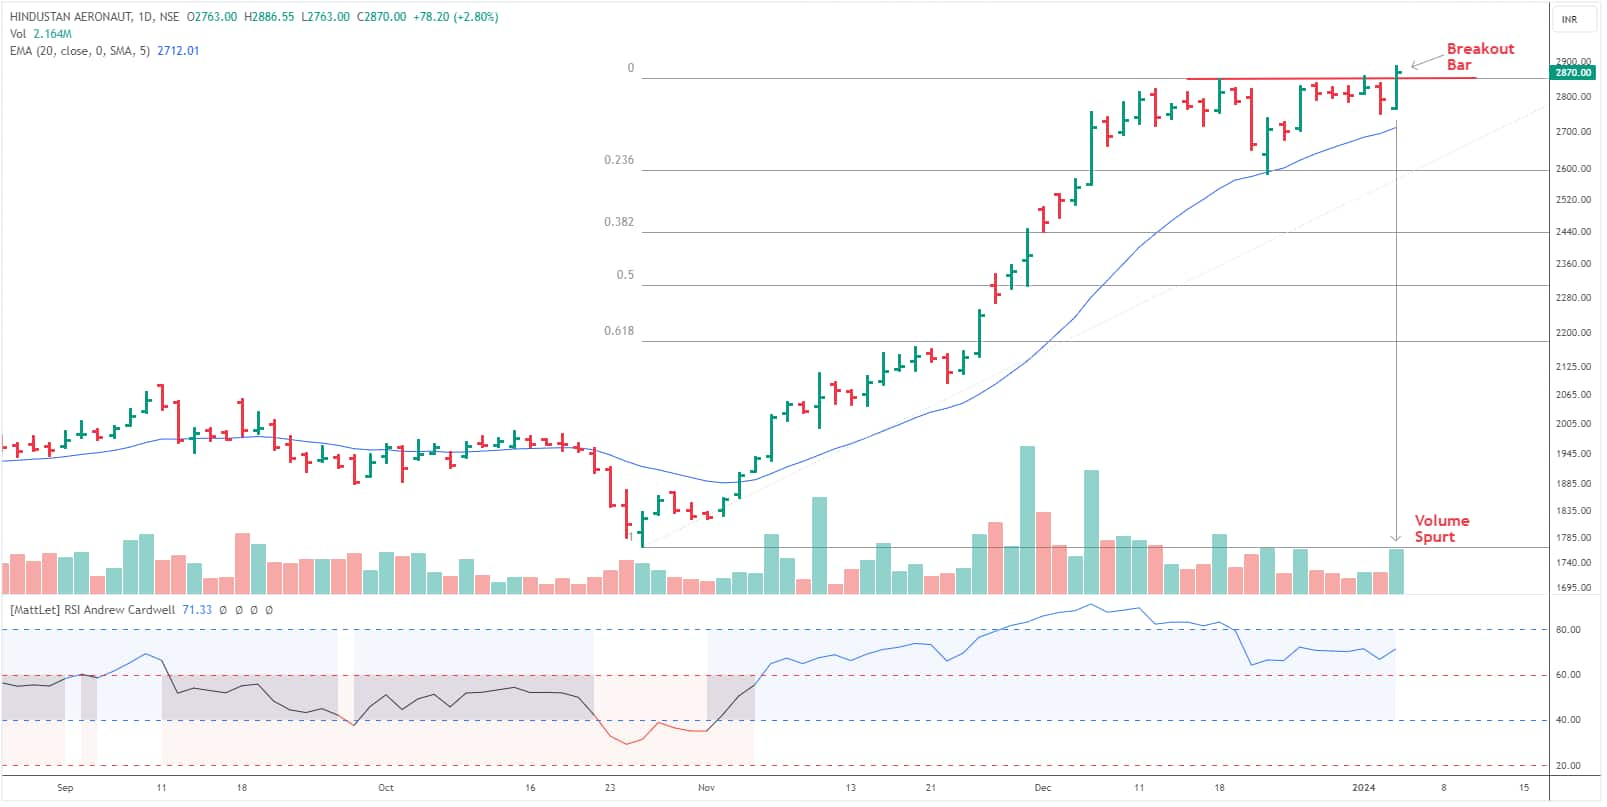 HAL technical chart showing a horizontal trendline breakout | Source: SBI Securities
HAL reached its peak at Rs 2,850 on December 18 followed by a minor pullback. Throughout this pullback phase, the volume activity remained below average, suggesting a normal decline following a significant upward rally, Shah said.
"Notably, the correction found support around the 20-day exponential moving average (EMA) level, aligning with the 23.6 percent Fibonacci retracement level calculated from its earlier upward surge (Rs 1,768-2,850)," he said.
The stock has formed a strong base near the support zone, and on January 3, it gave a horizontal trendline breakout on the daily scale. The breakout was supported by a volume spurt, he said.
All the moving averages-based setups suggest a bullish momentum. The daily and weekly relative strength indices (RSIs) are in the super bullish zone. The daily stochastic has also given a bullish crossover.
On the derivative front, Shah said, "The January series future has surged by 2.79 percent. The cumulative OI (open interest) of the current, next, and far series has surged by nearly 7 percent, indicating overall long build-up."
A significant concentration of call open interest is seen at the 2,900 strike followed by the 3,000 strike, while substantial open interest on the put side is concentrated at the 2,860 strike, he said.
There has been a discernible accumulation of long positions in the 2,900 Call strike. Conversely, on the put side, 2,920 to 2,780 strikes have either witnessed put writing or put long covering. This clearly indicates bullish momentum in the stock.
In light of the positive alignment of technical and derivative factors, Shah advises accumulating the stock in the Rs 2,880-2,850 zone, with a stop loss at Rs 2,780. Short-term projections indicate an upward trajectory, with initial targets set at Rs 3,010 and then Rs 3,070.
Disclaimer: The views and investment tips expressed by investment experts on Moneycontrol are their own and not those of the website or its management. Moneycontrol advises users to check with certified experts before taking any investment decisions.
Discover the latest Business News, Sensex, and Nifty updates. Obtain Personal Finance insights, tax queries, and expert opinions on Moneycontrol or download the Moneycontrol App to stay updated!
Find the best of Al News in one place, specially curated for you every weekend.
Stay on top of the latest tech trends and biggest startup news.


