


Weak global cues weighed on market sentiment, dragging the benchmark indices down by seven-tenths of a percent on August 8. On the NSE, approximately 1,382 shares declined compared to 966 advancing shares. The Nifty 50 has been in a consolidative phase following a recent correction. Experts suggest that unless it decisively climbs and sustains above 24,400—where the highest Call open interest is placed—the consolidation may continue, with support at the 24,000 mark. Here are some trading ideas for the near term:
Amol Athawale, V P Technical Research at Kotak SecuritiesDabur India | CMP: Rs 637.5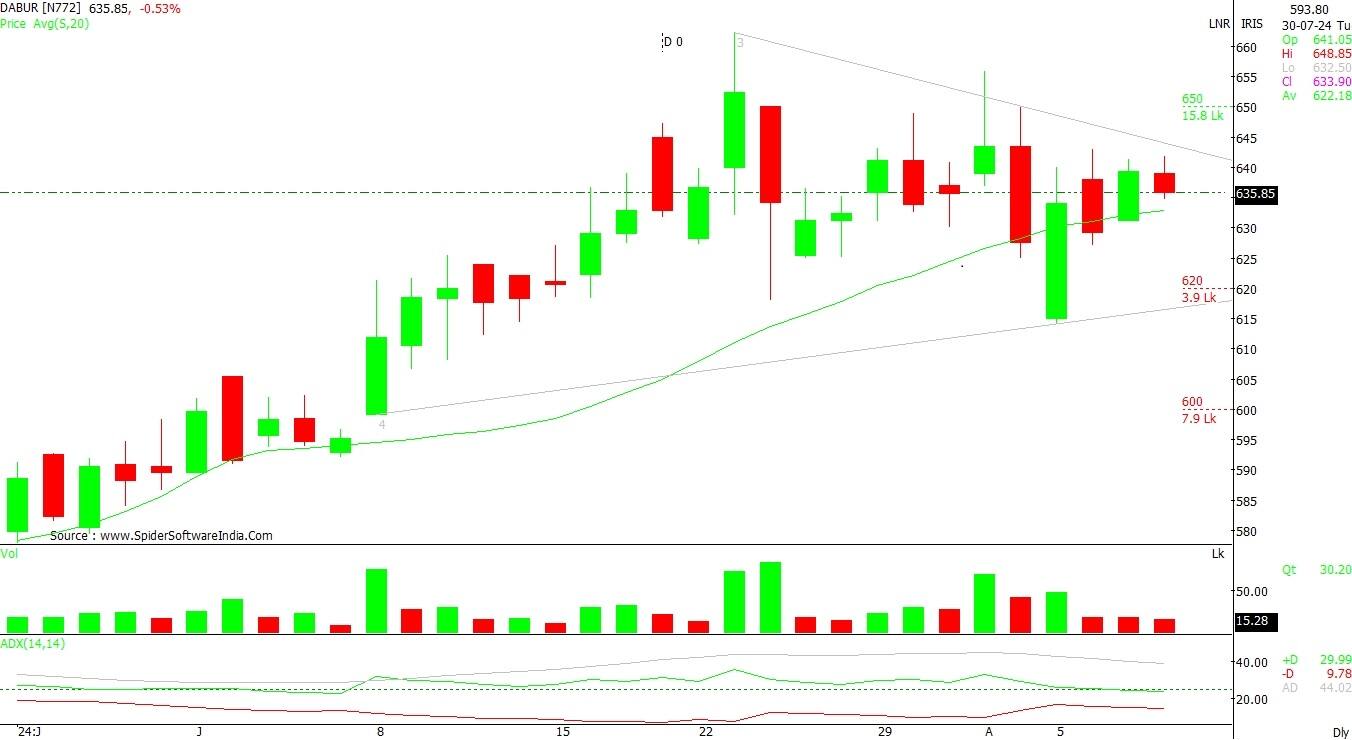
After a remarkable upward move, Dabur India is trading in a symmetrical triangle chart formation on the daily scale, indicating that bullish momentum is likely to continue in the short term. Additionally, the stock has formed a higher bottom formation, suggesting good strength in the counter for a fresh breakout move in the near future.
Strategy: Buy
Target: Rs 680
Stop-Loss: Rs 610
PVR INOX | CMP: Rs 1,455.20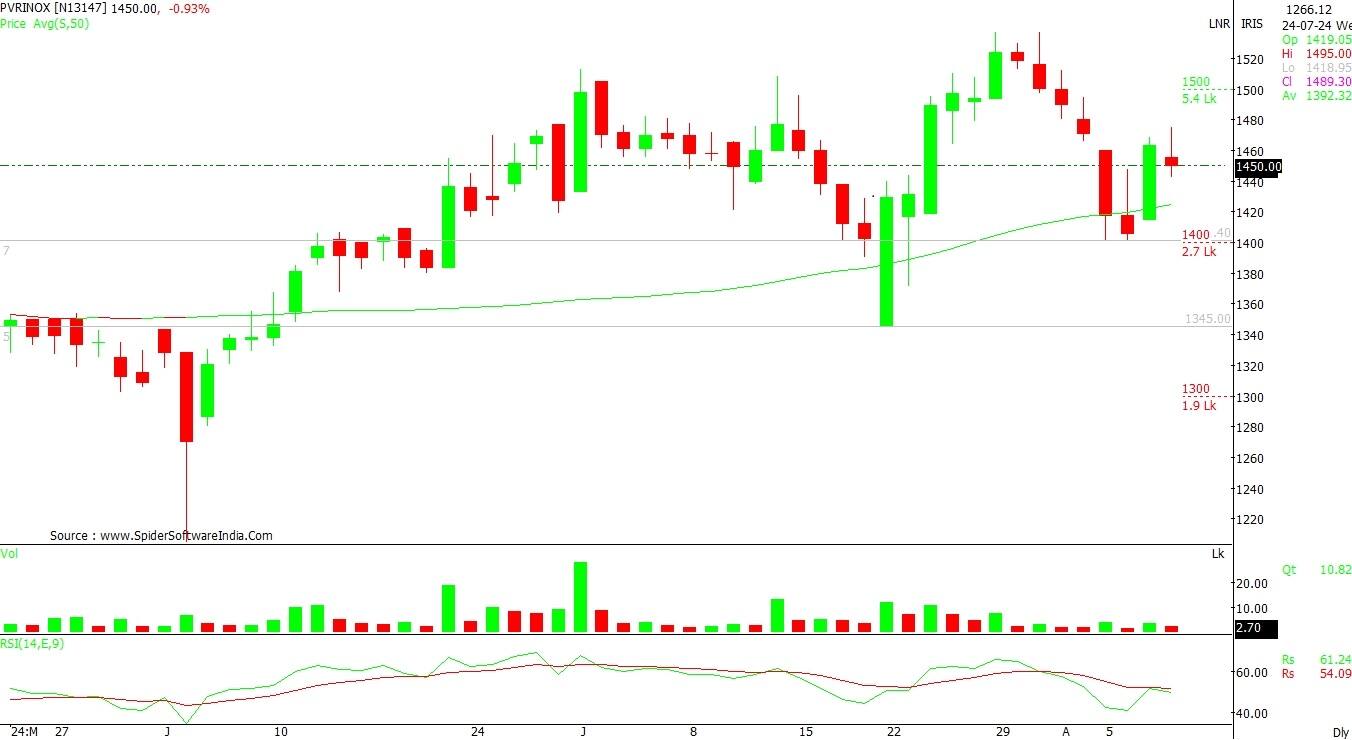
Following a short-term correction from higher levels, the downward momentum in PVR INOX has halted around its support area. On daily charts, the counter has formed a reversal formation at its important demand zone. The structure indicates a revival of the uptrend from the current levels in the near term.
Strategy: Buy
Target: Rs 1,550
Stop-Loss: Rs 1,400
Clean Science and Technology | CMP: Rs 1,590.75
On the weekly scale, Clean Science was trading in a rangebound mode post-correction from higher levels. However, it has now given a range breakout along with good volumes. Moreover, the daily charts show a higher bottom series, and closing above the resistance line suggests further bullish momentum from the current levels.
Strategy: Buy
Target: Rs 1,700
Stop-Loss: Rs 1,530
Mandar Bhojane, Equity Research Analyst at Choice BrokingEclerx Services | CMP: Rs 2,527.25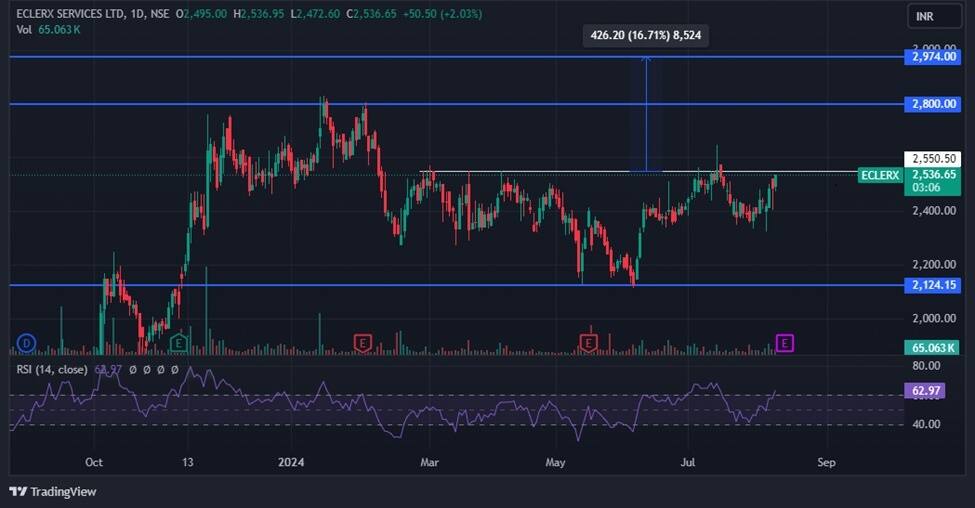
Eclerx Services is poised for a breakout from its daily chart range, having retested that range with a significant increase in trading volume. This suggests a potential bullish reversal. If the price closes above the Rs 2,550 level, it could reach short-term targets of Rs 2,800 and Rs 2,974. On the downside, immediate support is located at Rs 2,400, which can be considered as a buying opportunity on dips. The Relative Strength Index (RSI) is currently at 62 and trending upward, indicating increasing buying momentum.
Strategy: Buy
Target: Rs 2,800, Rs 2,974
Stop-Loss: Rs 2,325
CRISIL | CMP: Rs 4,471.55
CRISIL is ready for a descending triangle breakout on the daily chart, with a significant increase in trading volume indicating a potential breakout. If the price closes above the Rs 4,470 level, it may reach short-term targets of Rs 4,800 and Rs 5,000. Immediate support is located at Rs 4,200, which can be considered as a buying opportunity on dips. The RSI currently stands at 59 and is trending upward, indicating increasing buying momentum.
Strategy: Buy
Target: Rs 4,800, Rs 5,000
Stop-Loss: Rs 4,100
Max Financial Services | CMP: Rs 1,106.6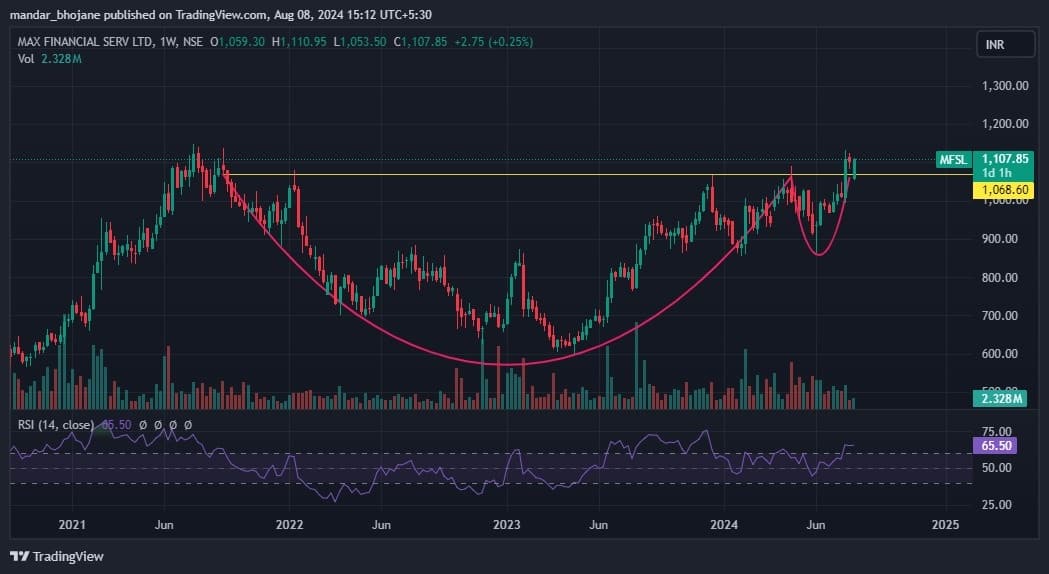 Max Financial Services has recently broken out of a Cup and Handle pattern on the daily chart, accompanied by a significant increase in trading volume, indicating a potential breakout. If the price closes above the Rs 1,120 level, it may reach short-term targets of Rs 1,240 and Rs 1,330. Immediate support levels are located at Rs 1,040, which can be considered as buying opportunities on dips. The RSI currently stands at 59 and is trending upward, indicating increasing buying momentum.
Strategy: Buy
Target: Rs 1,240, Rs 1,330
Stop-Loss: Rs 1,000
Chandan Taparia, Head - Equity Derivatives & Technicals, Broking & Distribution at Motilal Oswal Financial ServicesLupin | CMP: Rs 2,050.8
Lupin is in a continuous uptrend, clearly outperforming within the Pharma space. It has been forming higher highs and higher lows over the past four trading sessions, with support levels gradually shifting higher. Pharma stocks are witnessing fresh buying interest with a surge in trading and delivery volumes.
Strategy: Buy
Target: Rs 2,200
Stop-Loss: Rs 1,970
Trent | CMP: Rs 5,644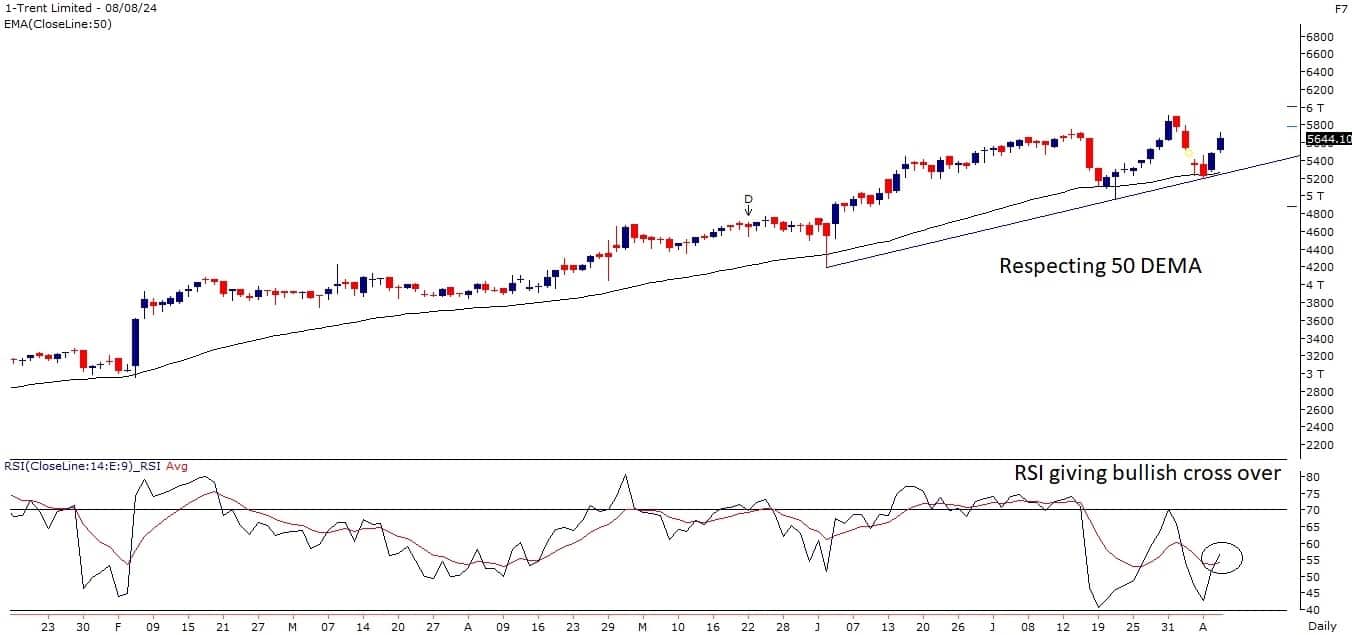
Trent is perfectly respecting the 50-day Exponential Moving Average (DEMA) and inching upwards. It has formed a strong bullish candle on the daily chart and is trading near its life highs. The momentum indicator RSI has given a bullish crossover, which may drive prices higher.
Strategy: Buy
Target: Rs 6,000
Stop-Loss: Rs 5,470
ICICI Prudential Life Insurance Company | CMP: Rs 738.65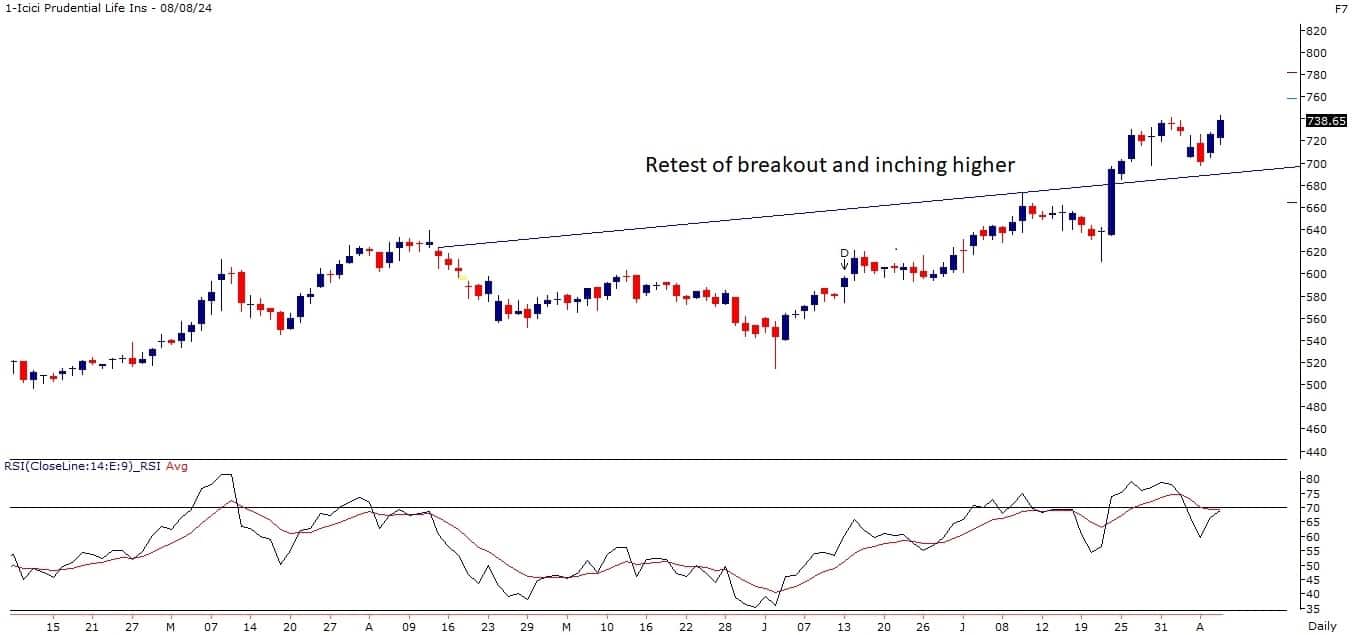
ICICI Prudential Life has retested a breakout on the daily chart and scaled higher. Insurance stocks are holding up well despite market volatility, showing outperformance. The ADX (Average Directional Index) indicator has turned up, suggesting that the upward move has strength to support it.
Strategy: Buy
Target: Rs 780
Stop-Loss: Rs 715
Virat Jagad, Technical Research Analyst at Bonanza PortfolioAlkem Laboratories | CMP: Rs 5,687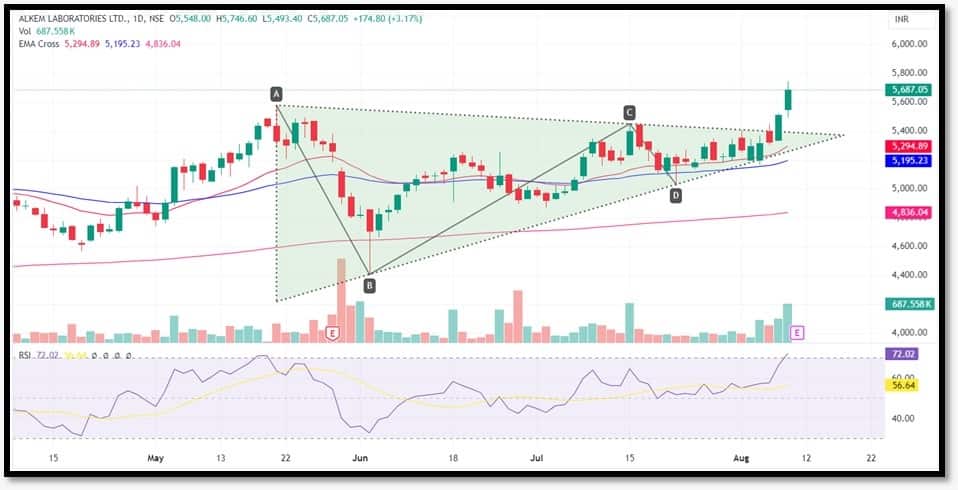 On the daily chart, Alkem Laboratories has recently broken out from a symmetric rectangle pattern, signaling a potential upward trend. The increase in trading volume over time suggests growing investor participation and confidence in the stock. Additionally, the price has taken support from the Fast (21) EMA and Slow (50) EMA, which will act as support in the coming days. Trading above the EMAs indicates a positive trend. On the momentum front, the RSI is heading north, confirming the bullish stance.
Strategy: Buy
Target: Rs 6,160
Stop-Loss: Rs 5,450
ITC | CMP: Rs 494.75
ITC's daily chart displays a confirmed breakout from a Flag and Pole Pattern with heightened volume, signaling buyer resurgence. Trading near the high, backed by support from the Fast and Slow EMAs, signifies positive price action and sentiment. The upward trend in the Slow EMA and a positive RSI breakout reflect a strong uptrend. Additionally, the DMI+ (Directional Movement Index) leading DMI- indicates a favourable trend, while the ADX trading above the 40 mark suggests increasing strength in market dynamics.
Strategy: Buy
Target: Rs 525
Stop-Loss: Rs 480
Ipca Laboratories | CMP: Rs 1,361.35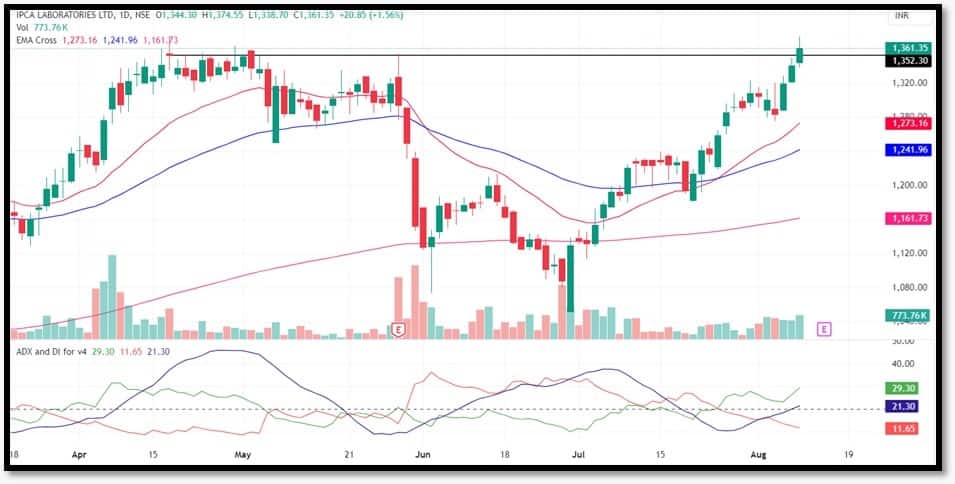
Ipca Laboratories has recently shown a breakout from a rounding bottom pattern on the daily time frame, signaling an uptrend. This pattern is typically seen as a bullish indicator, suggesting a potential rise in price. The surge in volume during the last trading session highlights increased buying interest at the current price levels, reinforcing a positive outlook for the stock. Moreover, the price is trading above major EMAs, further confirming the uptrend. Additionally, the DMI shows the DMI+ leading the DMI-, indicating a favourable trend. The ADX is trading above the 20 mark, suggesting strengthening market dynamics. These technical indicators collectively support a bullish outlook for Ipca Laboratories.
Strategy: Buy
Target: Rs 1,480
Stop-Loss: Rs 1,300
Oil India | CMP: Rs 612.85 On the daily time frame, Oil India has formed a pennant pattern. The current formation shows bullish price action, indicating that buyers are actively purchasing the security with expectations of higher prices. The stock is trading above major EMAs, signaling a positive trend. Notably, the Slow EMA (50) is trending upward, further indicating a positive trend. On the momentum front, the RSI is moving upward, confirming the bullish outlook for the stock. These technical indicators suggest that the market sentiment for Oil India is optimistic.
Strategy: Buy
Target: Rs 660
Stop-Loss: Rs 590
Disclaimer: The views and investment tips expressed by investment experts on Moneycontrol.com are their own and not those of the website or its management. Moneycontrol.com advises users to check with certified experts before taking any investment decisions.Discover the latest Business News, Sensex, and Nifty updates. Obtain Personal Finance insights, tax queries, and expert opinions on Moneycontrol or download the Moneycontrol App to stay updated!
Find the best of Al News in one place, specially curated for you every weekend.
Stay on top of the latest tech trends and biggest startup news.


