


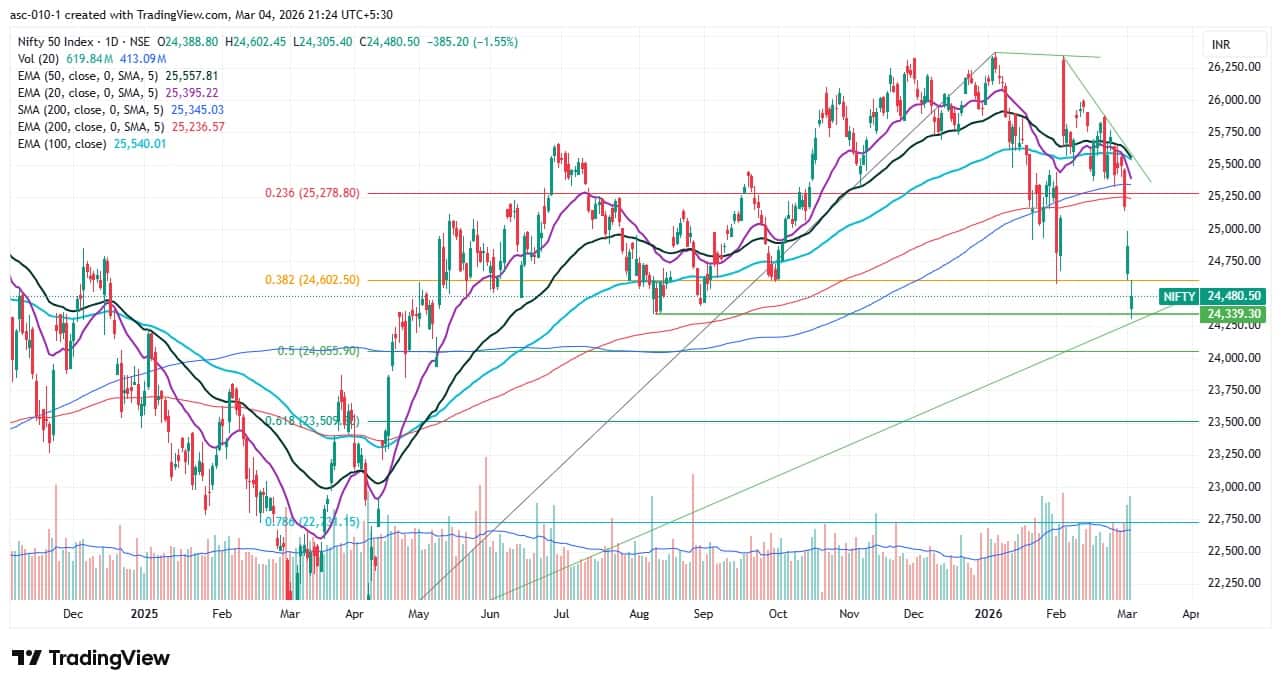
The Nifty 50 decisively broke the February low and closed 1.55 percent lower on March 4 after another gap-down opening amid rising tensions between the US-Israel bloc and Iran. Momentum weakened further, the VIX surged to a 10-month high, and caution prevailed in the markets amid global geopolitical tensions. However, the index managed to defend the 24,300 level (which coincides with the August 2025 low and the long upward-sloping support trendline adjoining the March 2020 and April 2025 lows) on a closing basis. If the index breaks and sustains well below the said zone, a fall towards 24,050–24,000 — the next crucial support area — cannot be ruled out. However, 24,600 (Monday’s low and Wednesday’s high) is expected to act as the immediate key resistance, followed by 24,800, experts said.
Here are 15 data points we have collated to help you spot profitable trades:
1) Key Levels For The Nifty 50 (24,480)
Resistance based on pivot points: 24,576, 24,646, and 24,760
Support based on pivot points: 24,349, 24,279, and 24,166
Special Formation: The Nifty 50 formed a bullish candle with upper and lower shadows on the daily charts after a gap-down opening, reflecting recovery during the session, though bears maintained the upper hand amid volatility. The index sustained well below all key moving averages, while momentum indicators maintained strong sell signals, with the RSI falling to 30.37 (near the oversold zone). The MACD weakened further, forming another long bearish bar in the histogram. The Stochastic RSI also entered the oversold zone. All these indicators suggest persistent bearish momentum, although the market is approaching oversold territory, which may trigger a short-term pullback.
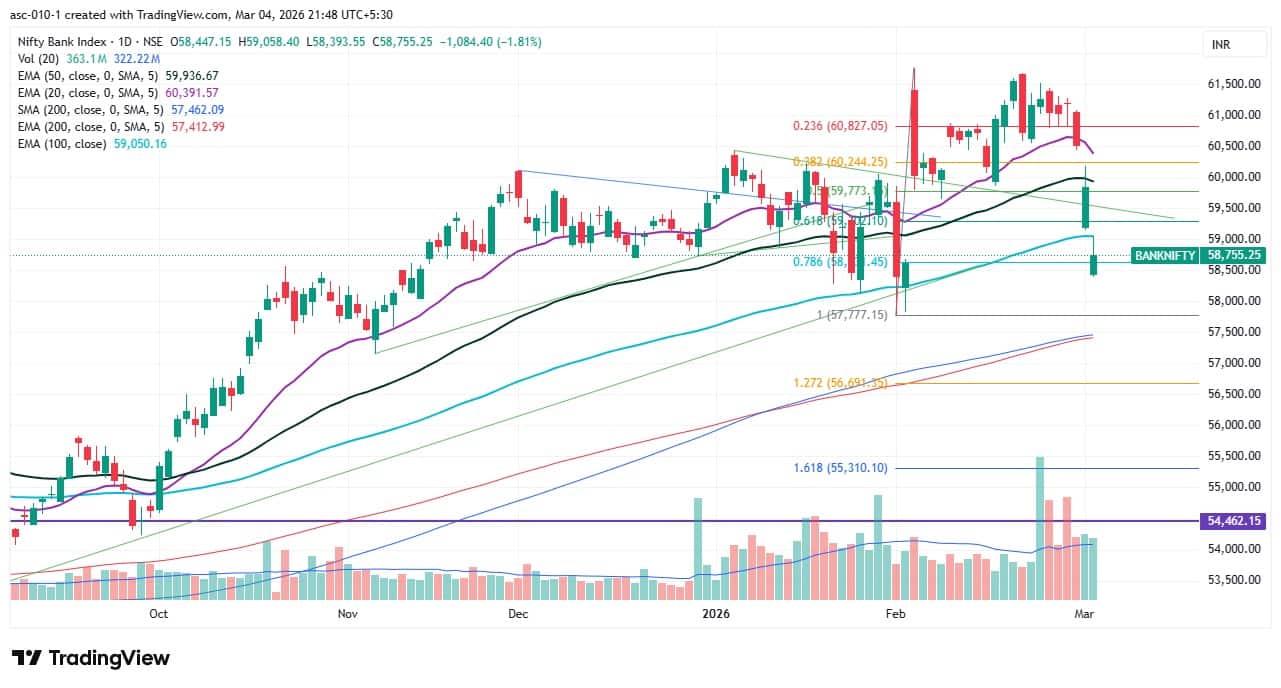
2) Key Levels For The Bank Nifty (58,755)
Resistance based on pivot points: 58,990, 59,147, and 59,401
Support based on pivot points: 58,482, 58,325, and 58,071
Resistance based on Fibonacci retracement: 59,206, 59,700
Support based on Fibonacci retracement: 58,631, 57,783
Special Formation: The Bank Nifty also formed a green candle with an upper shadow on the daily charts after a gap-down opening, indicating a bearish bias despite buying support at lower levels. The index slipped below its 100-day EMA but managed to close above the 78.6 percent Fibonacci retracement of the February low-to-high move. The RSI declined to 36.09, and the Stochastic RSI dropped into the oversold zone. The MACD is trending lower towards the zero line, accompanied by a long red histogram bar. All these indicators point to continued weakness in the near term, though the oversold readings suggest the possibility of intermittent relief rallies.
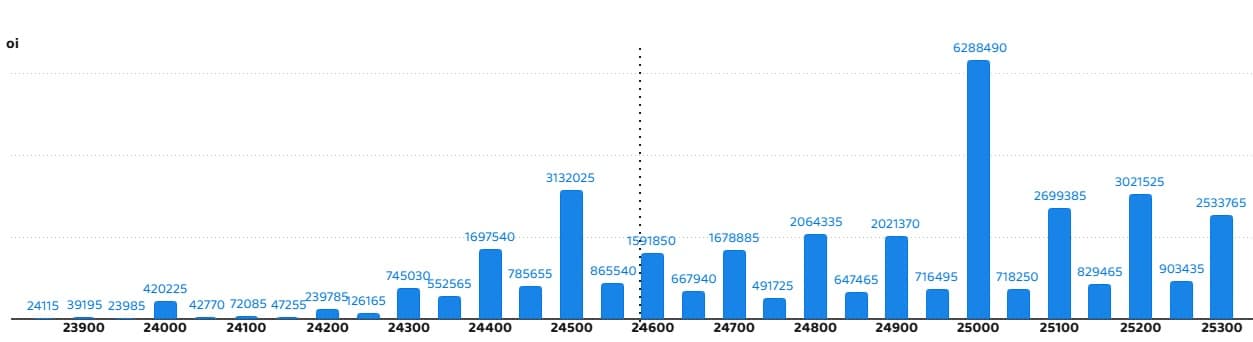
According to the weekly options data, the 25,000 strike holds the maximum Call open interest (with 62.88 lakh contracts). This level can act as a key resistance level for the Nifty in the short term. It was followed by the 24,500 strike (31.32 lakh contracts) and 25,200 strike (30.21 lakh contracts).
Maximum Call writing was observed at the 25,000 strike, which saw an addition of 25.75 lakh contracts, followed by the 24,500 and 24,400 strikes, which added 24.95 lakh and 16.41 lakh contracts, respectively. There was hardly any Call unwinding seen in the 23,900-25,300 strike band.
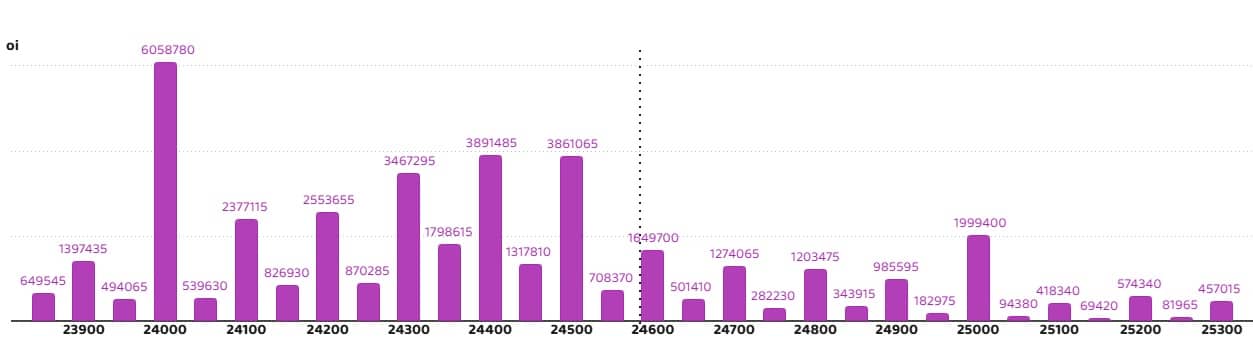
On the Put side, the maximum Put open interest was observed at the 24,000 strike (with 60.58 lakh contracts), which can act as a key support level for the Nifty in the short term. It was followed by the 24,400 strike (38.91 lakh contracts) and the 24,500 strike (38.61 lakh contracts).
The maximum Put writing was placed at the 24,400 strike, which saw an addition of 23.62 lakh contracts, followed by the 24,000 and 24,300 strikes, which added 18.4 lakh and 16.17 lakh contracts, respectively. The maximum Put unwinding was seen at the 24,800 strike, which shed 11.18 lakh contracts, followed by the 24,900 and 24,700 strikes, which shed 8.73 lakh and 8.32 lakh contracts, respectively.
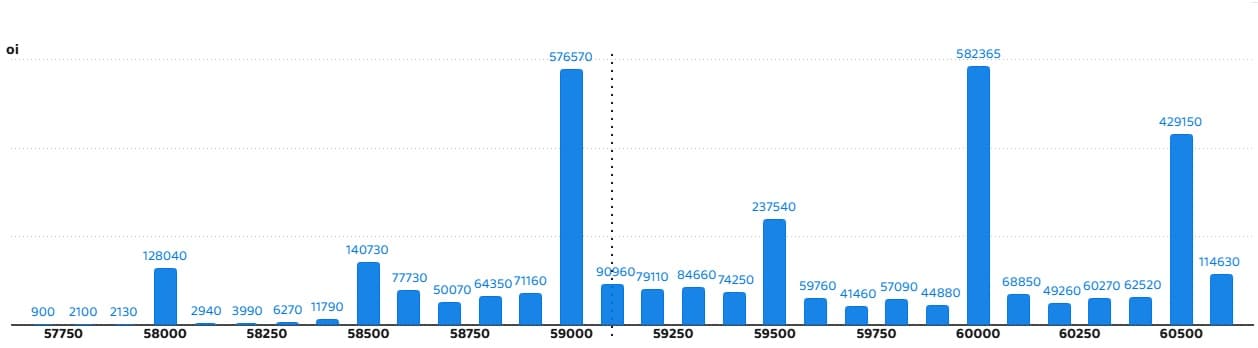
5) Bank Nifty Call Options Data
According to the monthly options data, the 60,000 strike holds the maximum Call open interest, with 5.82 lakh contracts. This can act as a key resistance level for the index in the short term. It was followed by the 59,000 strike (5.76 lakh contracts) and the 60,500 strike (4.29 lakh contracts).
Maximum Call writing was observed at the 59,000 strike (with the addition of 4.77 lakh contracts), followed by the 59,500 strike (1.53 lakh contracts) and 60,000 strike (1.2 lakh contracts). The maximum Call unwinding was seen at the 60,300 strike, which shed 48,420 contracts, followed by the 60,200 and 60,400 strikes, which shed 16,230 and 10,350 contracts, respectively.
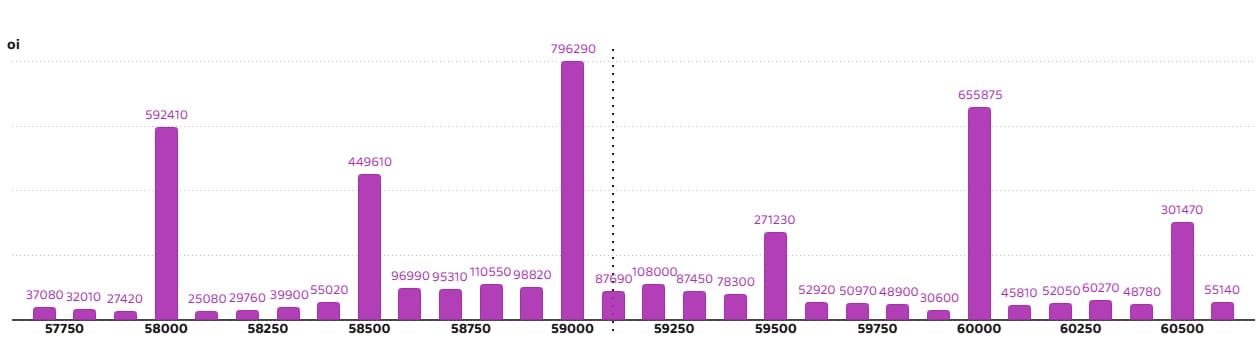
6) Bank Nifty Put Options Data
On the Put side, the maximum Put open interest was seen at the 59,000 strike (with 7.96 lakh contracts), which can act as a key level for the index. This was followed by the 60,000 strike (6.55 lakh contracts) and the 58,000 strike (5.92 lakh contracts).
The maximum Put writing was placed at the 59,000 strike (which added 2.72 lakh contracts), followed by the 58,800 (73,140 contracts) and 58,900 (71,220 contracts). The maximum Put unwinding was seen at the 60,000 strike, which shed 3.9 lakh contracts, followed by the 59,500 and 60,500 strikes, which shed 1.83 lakh and 63,690 contracts, respectively.
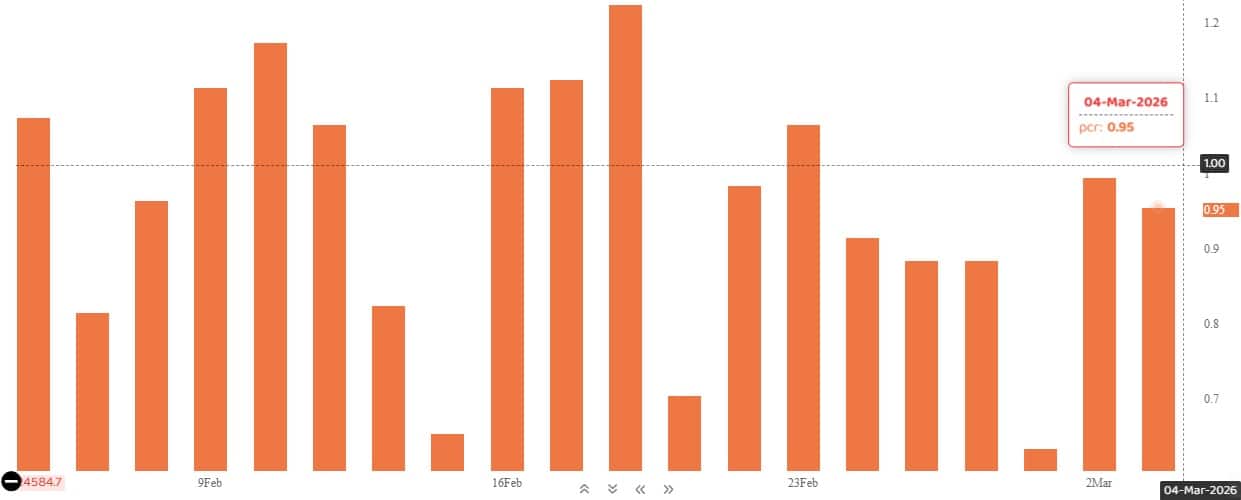
The Nifty Put-Call ratio (PCR), which indicates the mood of the market, declined to 0.95 on March 4, compared to a 0.99 in previous session.
The increasing PCR, or being higher than 0.7 or surpassing 1, means traders are selling more Put options than Call options, which generally indicates the firming up of a bullish sentiment in the market. If the ratio falls below 0.7 or moves towards 0.5, then it indicates selling in Calls is higher than selling in Puts, reflecting a bearish mood in the market.
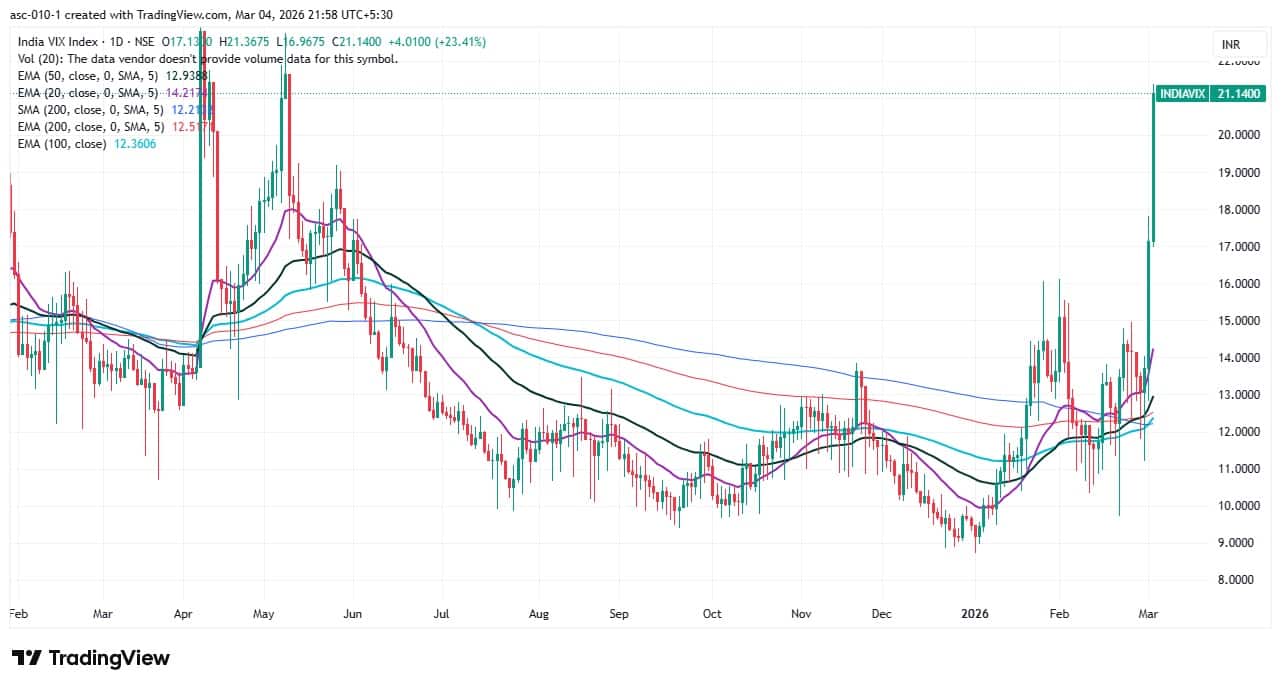
9) India VIX
India VIX, which measures expected market volatility, rallied sharply for the second consecutive session, rising 23.41 percent to 21.14 — the highest closing level since May 9, 2025. This signals rising risk and heightened nervousness among market participants, particularly bulls.
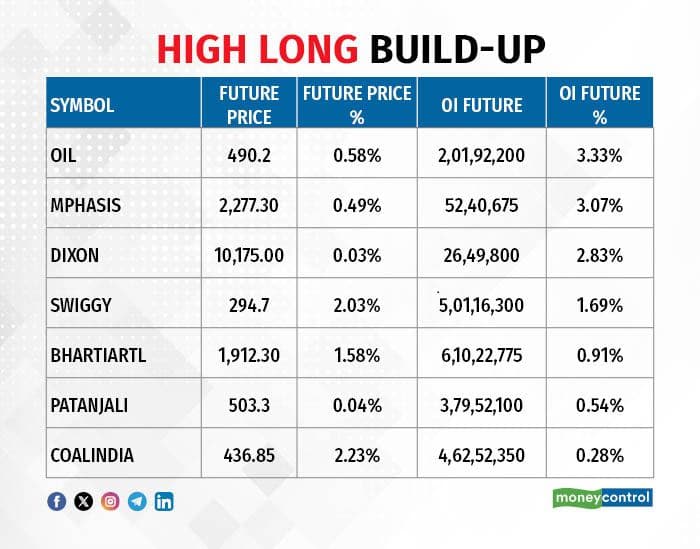
A long build-up was seen in 7 stocks. An increase in open interest (OI) and price indicates a build-up of long positions.
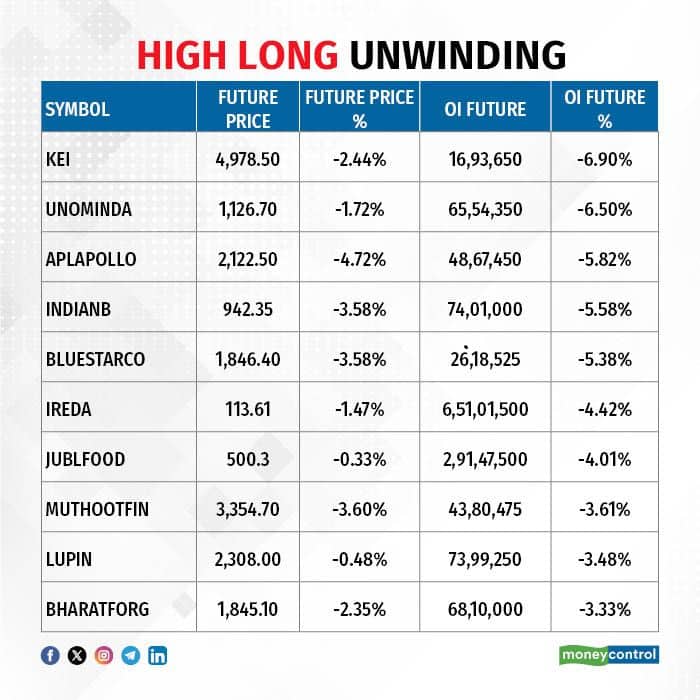
11) Long Unwinding (93 Stocks)
93 stocks saw a decline in open interest (OI) along with a fall in price, indicating long unwinding.
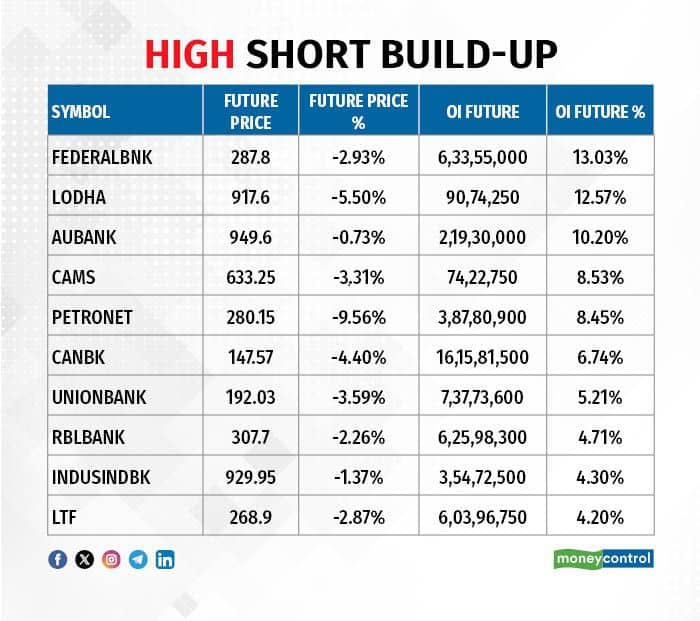
12) Short Build-up (103 Stocks)
103 stocks saw an increase in OI along with a fall in price, indicating a build-up of short positions.
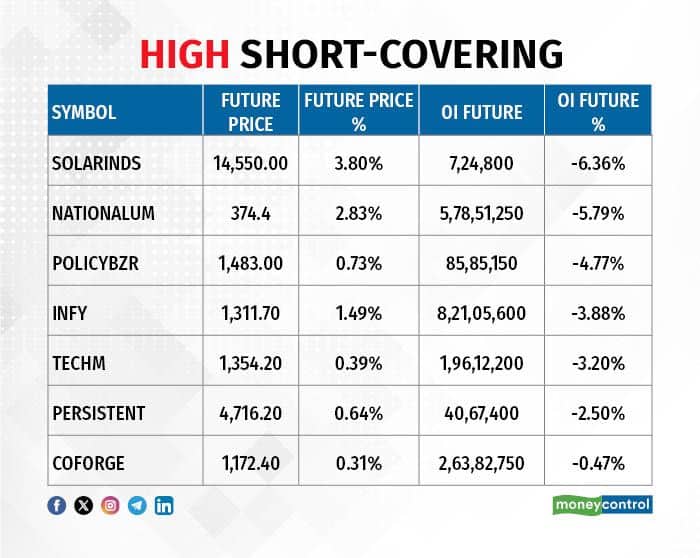
7 stocks saw short-covering, meaning a decrease in OI, along with a price increase.
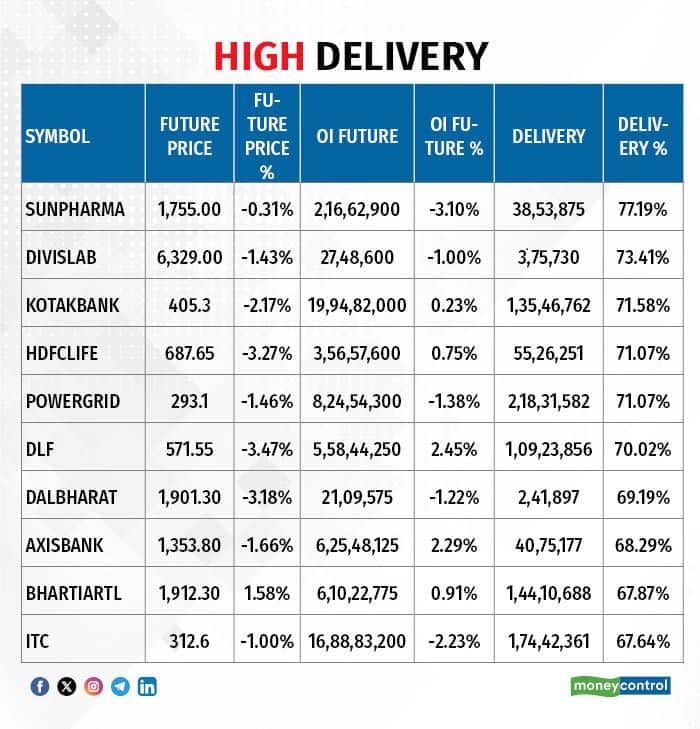
Here are the stocks that saw a high share of delivery trades. A high share of delivery reflects investing (as opposed to trading) interest in a stock.
Securities banned under the F&O segment include companies where derivative contracts cross 95 percent of the market-wide position limit.
Stocks added to F&O ban: SAIL
Stocks retained in F&O ban: Sammaan Capital
Stocks removed from F&O ban: Nil
Disclaimer: The views and investment tips expressed by experts on Moneycontrol are their own and not those of the website or its management. Moneycontrol advises users to check with certified experts before taking any investment decisions.Disclaimer: Moneycontrol is a part of the Network18 group. Network18 is controlled by Independent Media Trust, of which Reliance Industries is the sole beneficiary.Discover the latest Business News, Sensex, and Nifty updates. Obtain Personal Finance insights, tax queries, and expert opinions on Moneycontrol or download the Moneycontrol App to stay updated!
Find the best of Al News in one place, specially curated for you every weekend.
Stay on top of the latest tech trends and biggest startup news.


