


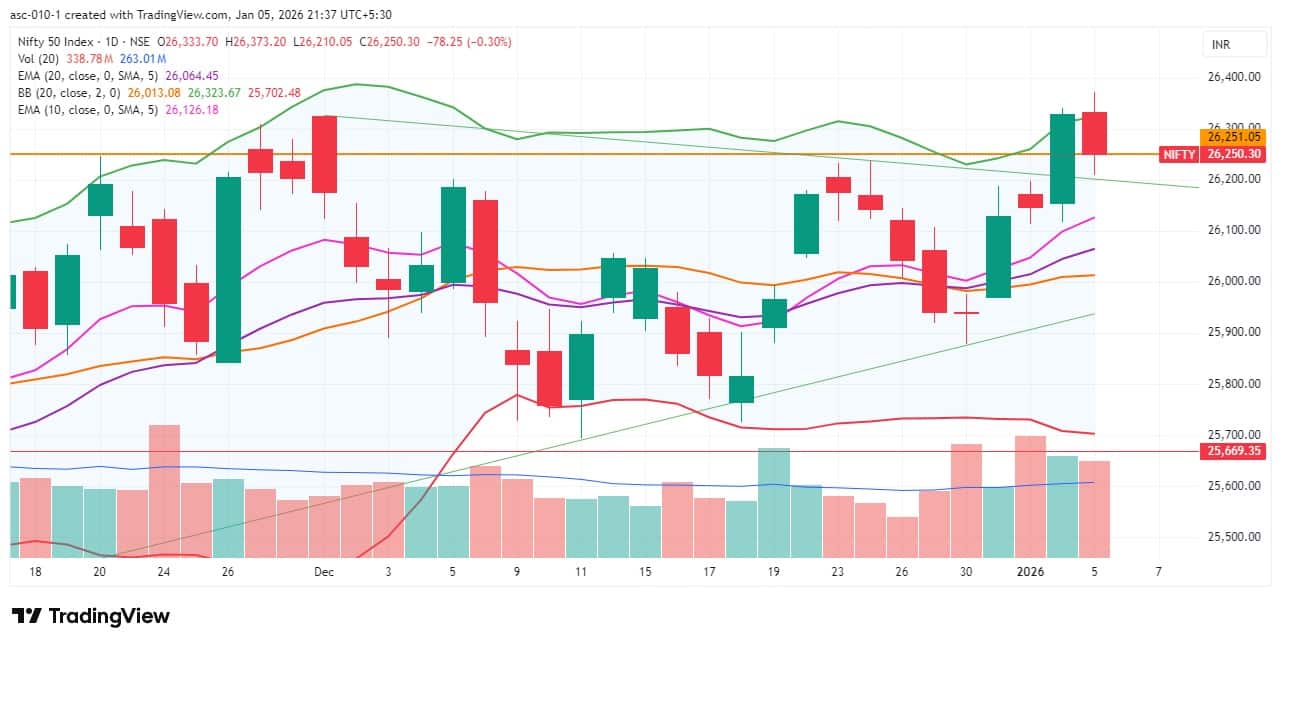
The Nifty 50 corrected about one-third of a percent on profit booking on January 5 following a sharp rally in the previous session. However, the higher high–higher low formation continued for the fourth consecutive day, and the index held above the trendline support at around 26,200, which had earlier acted as a resistance line before turning into support. Momentum indicators also remained positive. As long as the index holds above 26,200, the possibility of a rebound towards the 26,400–26,500 zone cannot be ruled out. However, a decisive break below this level could push the index into a consolidation phase, with 26,000 emerging as a crucial support, below which bears may become active, according to experts.
Here are 15 data points we have collated to help you spot profitable trades:
1) Key Levels For The Nifty 50 (26,250)
Resistance based on pivot points: 26,340, 26,379, and 26,441
Support based on pivot points: 26,216, 26,177, and 26,115
Special Formation: The Nifty 50 formed a bearish candle with minor upper and lower shadows on the daily timeframe, indicating selling pressure amid volatility. However, the higher top–higher bottom structure remained intact, and the index continued to sustain well above all key moving averages, with short-term moving averages trending upward. The MACD maintained a bullish crossover, with the histogram rising further. The RSI (58.79) and Stochastic RSI (86.96) edged lower but continued to stay above their respective signal lines, indicating that the overall momentum remains positive despite minor near-term weakness.
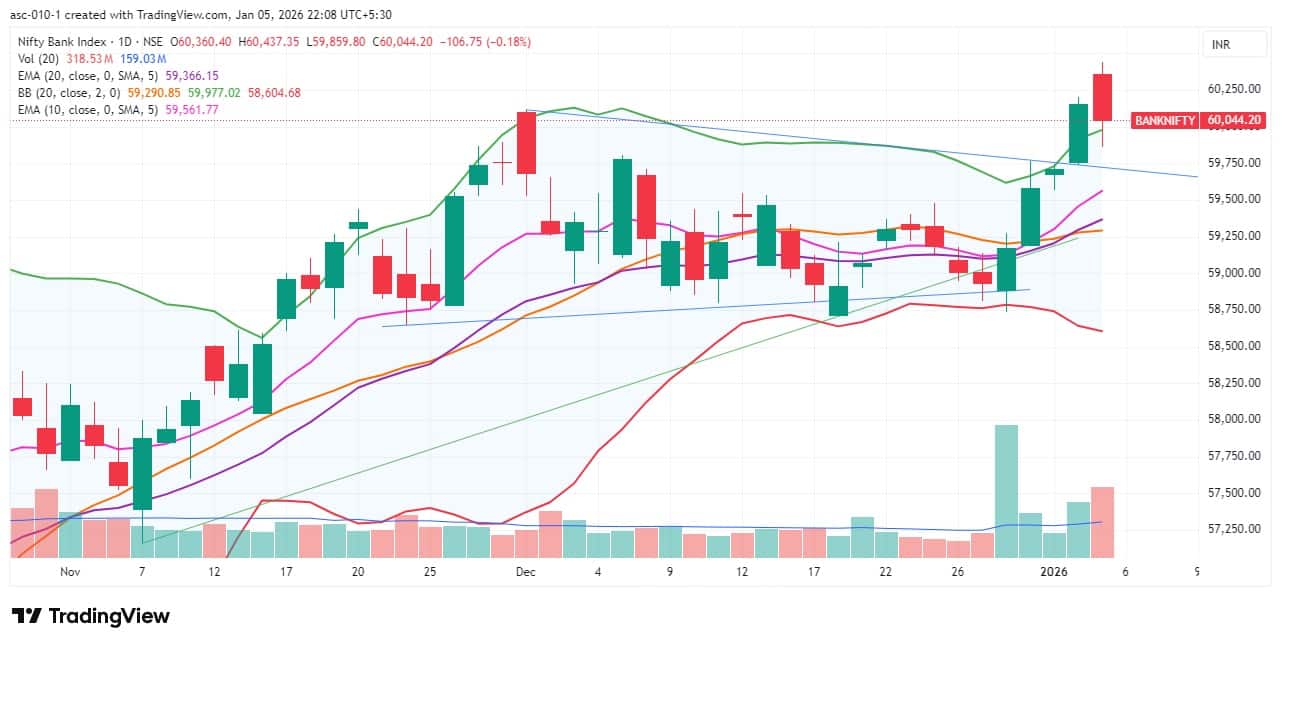
2) Key Levels For The Bank Nifty (60,044)
Resistance based on pivot points: 60,334, 60,471, and 60,691
Support based on pivot points: 59,893, 59,757, and 59,536
Resistance based on Fibonacci retracement: 60,496, 60,980
Support based on Fibonacci retracement: 59,776, 59,571
Special Formation: The Bank Nifty also traded lower on profit booking, slipping 0.2 percent, but bulls remained in a strong position as the index sustained above the upper Bollinger Band and the falling trendline, which has now turned into support after acting as resistance earlier. The MACD stayed bullish, with the histogram climbing further. The RSI remained well above the reference line, though it dipped marginally to 65.05. All these indicators suggest that the broader trend for Bank Nifty remains positive, with only limited near-term consolidation risk.
According to the weekly options data, the 26,300 strike holds the maximum Call open interest (with 1.79 crore contracts). This level can act as a key resistance level for the Nifty in the short term. It was followed by the 26,400 strike (1.59 crore contracts) and 26,500 strike (1.45 crore contracts).
Maximum Call writing was observed at the 26,300 strike, which saw an addition of 96.6 lakh contracts, followed by the 26,400 and 26,250 strikes, which added 85.42 lakh and 72.66 lakh contracts, respectively. The maximum Call unwinding was seen at the 27,000 strike, which shed 21.5 lakh contracts, followed by the 26,100 and 26,000 strikes, which shed 6.01 lakh and 4.65 lakh contracts, respectively.
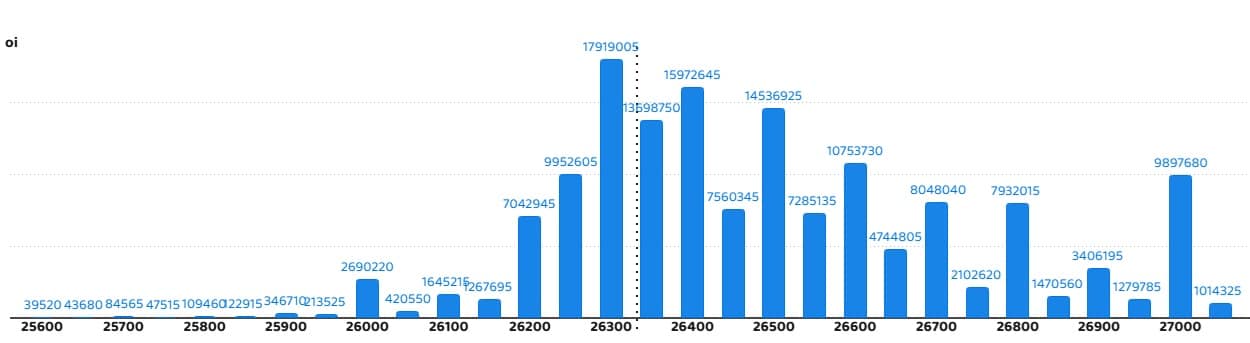
On the Put side, the maximum Put open interest was seen at the 26,000 strike (with 1.71 crore contracts), which can act as a key support level for the Nifty in the short term. It was followed by the 26,200 strike (1.35 crore contracts) and the 26,100 strike (1.19 crore contracts).
The maximum Put writing was placed at the 25,700 strike, which saw an addition of 7.57 lakh contracts, followed by the 25,800 and 26,750 strikes, which added 1.12 lakh and 17,225 contracts, respectively. The maximum Put unwinding was seen at the 26,300 strike, which shed 65.44 lakh contracts, followed by the 26,250 and 26,350 strikes, which shed 35.42 lakh and 28.07 lakh contracts, respectively.
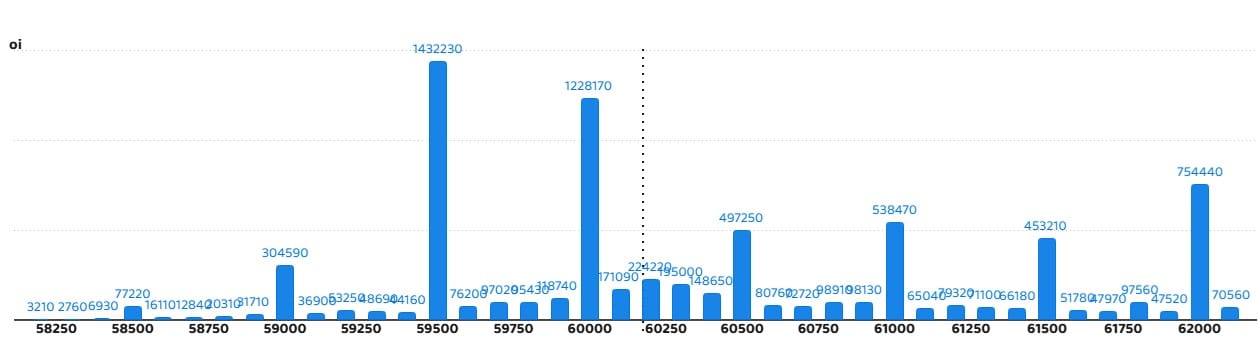
5) Bank Nifty Call Options Data
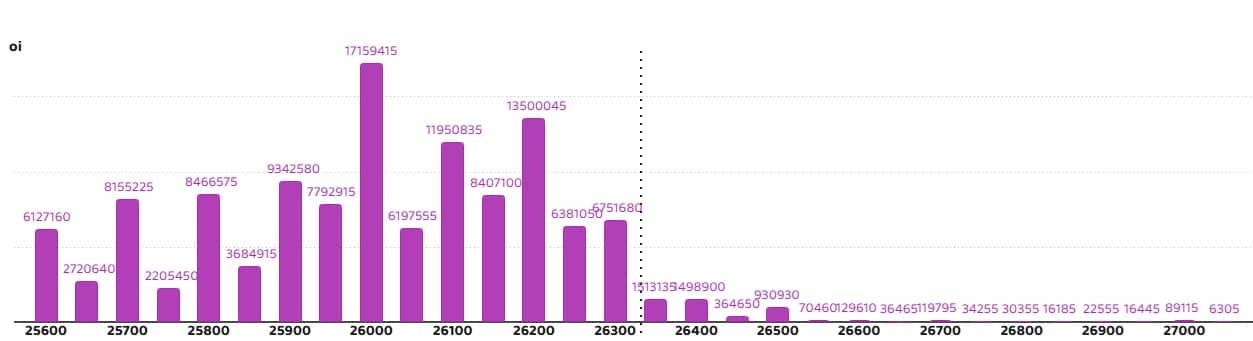
According to the monthly options data, the 59,500 strike holds the maximum Call open interest, with 14.32 lakh contracts. This can act as a key level for the index in the short term. It was followed by the 60,000 strike (12.28 lakh contracts) and the 62,000 strike (7.54 lakh contracts).
Maximum Call writing was observed at the 60,500 strike (with the addition of 1.11 lakh contracts), followed by the 62,000 strike (97,620 contracts) and 60,200 strike (64,350 contracts). The maximum Call unwinding was seen at the 59,000 strike, which shed 39,480 contracts, followed by the 61,000 and 59,100 strikes which shed 36,420 and 34,830 contracts, respectively.
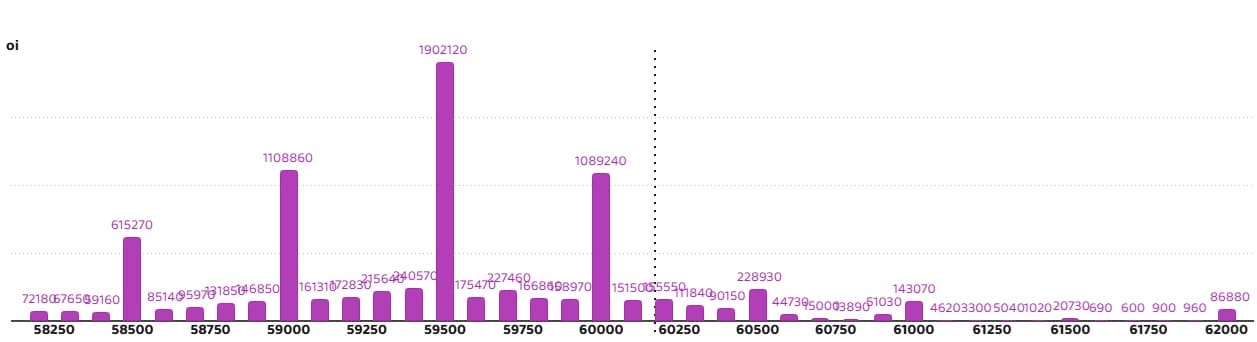
6) Bank Nifty Put Options Data
On the Put side, the maximum Put open interest was seen at the 59,500 strike (with 19.02 lakh contracts), which can act as a key support level for the index. This was followed by the 59,000 strike (11.08 lakh contracts) and the 60,000 strike (10.89 lakh contracts).
The maximum Put writing was placed at the 60,200 strike (which added 46,980 contracts), followed by the 60,900 strike (43,710 contracts) and the 60,500 strike (43,530 contracts). The maximum Put unwinding was seen at the 60,000 strike, which shed 78,150 contracts, followed by the 59,700 and 59,900 strikes, which shed 39,120 and 25,260 contracts, respectively.
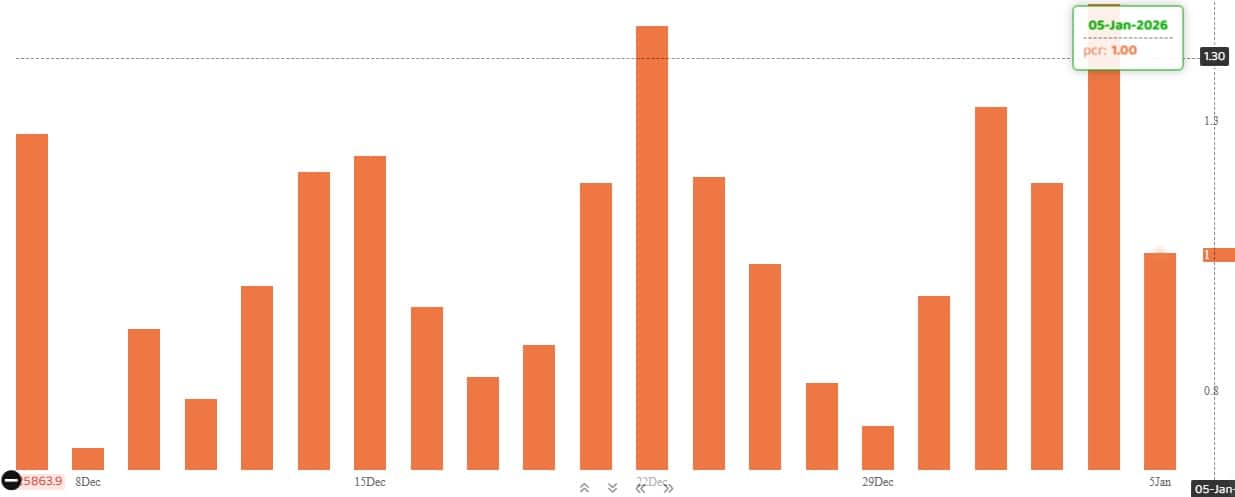
The Nifty Put-Call ratio (PCR), which indicates the mood of the market, dropped sharply to 1.00 on January 5, compared to 1.46 in the previous session.
The increasing PCR, or being higher than 0.7 or surpassing 1, means traders are selling more Put options than Call options, which generally indicates the firming up of a bullish sentiment in the market. If the ratio falls below 0.7 or moves towards 0.5, then it indicates selling in Calls is higher than selling in Puts, reflecting a bearish mood in the market.
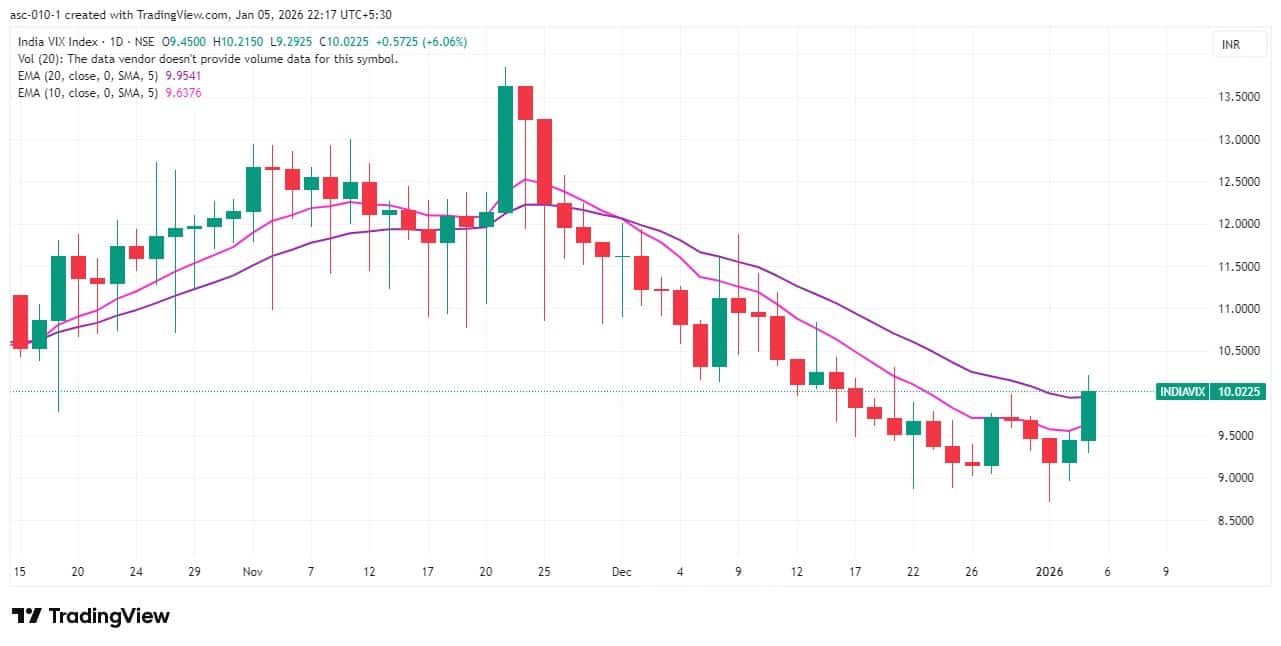
9) India VIX
The fear gauge, India VIX, surged 6.06 percent to 10.02, extending its upward move for the second consecutive session and climbing above its short-term moving averages, signalling some caution for bulls. However, experts noted that as long as the VIX sustains below the 12 zone, bulls are not exposed to any major risk.
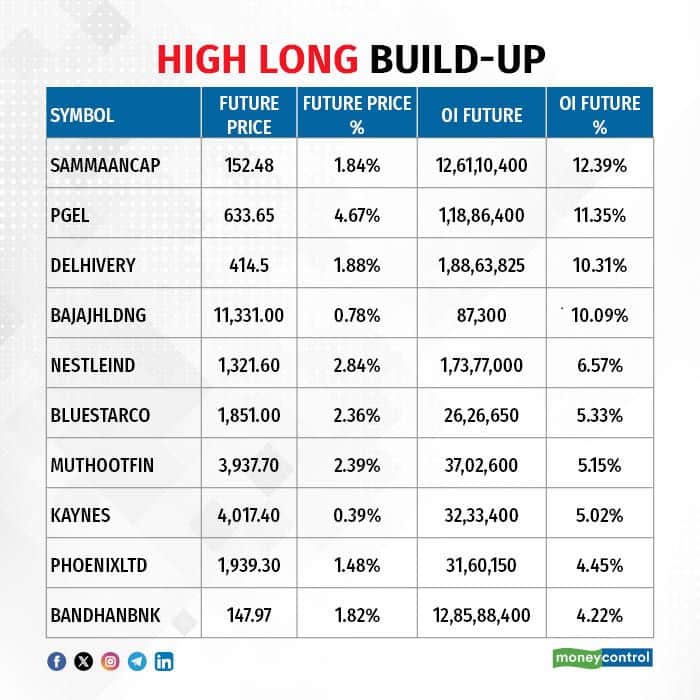
A long build-up was seen in 52 stocks. An increase in open interest (OI) and price indicates a build-up of long positions.
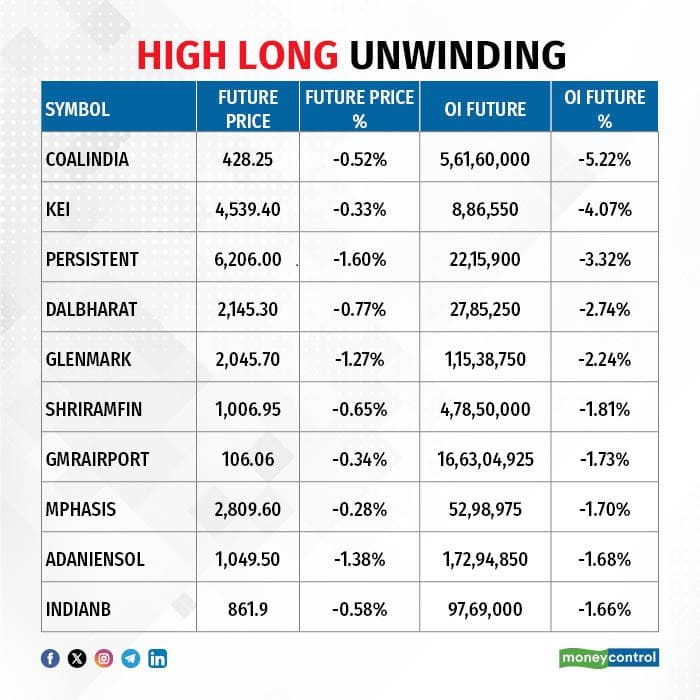
11) Long Unwinding (55 Stocks)
55 stocks saw a decline in open interest (OI) along with a fall in price, indicating long unwinding.
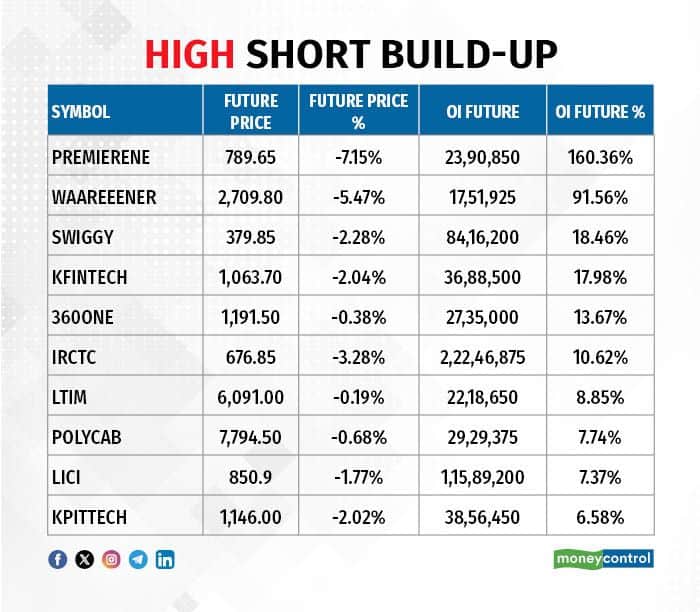
12) Short Build-up (63 Stocks)
63 stocks saw an increase in OI along with a fall in price, indicating a build-up of short positions.
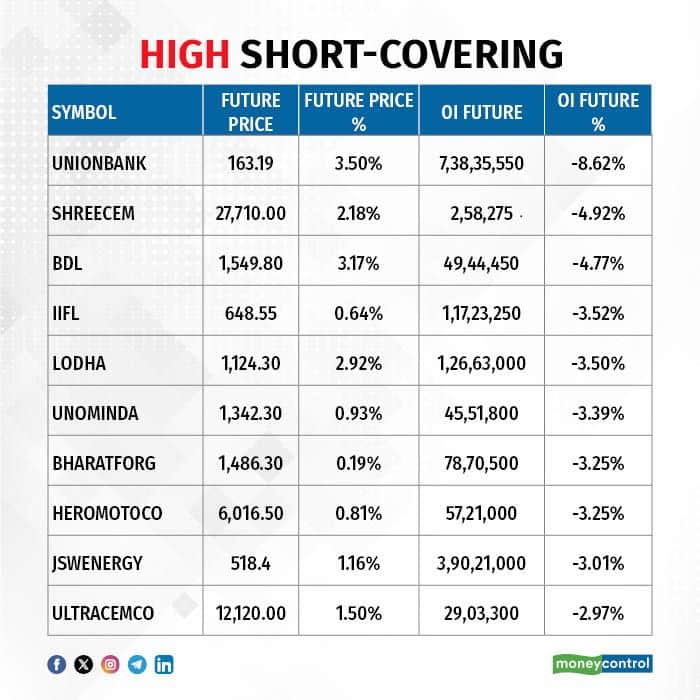
13) Short-Covering (42 Stocks)
42 stocks saw short-covering, meaning a decrease in OI, along with a price increase.
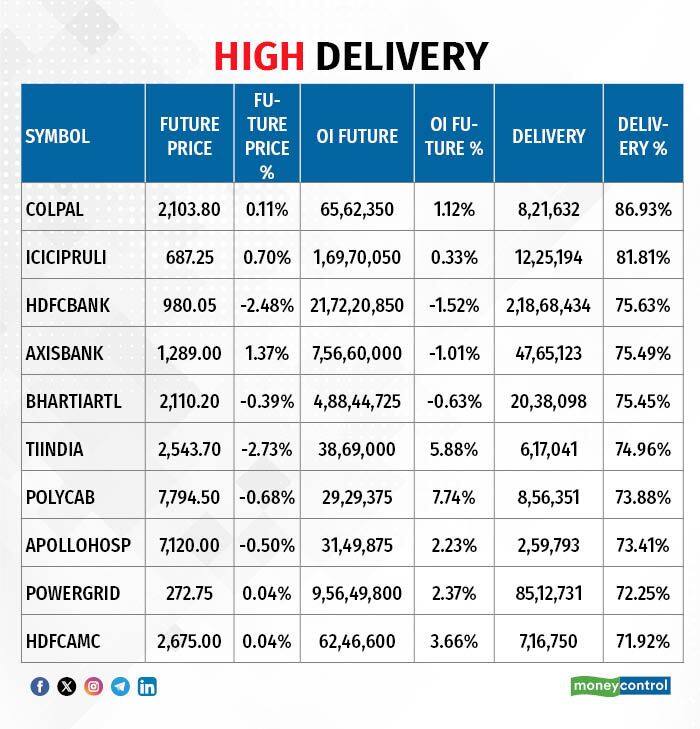
Here are the stocks that saw a high share of delivery trades. A high share of delivery reflects investing (as opposed to trading) interest in a stock.
Securities banned under the F&O segment include companies where derivative contracts cross 95 percent of the market-wide position limit.
Stocks added to F&O ban: Sammaan Capital
Stocks retained in F&O ban: SAIL
Stocks removed from F&O ban: Nil
Disclaimer: The views and investment tips expressed by experts on Moneycontrol are their own and not those of the website or its management. Moneycontrol advises users to check with certified experts before taking any investment decisions.Disclaimer: Moneycontrol is a part of the Network18 group. Network18 is controlled by Independent Media Trust, of which Reliance Industries is the sole beneficiary.Discover the latest Business News, Sensex, and Nifty updates. Obtain Personal Finance insights, tax queries, and expert opinions on Moneycontrol or download the Moneycontrol App to stay updated!
Find the best of Al News in one place, specially curated for you every weekend.
Stay on top of the latest tech trends and biggest startup news.


