


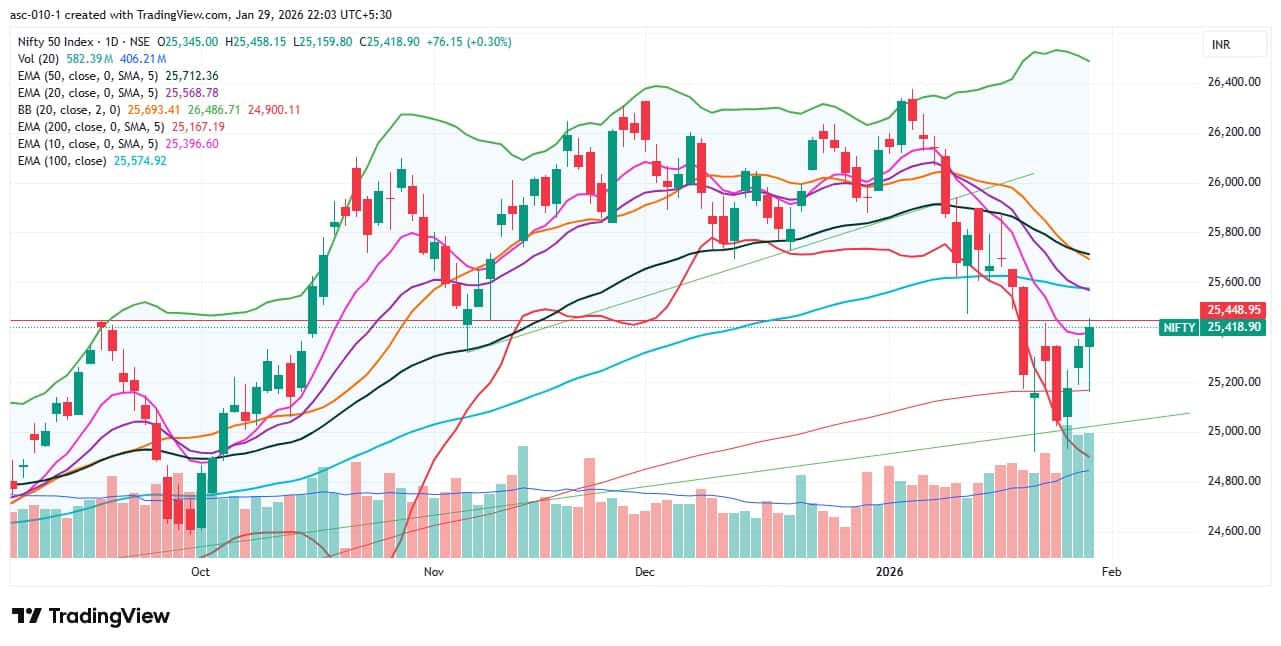
Equity benchmarks recorded gains of 0.3 percent, with the Nifty 50 extending its uptrend and holding the 200-day EMA (25,160) along with robust volumes for the third straight session on January 29, accompanied by strengthening momentum, as the market approaches the Union Budget scheduled on February 1. According to experts, volatility is expected to remain elevated, though it has cooled off slightly over the last two days. If the Nifty 50 sustains above the 10-day EMA (25,400), the upward journey toward the 25,500–25,600 zone can be seen in the upcoming sessions; however, a fall below this level can drive the index toward 25,250, followed by 25,160 as the key support.
Here are 15 data points we have collated to help you spot profitable trades:
1) Key Levels For The Nifty 50 (25,419)
Resistance based on pivot points: 25,460, 25,530, and 25,644
Support based on pivot points: 25,232, 25,161, and 25,047
Special Formation: The Nifty 50 formed a bullish candle with a minor upper shadow and a long lower shadow on the daily charts, indicating buying interest at lower levels. The index continued its higher-high formation for another session, climbing above the 10-day EMA, though it remained below the 20-, 50-, and 100-day EMAs. The RSI rose further to 43.07 with a bullish crossover, and the Stochastic RSI sustained a positive crossover. The MACD maintained its upward move but remained below the zero and signal lines, with weakness fading in the histogram. All these indicators suggest gradual improvement in momentum and a constructive short-term setup.
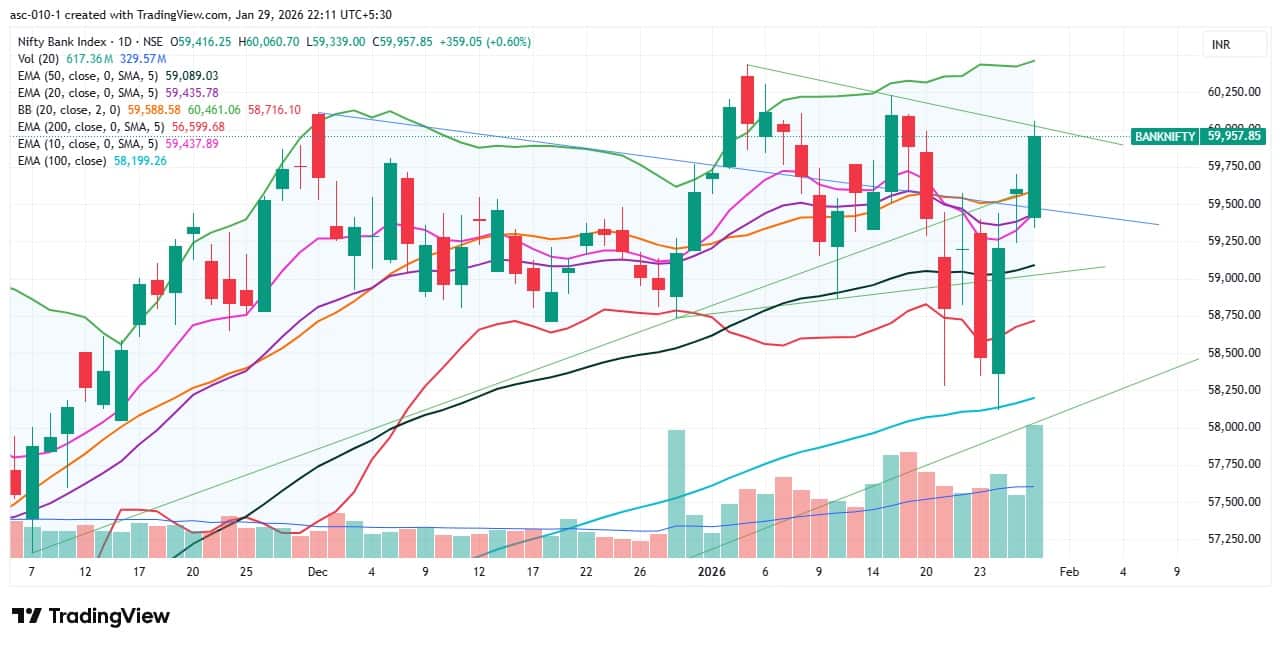
2) Key Levels For The Bank Nifty (59,958)
Resistance based on pivot points: 60,062, 60,232, and 60,508
Support based on pivot points: 59,510, 59,340, and 59,064
Resistance based on Fibonacci retracement: 60,437, 61,070
Support based on Fibonacci retracement: 58,820, 57,815
Special Formation: The Bank Nifty formed a long bullish candle on the daily timeframe, with a continuation of the higher high–higher low structure, signalling a healthy uptrend. The index sustained above all key moving averages with strong volumes, while short-term moving averages trended upward, and it also hit the falling resistance trendline. Momentum indicators remained supportive, with the RSI rising to 56.34 and the Stochastic RSI to 56.82, both sustaining bullish crossovers. Meanwhile, the MACD is on the verge of a positive crossover, with weakness in the histogram almost fading. All these indicators point toward strengthening bullish momentum in the banking index.
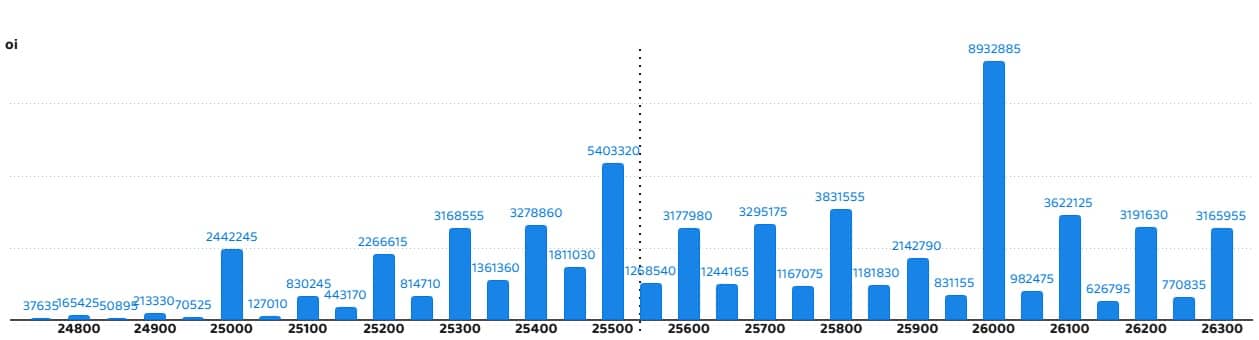
According to the weekly options data, the 26,000 strike holds the maximum Call open interest (with 89.32 lakh contracts). This level can act as a key resistance level for the Nifty in the short term. It was followed by the 25,500 strike (54.03 lakh contracts) and 25,800 strike (38.31 lakh contracts).
Maximum Call writing was observed at the 26,000 strike, which saw an addition of 11.79 lakh contracts, followed by the 26,200 and 25,450 strikes, which added 10.46 lakh and 7.23 lakh contracts, respectively. The maximum Call unwinding was seen at the 25,300 strike, which shed 9.88 lakh contracts, followed by the 25,350 and 25,650 strikes, which shed 7.35 lakh and 4.11 lakh contracts, respectively.
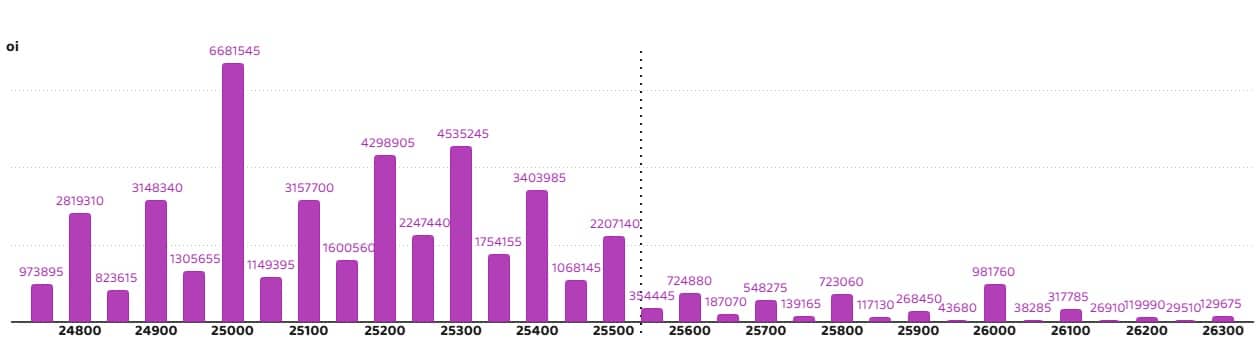
On the Put side, the maximum Put open interest was seen at the 25,000 strike (with 66.81 lakh contracts), which can act as a key support level for the Nifty in the short term. It was followed by the 25,300 strike (45.35 lakh contracts) and the 25,200 strike (42.98 lakh contracts).
The maximum Put writing was placed at the 24,900 strike, which saw an addition of 14.85 lakh contracts, followed by the 25,400 and 25,200 strikes, which added 13.78 lakh and 12.67 lakh contracts, respectively. The maximum Put unwinding was seen at the 25,800 strike, which shed 47,645 contracts, followed by the 26,100 and 26,300 strikes, which shed 12,025 and 6,240 contracts, respectively.
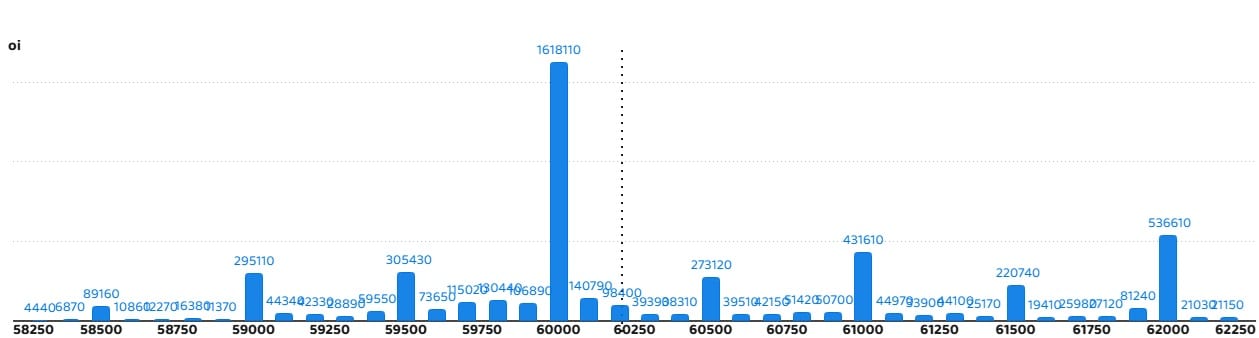
5) Bank Nifty Call Options Data
According to the monthly options data, the 60,000 strike holds the maximum Call open interest, with 16.18 lakh contracts. This can act as a key resistance level for the index in the short term. It was followed by the 62,000 strike (5.36 lakh contracts) and the 61,000 strike (4.31 lakh contracts).
Maximum Call writing was observed at the 62,000 strike (with the addition of 77,190 contracts), followed by the 60,100 strike (55,470 contracts) and 61,900 strike (31,380 contracts). The maximum Call unwinding was seen at the 59,600 strike, which shed 51,390 contracts, followed by the 60,000 and 59,500 strikes which shed 34,050 and 19,200 contracts, respectively.
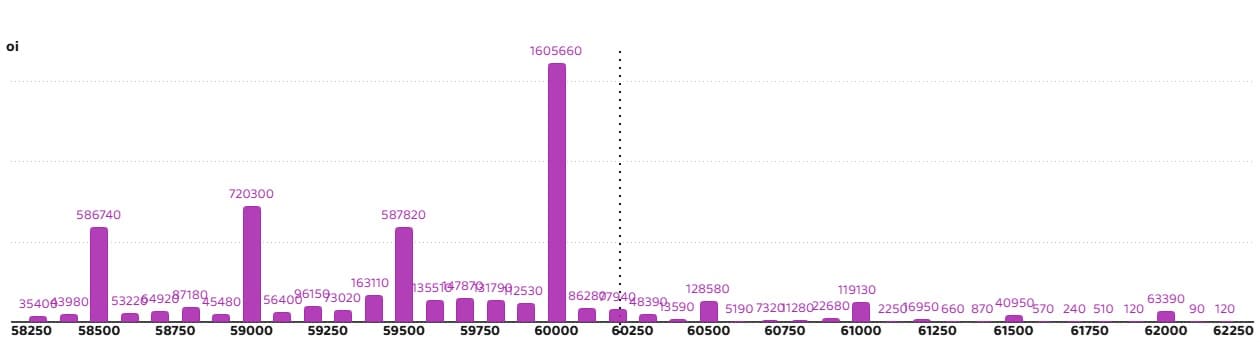
6) Bank Nifty Put Options Data
On the Put side, the maximum Put open interest was seen at the 60,000 strike (with 16.05 lakh contracts), which can act as a key level for the index. This was followed by the 59,000 strike (7.2 lakh contracts) and the 59,500 strike (5.87 lakh contracts).
The maximum Put writing was placed at the 59,500 strike (which added 1.96 lakh contracts), followed by the 60,000 strike (1.66 lakh contracts) and the 59,000 strike (1.21 lakh contracts). The maximum Put unwinding was seen at the 61,200 strike, which shed 11,340 contracts, followed by the 58,600 and 60,900 strikes, which shed 5,040 and 2,340 contracts, respectively.
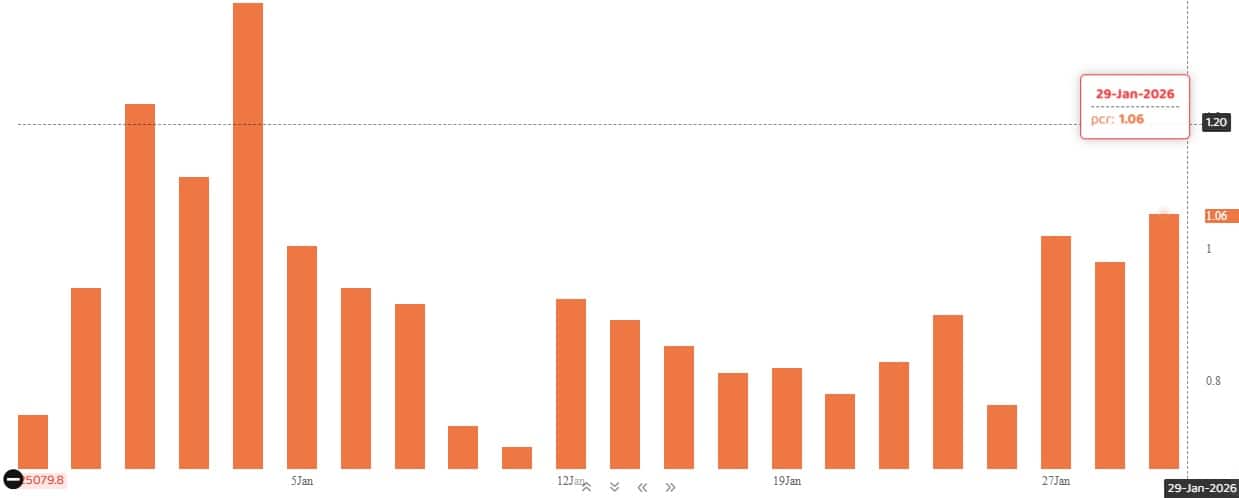
The Nifty Put-Call ratio (PCR), which indicates the mood of the market, rose to 1.06 on January 29, compared to 0.97 in the previous session.
The increasing PCR, or being higher than 0.7 or surpassing 1, means traders are selling more Put options than Call options, which generally indicates the firming up of a bullish sentiment in the market. If the ratio falls below 0.7 or moves towards 0.5, then it indicates selling in Calls is higher than selling in Puts, reflecting a bearish mood in the market.
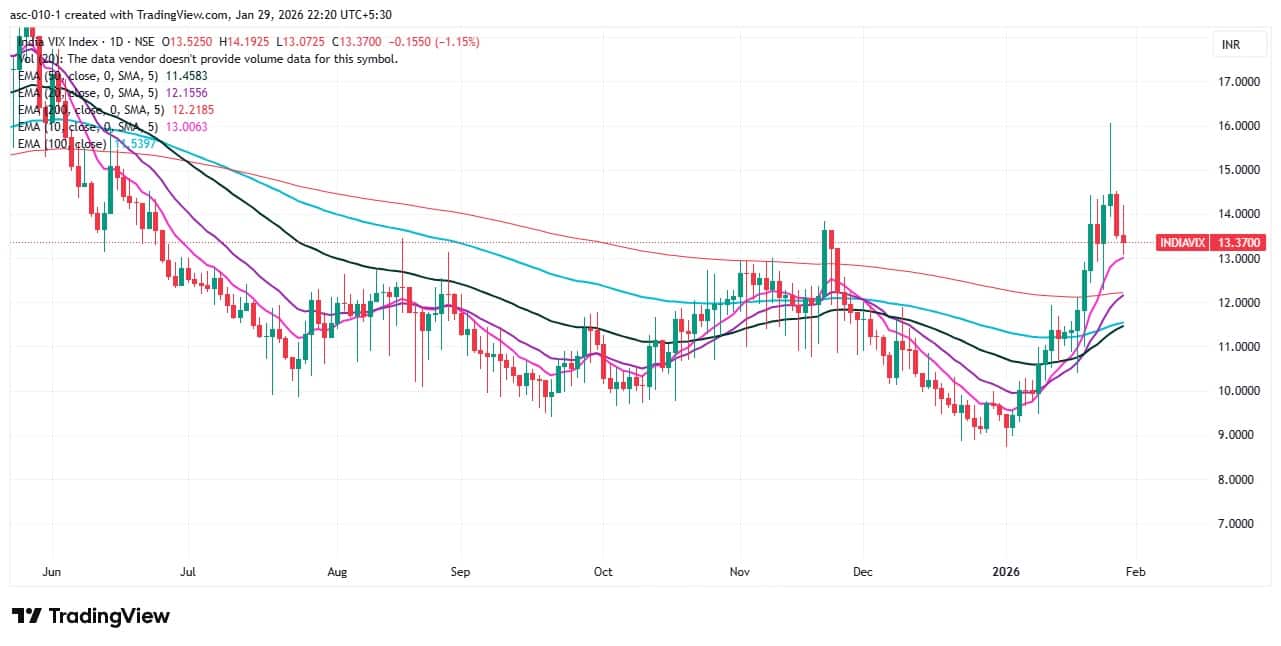
9) India VIX
The India VIX, also known as the fear gauge, extended its downtrend for another session, falling 1.15 percent to 13.37. This provides some comfort for bulls; however, it still remains above all key moving averages and at elevated levels, thereby signalling continued caution for market participants.
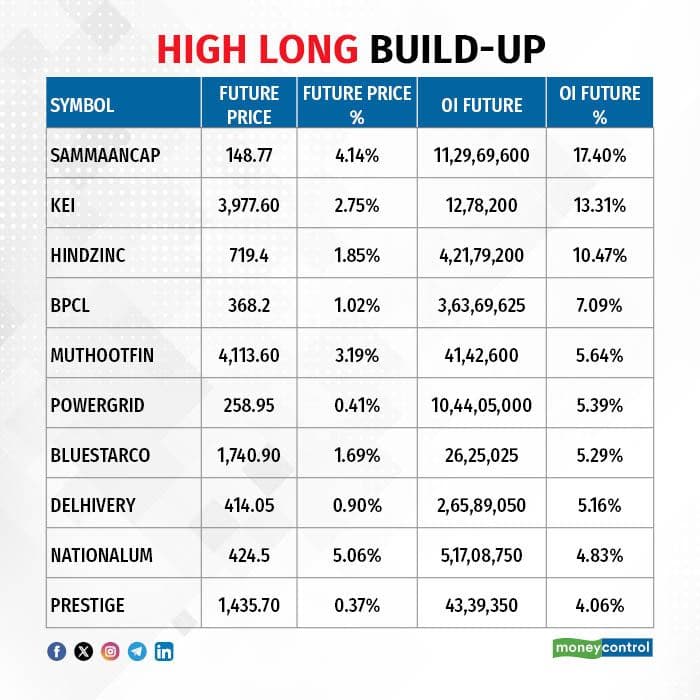
A long build-up was seen in 46 stocks. An increase in open interest (OI) and price indicates a build-up of long positions.
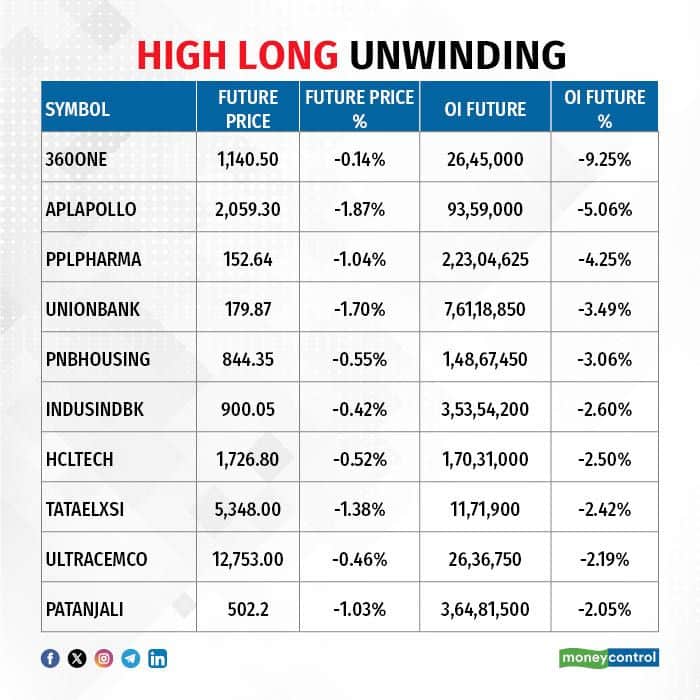
11) Long Unwinding (47 Stocks)
47 stocks saw a decline in open interest (OI) along with a fall in price, indicating long unwinding.
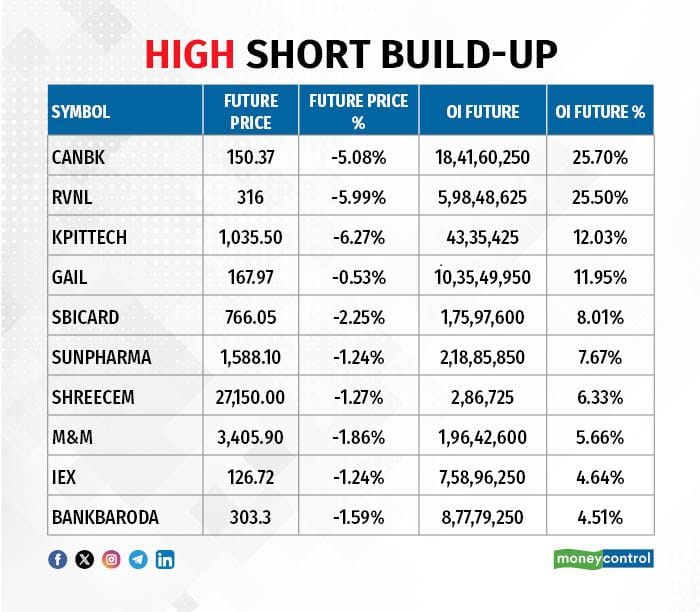
12) Short Build-up (64 Stocks)
64 stocks saw an increase in OI along with a fall in price, indicating a build-up of short positions.
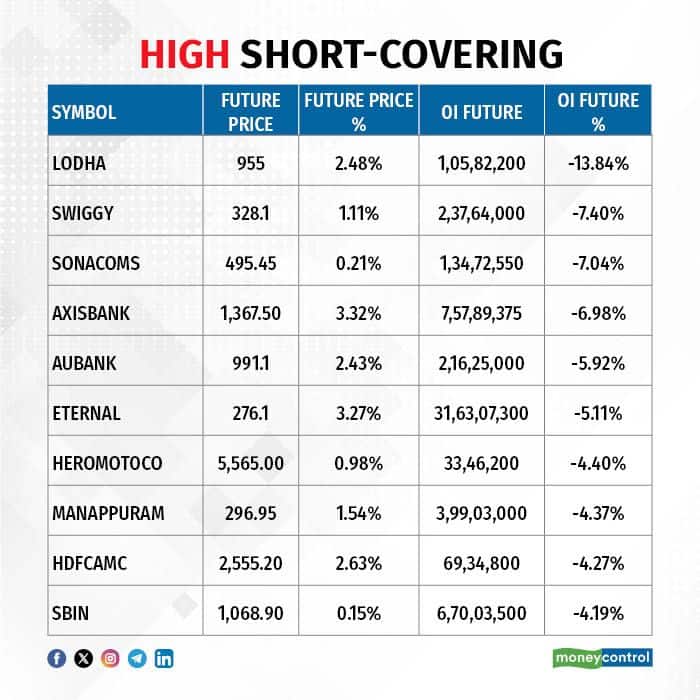
13) Short-Covering (54 Stocks)
54 stocks saw short-covering, meaning a decrease in OI, along with a price increase.
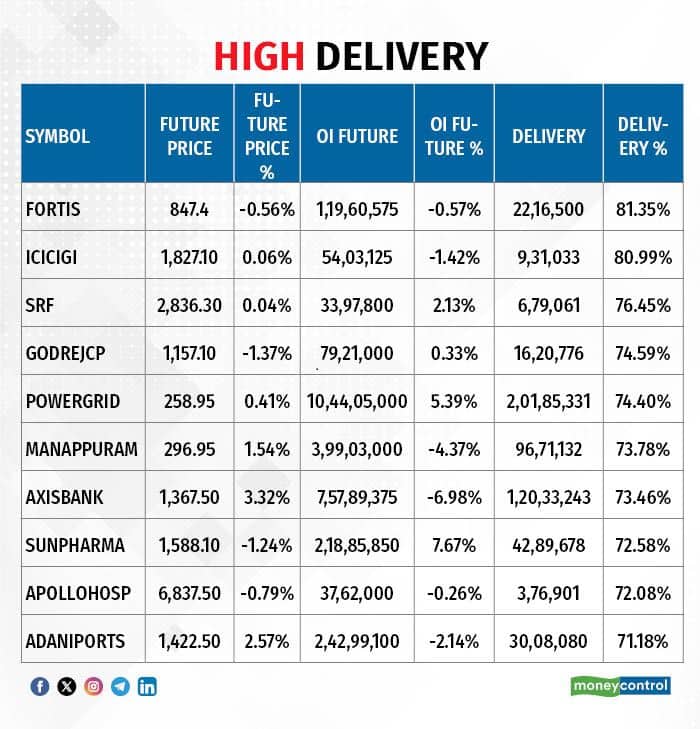
Here are the stocks that saw a high share of delivery trades. A high share of delivery reflects investing (as opposed to trading) interest in a stock.
Securities banned under the F&O segment include companies where derivative contracts cross 95 percent of the market-wide position limit.
Stocks added to F&O ban: Nil
Stocks retained in F&O ban: Nil
Stocks removed from F&O ban: Nil
Disclaimer: The views and investment tips expressed by experts on Moneycontrol are their own and not those of the website or its management. Moneycontrol advises users to check with certified experts before taking any investment decisions.Disclaimer: Moneycontrol is a part of the Network18 group. Network18 is controlled by Independent Media Trust, of which Reliance Industries is the sole beneficiary.Discover the latest Business News, Sensex, and Nifty updates. Obtain Personal Finance insights, tax queries, and expert opinions on Moneycontrol or download the Moneycontrol App to stay updated!
Find the best of Al News in one place, specially curated for you every weekend.
Stay on top of the latest tech trends and biggest startup news.


