


The Nifty 50 snapped its three-day losing streak, bouncing back above the 200-day EMA and rising over half a percent on January 22. This relief rally was on expected lines but, according to experts, needs a strong and sustainable close above 25,850 for continuation of the said uptrend. Until then, consolidation and volatility may be seen in the short term, given the bearish sentiment and elevated VIX. Immediate support is placed at 25,160, followed by 24,900 as a crucial support level; however, immediate resistance is seen at the 25,500–25,600 levels.
Here are 15 data points we have collated to help you spot profitable trades:
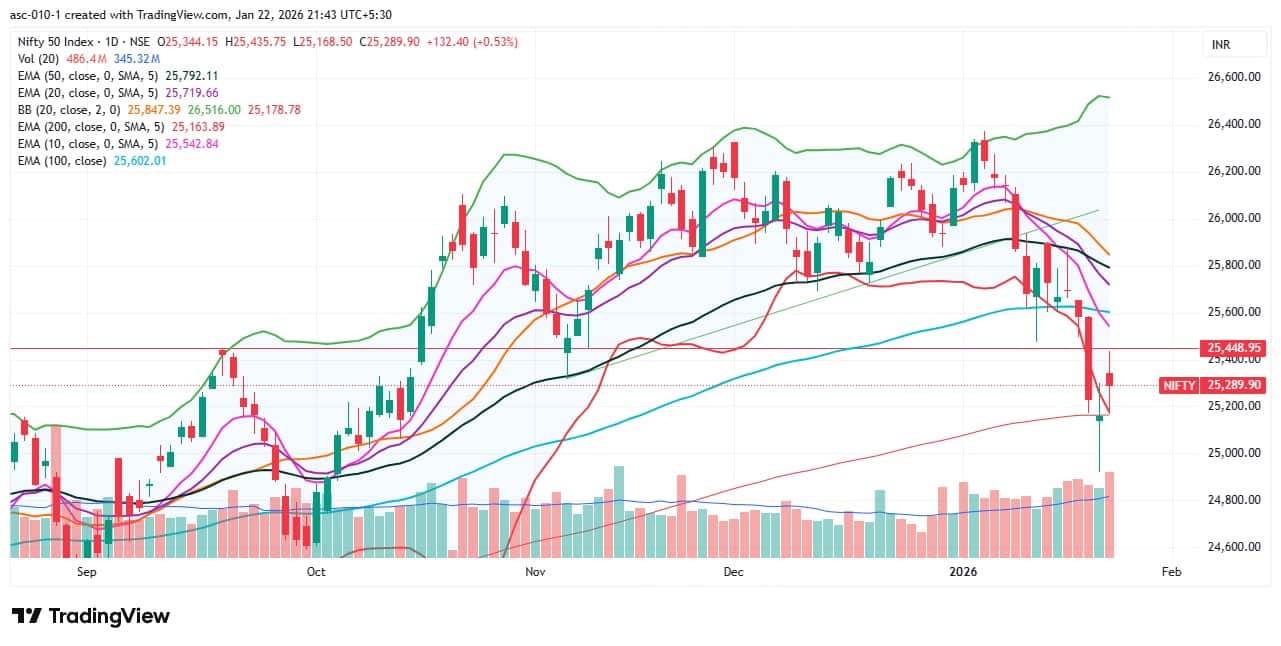
1) Key Levels For The Nifty 50 (25,290)
Resistance based on pivot points: 25,400, 25,463, and 25,565
Support based on pivot points: 25,196, 25,133, and 25,031
Special Formation: The Nifty 50 formed a small bearish candle with upper and lower shadows, resembling a high-wave kind of pattern on the daily charts, indicating volatility and indecision among market participants. The index negated the lower highs–lower lows formation of the previous three sessions but needs strength for continuation of a higher high–low structure. The index climbed back above the 200 DEMA but remained below all other key moving averages, while the RSI (33.82) and MACD maintained a bearish crossover with the histogram below the zero line. The Stochastic RSI turned bullish but remained in the oversold zone. All this indicates a cautious near-term outlook despite the relief bounce.
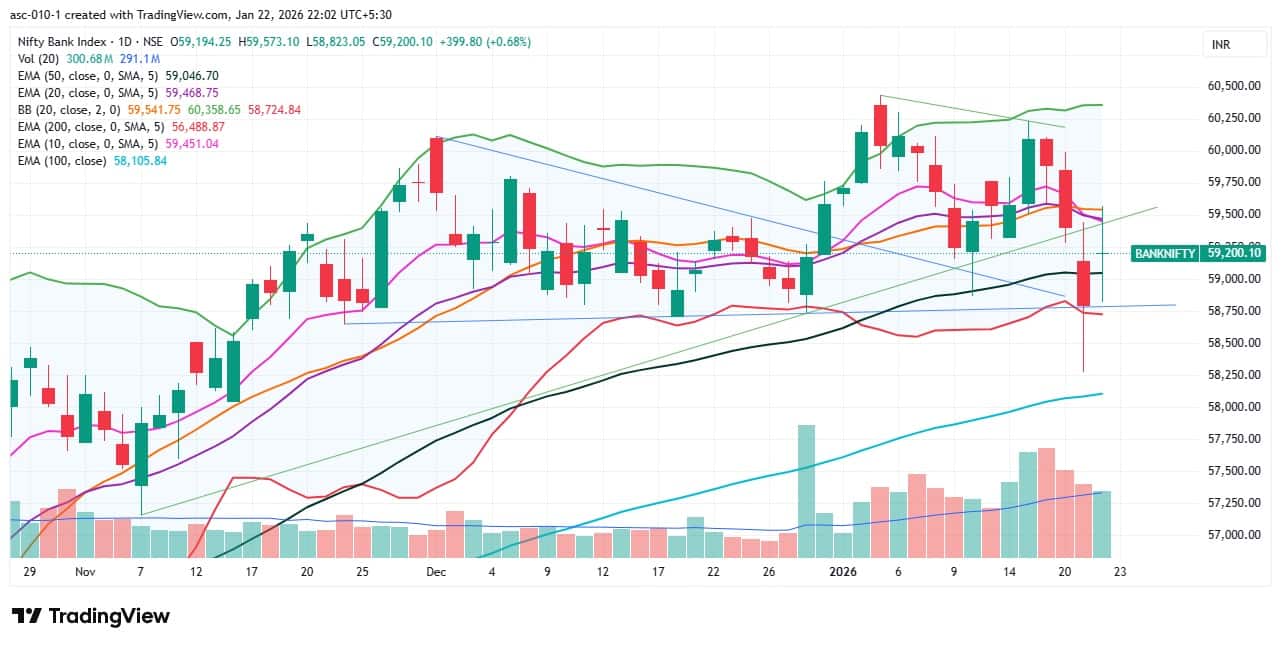
2) Key Levels For The Bank Nifty (59,200)
Resistance based on pivot points: 59,485, 59,662, and 59,949
Support based on pivot points: 58,912, 58,735, and 58,449
Resistance based on Fibonacci retracement: 59,356, 59,612
Support based on Fibonacci retracement: 58,815, 57,811
Special Formation: The Bank Nifty rallied 400 points and formed a doji candlestick pattern on the daily charts following three bearish candles, indicating indecision among bulls and bears. Generally, this pattern acts as a trend reversal signal but needs confirmation in the following session. The index negated the lower highs of the previous three consecutive sessions. It climbed above the 50 DEMA but remained below short-term moving averages and the midline of the Bollinger Bands, though it managed to hold above 58,800 (trendline support) for another session. The momentum indicators still signal a bearish mood, with the RSI at 47 below the reference line, while the MACD also remained below the signal line with further weakness in the histogram. All this indicates continued uncertainty in the near term.
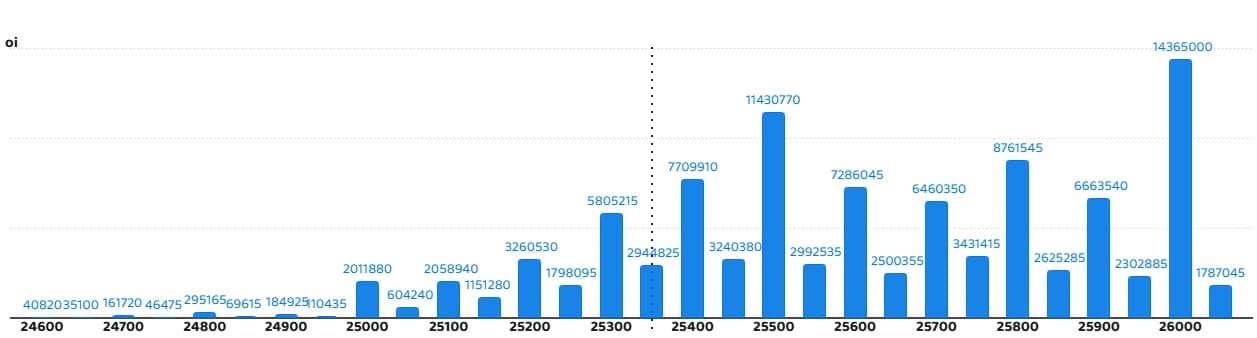
According to the monthly options data, the 26,000 strike holds the maximum Call open interest (with 1.43 crore contracts). This level can act as a key resistance level for the Nifty in the short term. It was followed by the 25,500 strike (1.14 crore contracts) and 25,800 strike (87.61 lakh contracts).
Maximum Call writing was observed at the 25,400 strike, which saw an addition of 24.28 lakh contracts, followed by the 25,800 and 25,600 strikes, which added 11.69 lakh and 7.17 lakh contracts, respectively. The maximum Call unwinding was seen at the 25,200 strike, which shed 24.69 lakh contracts, followed by the 25,100 and 25,150 strikes, which shed 12.63 lakh and 10.62 lakh contracts, respectively.
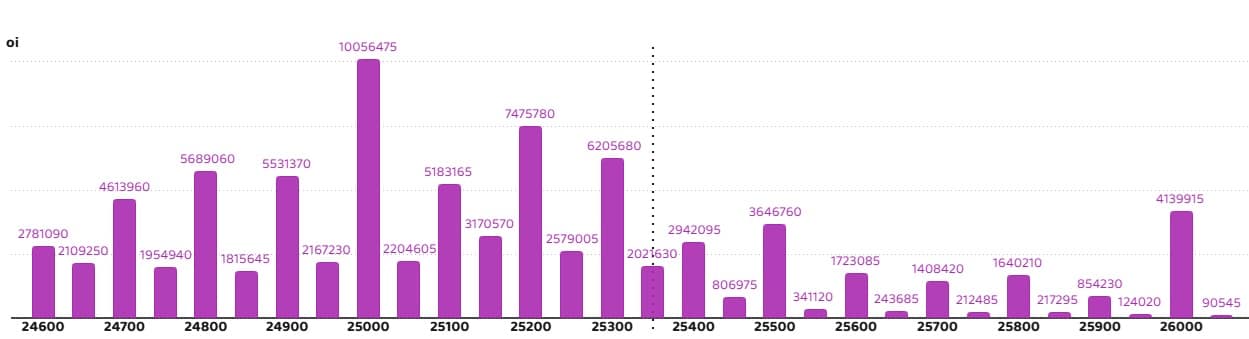
On the Put side, the maximum Put open interest was seen at the 25,000 strike (with 1 crore contracts), which can act as a key support level for the Nifty in the short term. It was followed by the 25,200 strike (74.75 lakh contracts) and the 25,300 strike (62.05 lakh contracts).
The maximum Put writing was placed at the 25,300 strike, which saw an addition of 28.46 lakh contracts, followed by the 25,200 and 25,000 strikes, which added 18.82 lakh and 11.9 lakh contracts, respectively. The maximum Put unwinding was seen at the 24,700 strike, which shed 5.35 lakh contracts, followed by the 26,000 and 25,800 strikes, which shed 3.81 lakh and 2.52 lakh contracts, respectively.
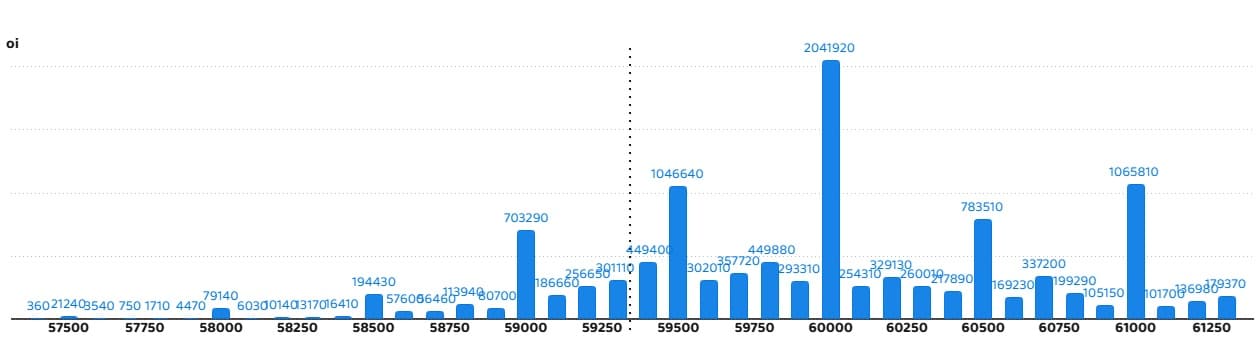
5) Bank Nifty Call Options Data
According to the monthly options data, the 60,000 strike holds the maximum Call open interest, with 20.41 lakh contracts. This can act as a key resistance level for the index in the short term. It was followed by the 61,000 strike (10.65 lakh contracts) and the 59,500 strike (10.46 lakh contracts).
Maximum Call writing was observed at the 60,000 strike (with the addition of 1.38 lakh contracts), followed by the 59,300 strike (73,650 contracts) and 59,400 strike (54,540 contracts). The maximum Call unwinding was seen at the 59,700 strike, which shed 1.21 lakh contracts, followed by the 59,800 and 58,800 strikes which shed 78,930 and 77,220 contracts, respectively.
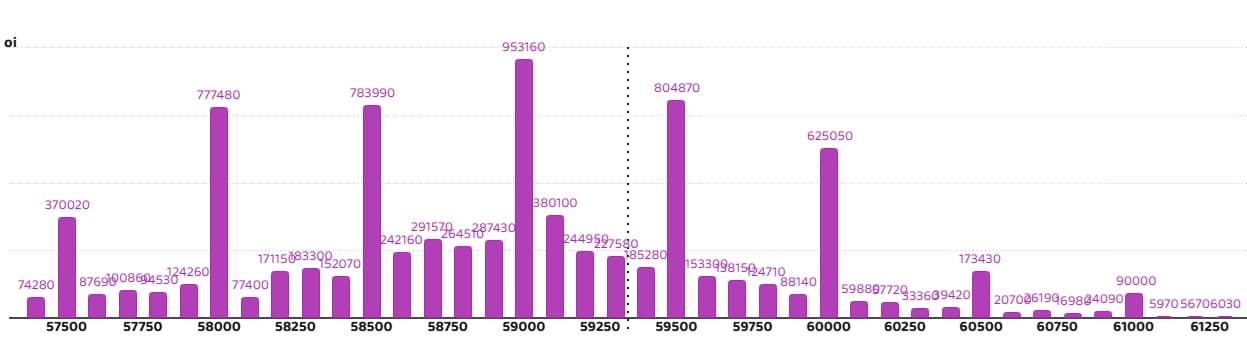
6) Bank Nifty Put Options Data
On the Put side, the maximum Put open interest was seen at the 59,000 strike (with 9.53 lakh contracts), which can act as a key support level for the index. This was followed by the 59,500 strike (8.04 lakh contracts) and the 58,500 strike (7.83 lakh contracts).
The maximum Put writing was placed at the 59,000 strike (which added 2.97 lakh contracts), followed by the 58,900 strike (1.14 lakh contracts) and the 58,700 strike (95,550 contracts). The maximum Put unwinding was seen at the 58,500 strike, which shed 86,730 contracts, followed by the 58,200 and 60,000 strikes, which shed 50,040 and 47,130 contracts, respectively.
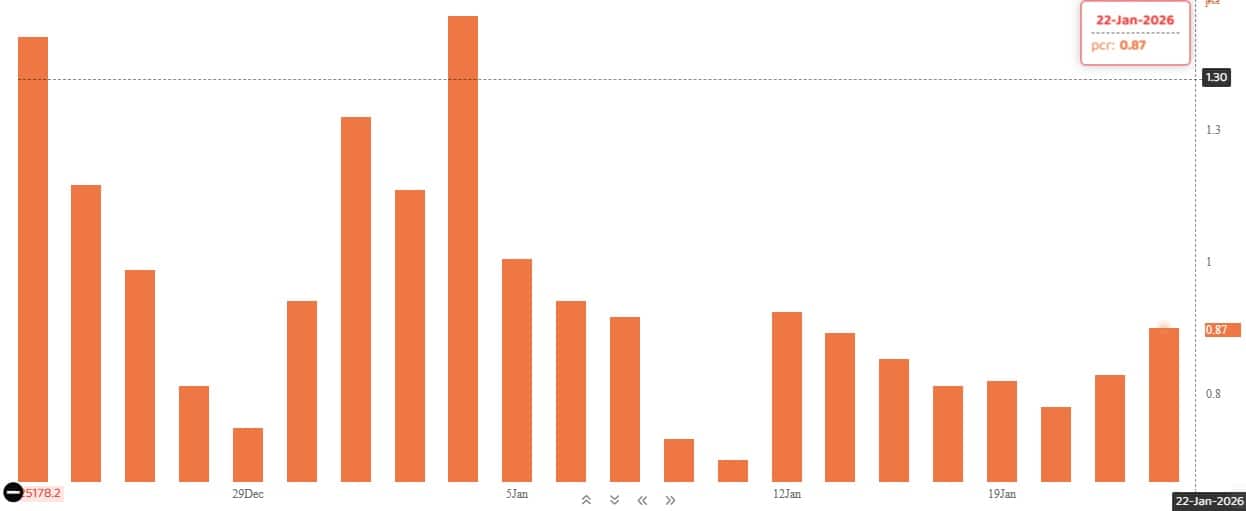
The Nifty Put-Call ratio (PCR), which indicates the mood of the market, increased to 0.87 on January 22, compared to 0.78 in the previous session.
The increasing PCR, or being higher than 0.7 or surpassing 1, means traders are selling more Put options than Call options, which generally indicates the firming up of a bullish sentiment in the market. If the ratio falls below 0.7 or moves towards 0.5, then it indicates selling in Calls is higher than selling in Puts, reflecting a bearish mood in the market.
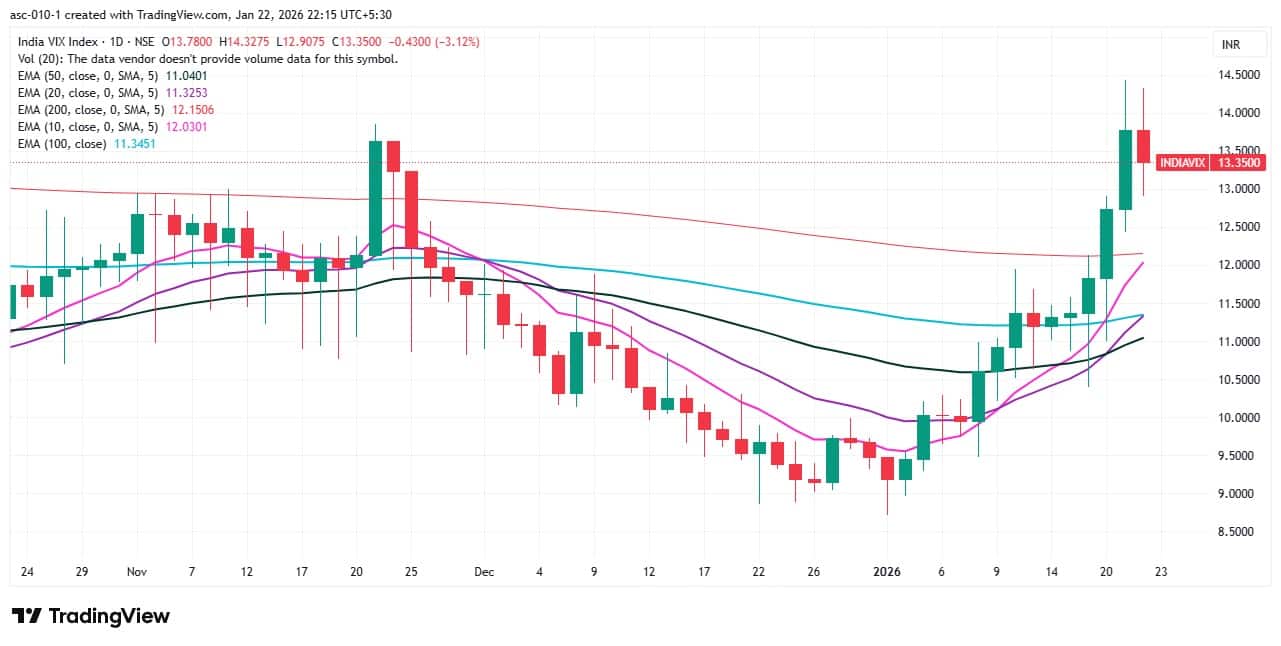
9) India VIX
The India VIX, also known as the fear index, remained at elevated levels, though it corrected 3.12 percent to 13.35 after a sharp surge, signalling consistent discomfort for bulls.
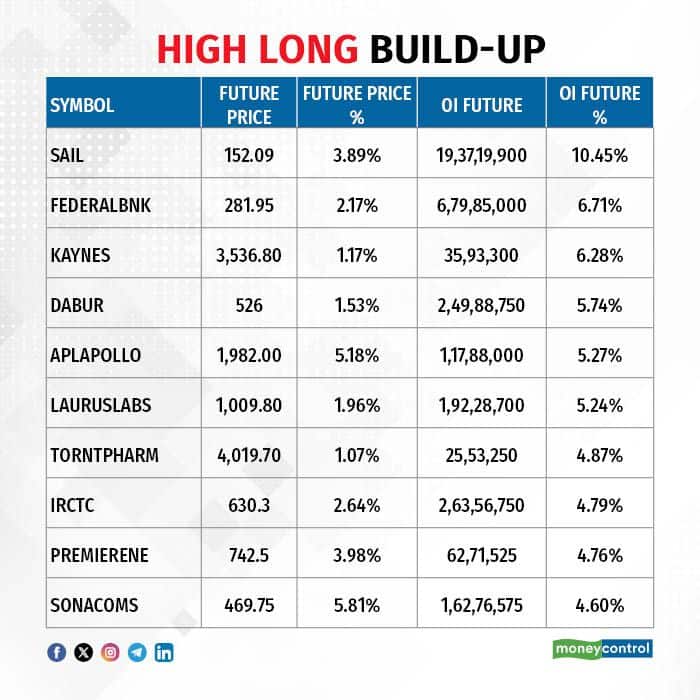
A long build-up was seen in 81 stocks. An increase in open interest (OI) and price indicates a build-up of long positions.
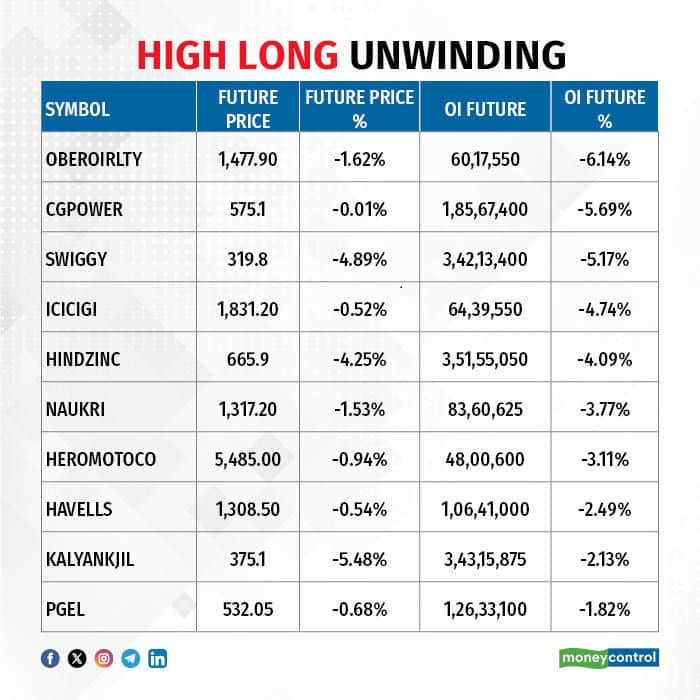
11) Long Unwinding (18 Stocks)
18 stocks saw a decline in open interest (OI) along with a fall in price, indicating long unwinding.
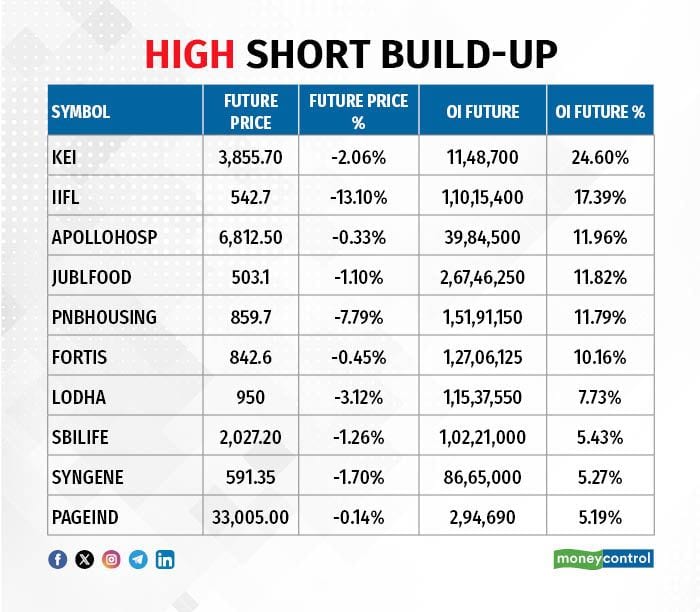
12) Short Build-up (29 Stocks)
29 stocks saw an increase in OI along with a fall in price, indicating a build-up of short positions.
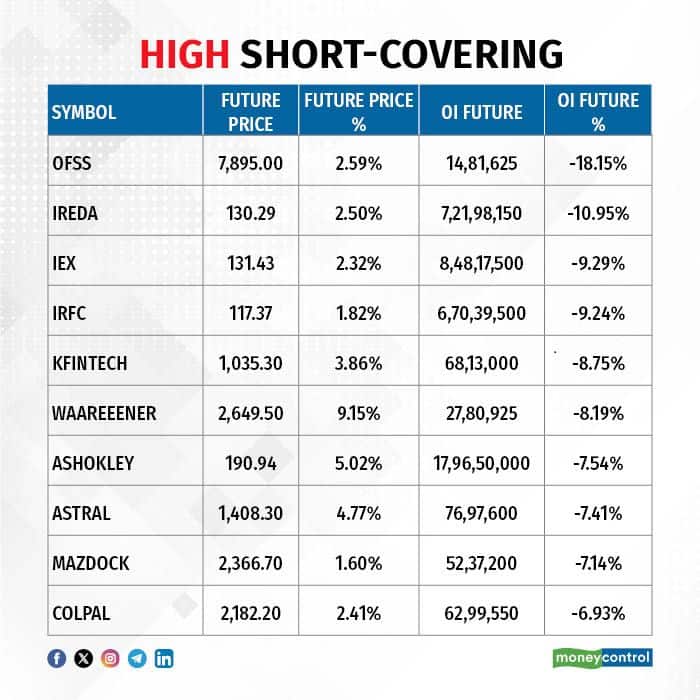
13) Short-Covering (84 Stocks)
84 stocks saw short-covering, meaning a decrease in OI, along with a price increase.
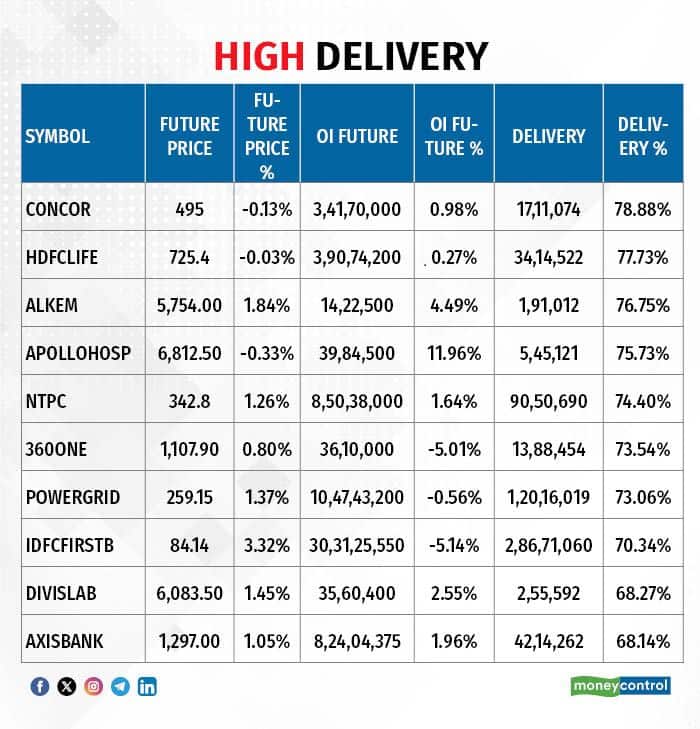
Here are the stocks that saw a high share of delivery trades. A high share of delivery reflects investing (as opposed to trading) interest in a stock.
Securities banned under the F&O segment include companies where derivative contracts cross 95 percent of the market-wide position limit.
Stocks added to F&O ban: Nil
Stocks retained in F&O ban: Bandhan Bank, Sammaan Capital
Stocks removed from F&O ban: Nil
Disclaimer: The views and investment tips expressed by experts on Moneycontrol are their own and not those of the website or its management. Moneycontrol advises users to check with certified experts before taking any investment decisions.Disclaimer: Moneycontrol is a part of the Network18 group. Network18 is controlled by Independent Media Trust, of which Reliance Industries is the sole beneficiary.Discover the latest Business News, Sensex, and Nifty updates. Obtain Personal Finance insights, tax queries, and expert opinions on Moneycontrol or download the Moneycontrol App to stay updated!
Find the best of Al News in one place, specially curated for you every weekend.
Stay on top of the latest tech trends and biggest startup news.


