


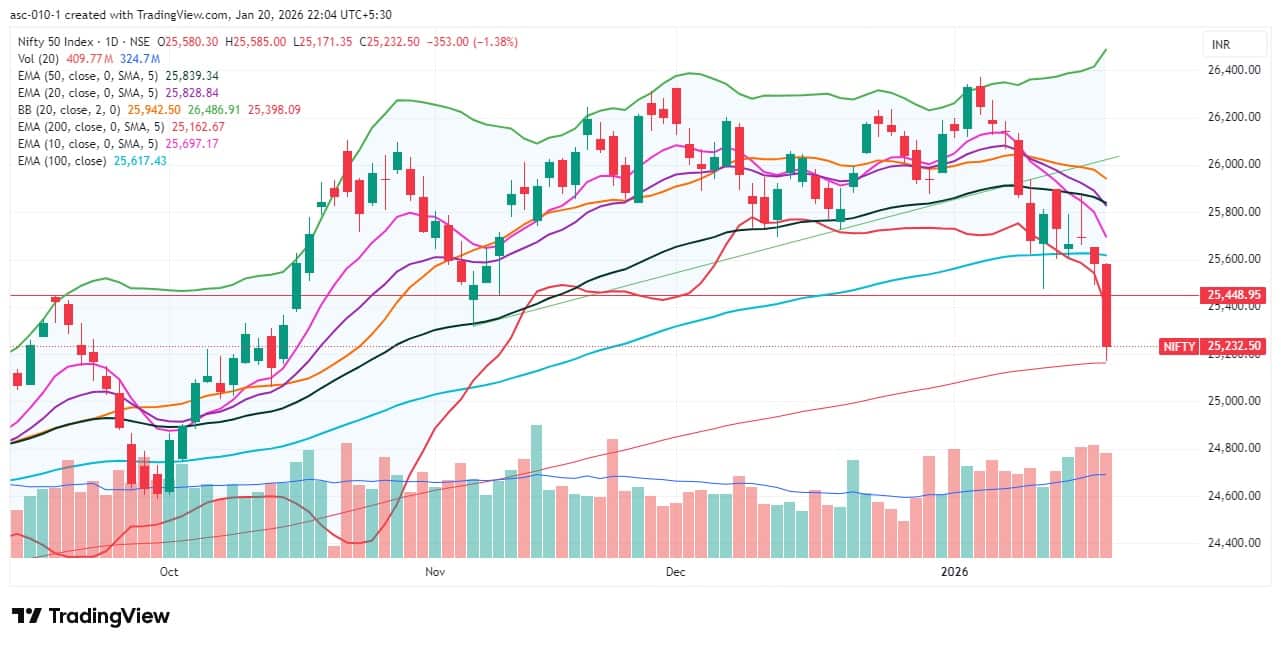
The Nifty 50 fell sharply by more than 1 percent to hit a three-and-a-half-month low on January 20, reaching close to the 200-day EMA (25,160) amid bearish technical and momentum indicators, subdued market breadth, and a rising India VIX. After a severe correction, the market may bounce back, but sustainability will be the key factor to watch. In such a scenario, the index is expected to face resistance in the 25,300–25,400 zone. Meanwhile, the immediate support is placed at 25,160, followed by 25,000–24,800, which remain crucial support levels, according to experts.
Here are 15 data points we have collated to help you spot profitable trades:
1) Key Levels For The Nifty 50 (25,233)
Resistance based on pivot points: 25,488, 25,585, and 25,743
Support based on pivot points: 25,172, 25,074, and 24,916
Special Formation: The Nifty 50 formed a long red candle on the daily charts after a six-day consolidation breakdown, accompanied by above-average volumes, indicating rising selling pressure. The index traded well below the 20-, 50-, and 100-day EMAs, but held marginally above the 200-day EMA, with short-term moving averages trending downward. The 10-day EMA had already slipped below the 20- and 50-day EMAs, and now the 20-day EMA has breached the 50-day EMA on the downside. The RSI fell below 30, entering the oversold zone at 29.27, while the MACD remained below the zero line with a bearish crossover, and histogram weakness increased further. All these indicators point to strong bearish momentum and selling dominance in the near term.
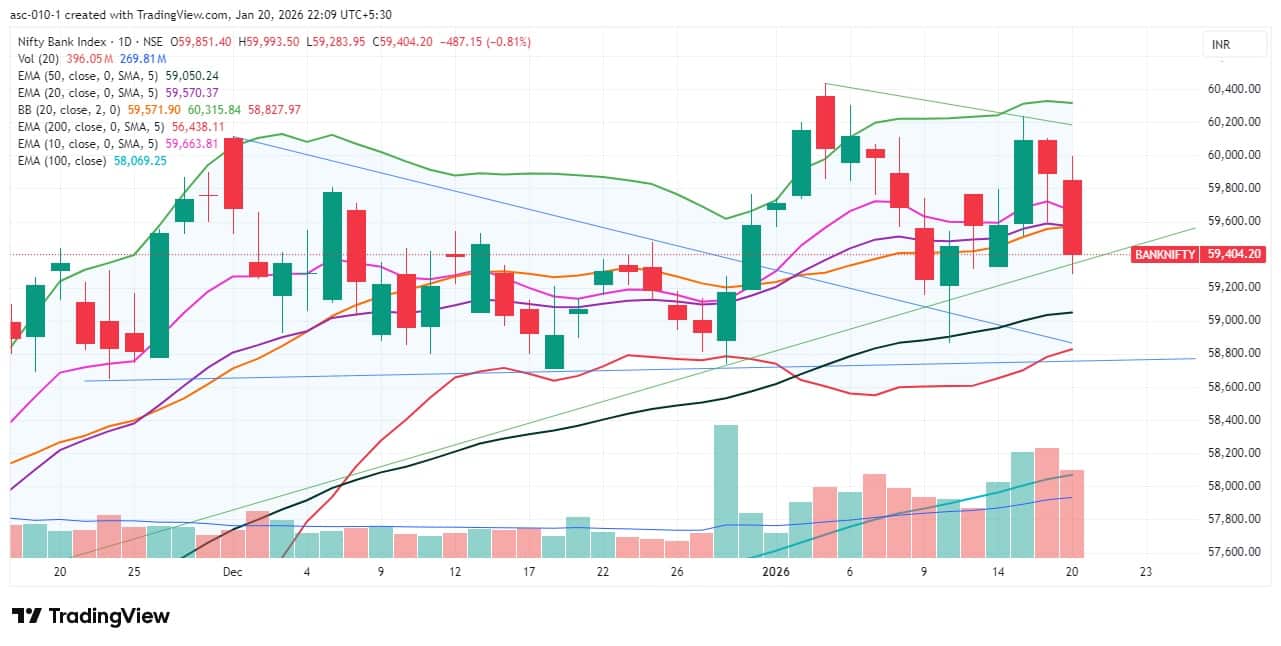
2) Key Levels For The Bank Nifty (59,404)
Resistance based on pivot points: 59,832, 59,999, and 60,270
Support based on pivot points: 59,289, 59,122, and 58,851
Resistance based on Fibonacci retracement: 59,842, 60,105
Support based on Fibonacci retracement: 59,097, 58,737
Special Formation: The Bank Nifty also formed a long bearish candle with minor upper and lower shadows on the daily timeframe, accompanied by above-average volumes, indicating a bearish sentiment. The index slipped below short-term moving averages and the midline of the Bollinger Bands in a single session, while the RSI at 48.82 maintained a bearish crossover. The MACD remained below the signal line, with continued weakness in the histogram. All these factors indicate sustained weakness and limited upside momentum in the index.
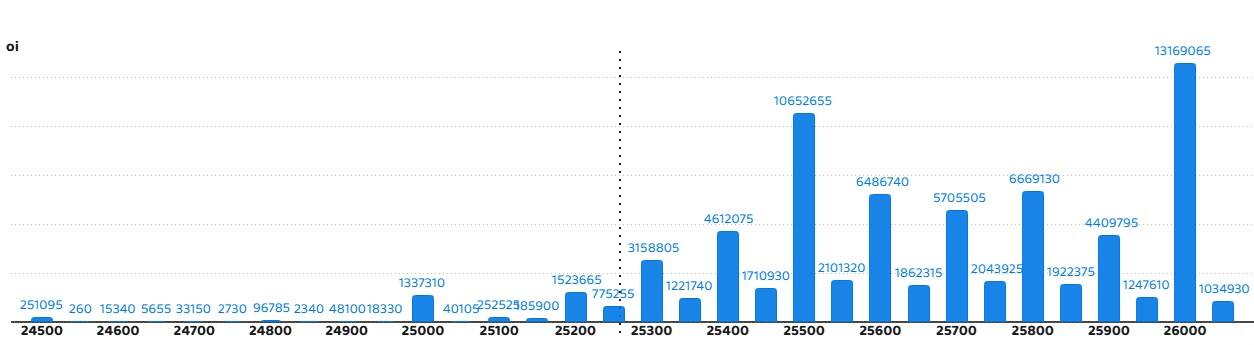
According to the monthly options data, the 26,000 strike holds the maximum Call open interest (with 1.31 crore contracts). This level can act as a key resistance level for the Nifty in the short term. It was followed by the 25,500 strike (1.06 crore contracts) and 25,800 strike (66.69 lakh contracts).
Maximum Call writing was observed at the 25,500 strike, which saw an addition of 87.14 lakh contracts, followed by the 25,400 and 25,600 strikes, which added 41.69 lakh and 35.4 lakh contracts, respectively. There was hardly any Call unwinding seen in the 24,500-26,000 strike band.
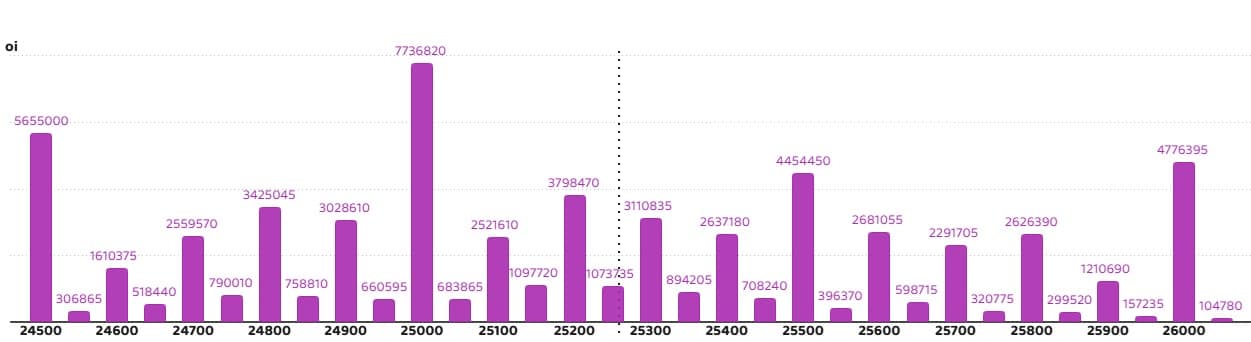
On the Put side, the maximum Put open interest 25,000 strike (with 77.36 lakh contracts), which can act as a key support level for the Nifty in the short term. It was followed by the 24,500 strike (56.55 lakh contracts) and the 26,000 strike (47.76 lakh contracts).
The maximum Put writing was placed at the 25,000 strike, which saw an addition of 21.57 lakh contracts, followed by the 24,500 and 24,900 strikes, which added 19.74 lakh and 17.81 lakh contracts, respectively. The maximum Put unwinding was seen at the 25,600 strike, which shed 9.26 lakh contracts, followed by the 26,000 and 25,800 strikes, which shed 5.86 lakh and 5.82 lakh contracts, respectively.
5) Bank Nifty Call Options Data
According to the monthly options data, the 60,000 strike holds the maximum Call open interest, with 18.34 lakh contracts. This can act as a key resistance level for the index in the short term. It was followed by the 59,500 strike (8.57 lakh contracts) and the 61,000 strike (8.27 lakh contracts).
Maximum Call writing was observed at the 60,000 strike (with the addition of 3.71 lakh contracts), followed by the 59,700 strike (2.55 lakh contracts) and 59,800 strike (2.48 lakh contracts). The maximum Call unwinding was seen at the 59,500 strike, which shed 1.78 lakh contracts, followed by the 60,800 and 60,900 strikes which shed 26,580 and 21,720 contracts, respectively.
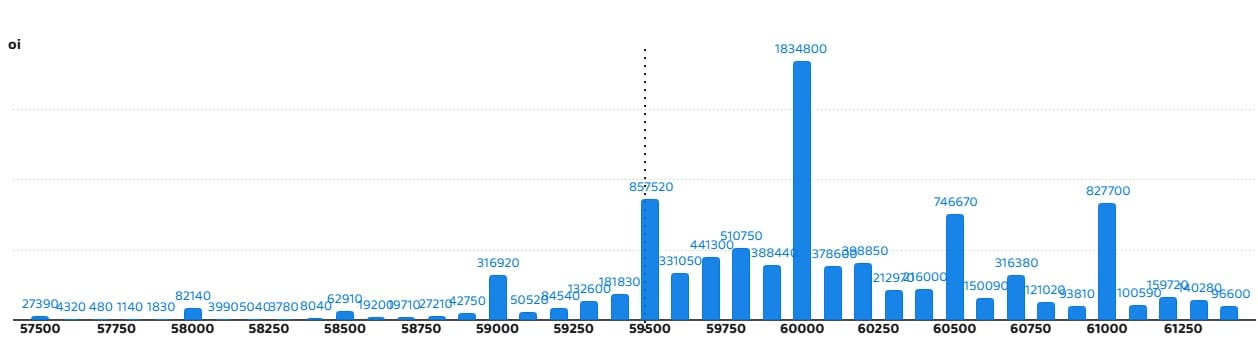
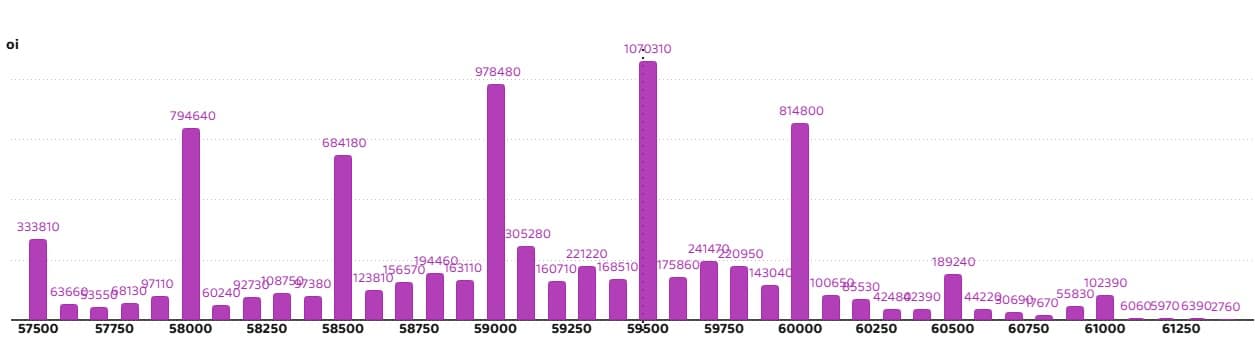
6) Bank Nifty Put Options Data
On the Put side, the maximum Put open interest was seen at the 59,500 strike (with 10.7 lakh contracts), which can act as a key level for the index. This was followed by the 59,000 strike (9.78 lakh contracts) and the 60,000 strike (8.14 lakh contracts).
The maximum Put writing was placed at the 59,000 strike (which added 22,920 contracts), followed by the 58,800 strike (12,540 contracts) and the 57,500 strike (11,370 contracts). The maximum Put unwinding was seen at the 59,500 strike, which shed 4.7 lakh contracts, followed by the 60,000 and 59,300 strikes, which shed 2.76 lakh and 2.11 lakh contracts, respectively.
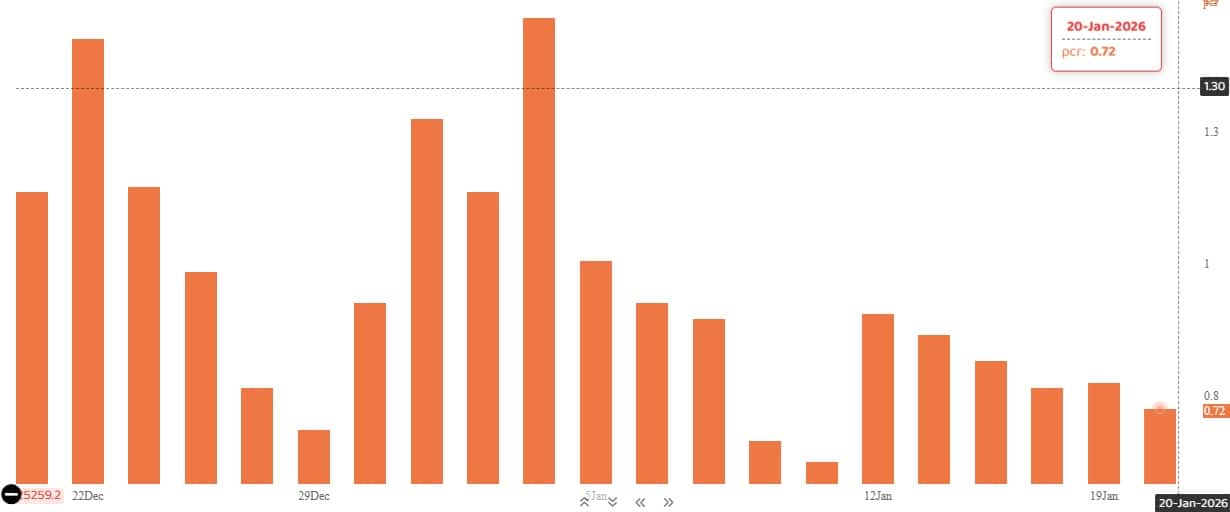
The Nifty Put-Call ratio (PCR), which indicates the mood of the market, declined to 0.72 on January 20, compared to 0.77 in the previous session.
The increasing PCR, or being higher than 0.7 or surpassing 1, means traders are selling more Put options than Call options, which generally indicates the firming up of a bullish sentiment in the market. If the ratio falls below 0.7 or moves towards 0.5, then it indicates selling in Calls is higher than selling in Puts, reflecting a bearish mood in the market.
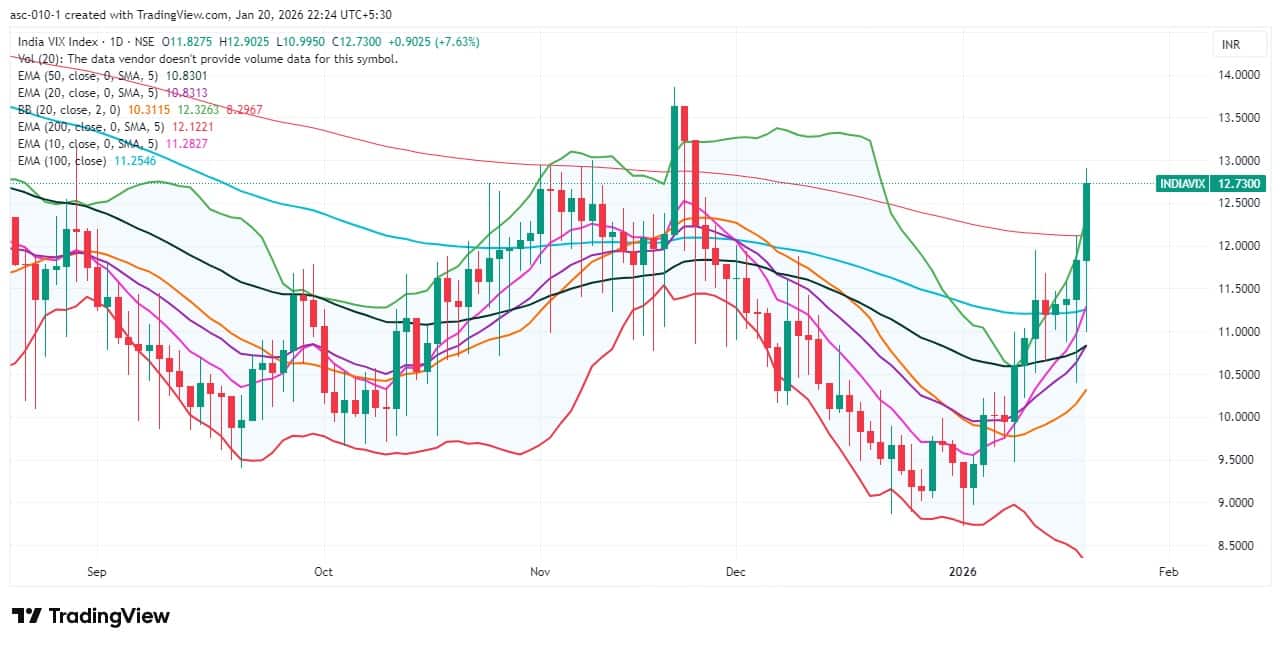
9) India VIX
The fear index, India VIX, maintained its uptrend and surpassed all key moving averages, moving closer to the 13 level, which signalled increasing discomfort for bulls. It closed at 12.73, up 7.63 percent. Uncertainty and risk for bulls may increase further if the VIX crosses the 13–14 levels in the upcoming sessions.
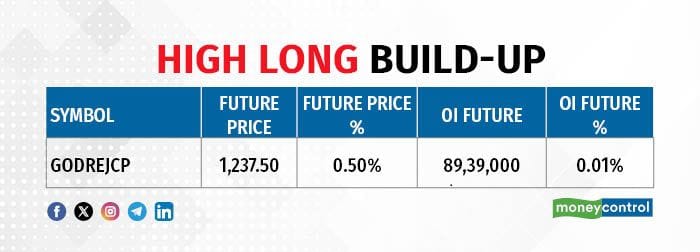
A long build-up was seen in 1 stock. An increase in open interest (OI) and price indicates a build-up of long positions.
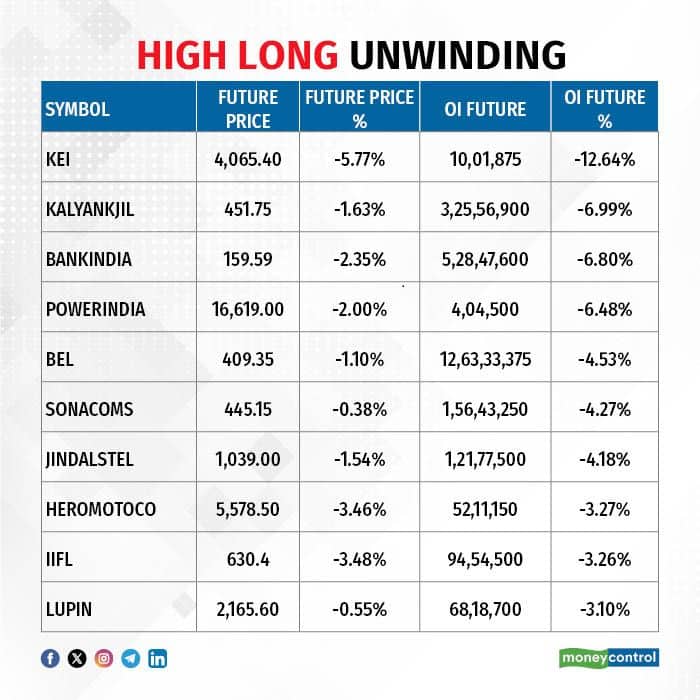
11) Long Unwinding (88 Stocks)
88 stocks saw a decline in open interest (OI) along with a fall in price, indicating long unwinding.
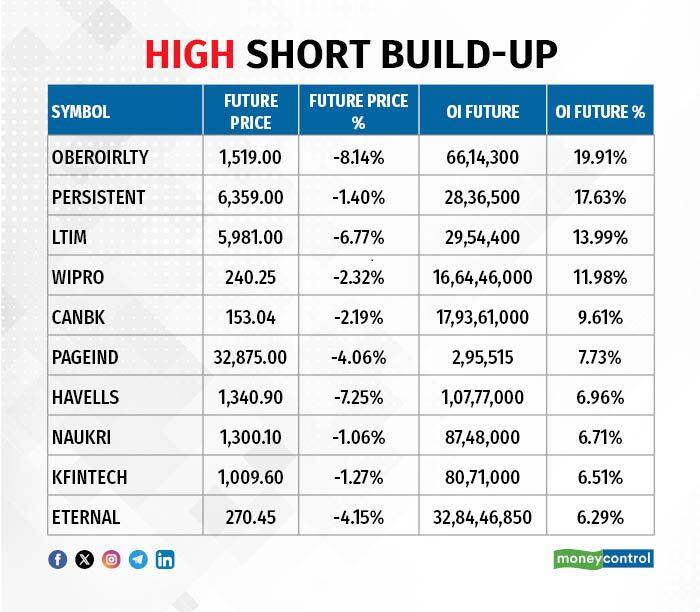
12) Short Build-up (118 Stocks)
118 stocks saw an increase in OI along with a fall in price, indicating a build-up of short positions.
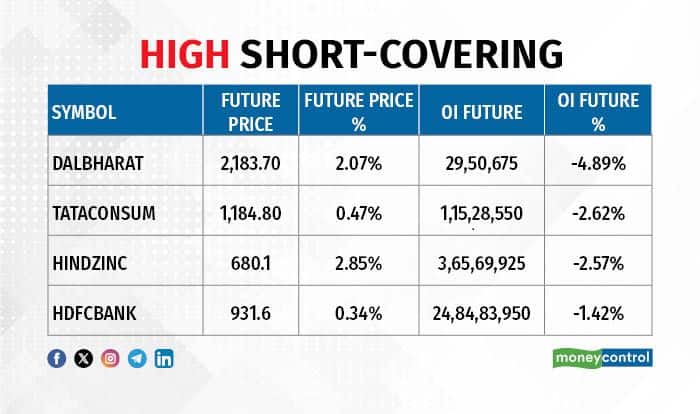
4 stocks saw short-covering, meaning a decrease in OI, along with a price increase.
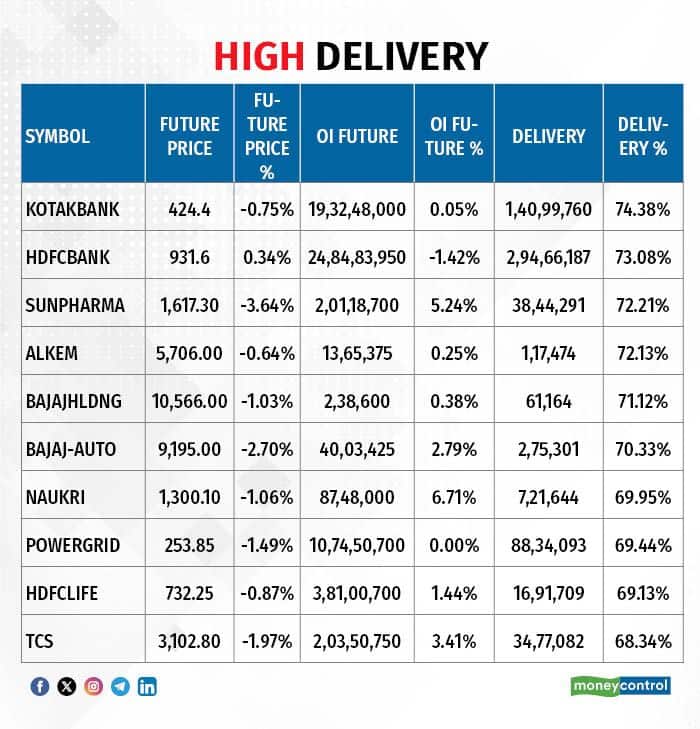
Here are the stocks that saw a high share of delivery trades. A high share of delivery reflects investing (as opposed to trading) interest in a stock.
Securities banned under the F&O segment include companies where derivative contracts cross 95 percent of the market-wide position limit.
Stocks added to F&O ban: Nil
Stocks retained in F&O ban: SAIL, Sammaan Capital
Stocks removed from F&O ban: Nil
Disclaimer: The views and investment tips expressed by experts on Moneycontrol are their own and not those of the website or its management. Moneycontrol advises users to check with certified experts before taking any investment decisions.Disclaimer: Moneycontrol is a part of the Network18 group. Network18 is controlled by Independent Media Trust, of which Reliance Industries is the sole beneficiary.Discover the latest Business News, Sensex, and Nifty updates. Obtain Personal Finance insights, tax queries, and expert opinions on Moneycontrol or download the Moneycontrol App to stay updated!
Find the best of Al News in one place, specially curated for you every weekend.
Stay on top of the latest tech trends and biggest startup news.


