


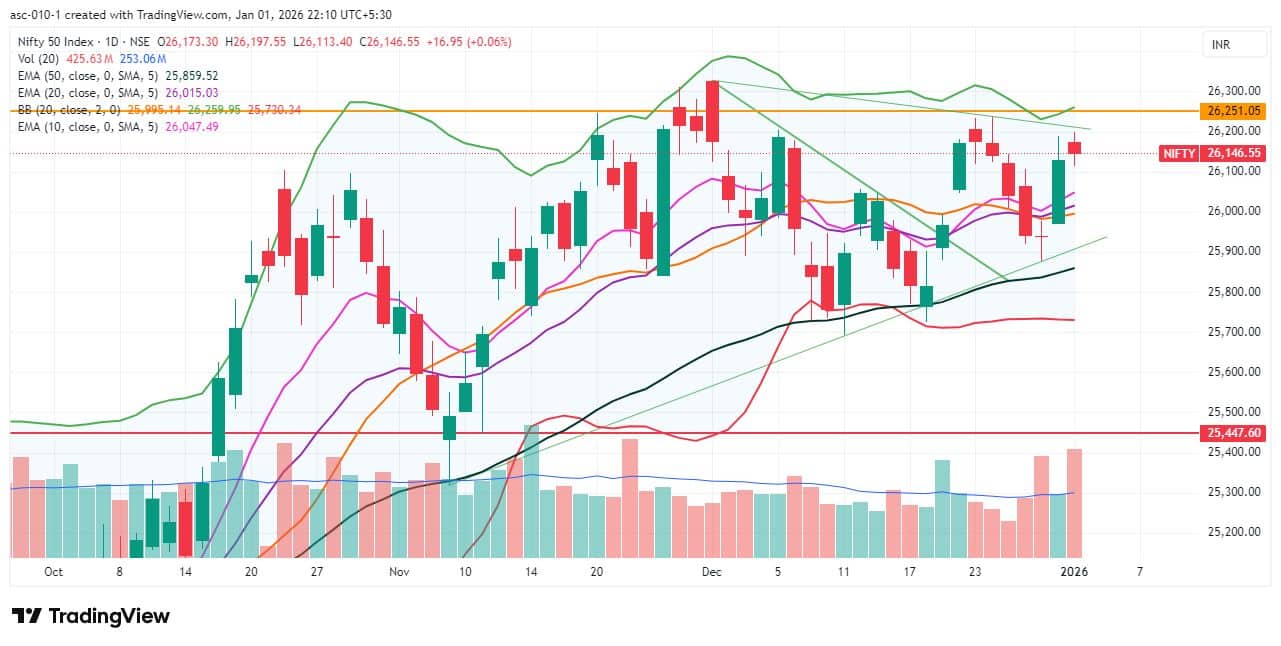
The Nifty 50 maintained its upward journey for another session amid range-bound trading and closed 17 points higher on January 1. The index made an attempt to hit the 26,200 level, which also coincides with a falling resistance trendline, but failed to sustain near it and finished slightly below 26,150. Momentum and technical indicators remained supportive; hence, experts believe the index is expected to give a strong breakout above 26,200 and march toward the 26,350–26,400 zone in the upcoming sessions. Until then, minor consolidation may continue, with immediate key support placed in the 26,050–26,000 zone.
Here are 15 data points we have collated to help you spot profitable trades:
1) Key Levels For The Nifty 50 (26,147)
Resistance based on pivot points: 26,185, 26,205, and 26,237
Support based on pivot points: 26,120, 26,101, and 26,068
Special Formation: The Nifty 50 formed a small-bodied bearish candle with minor shadows on the daily charts, indicating range-bound trading, but continued its higher high–higher low structure for another session after taking support and forming a higher bottom on the day of the Doji candle formation on December 30. Further improvement was seen in momentum indicators, with the RSI at 56.65 and the Stochastic RSI maintaining a bullish crossover. The MACD showed a bullish breakout, with the histogram climbing above the zero line. All these indicators suggest continued underlying strength in the trend despite short-term consolidation.
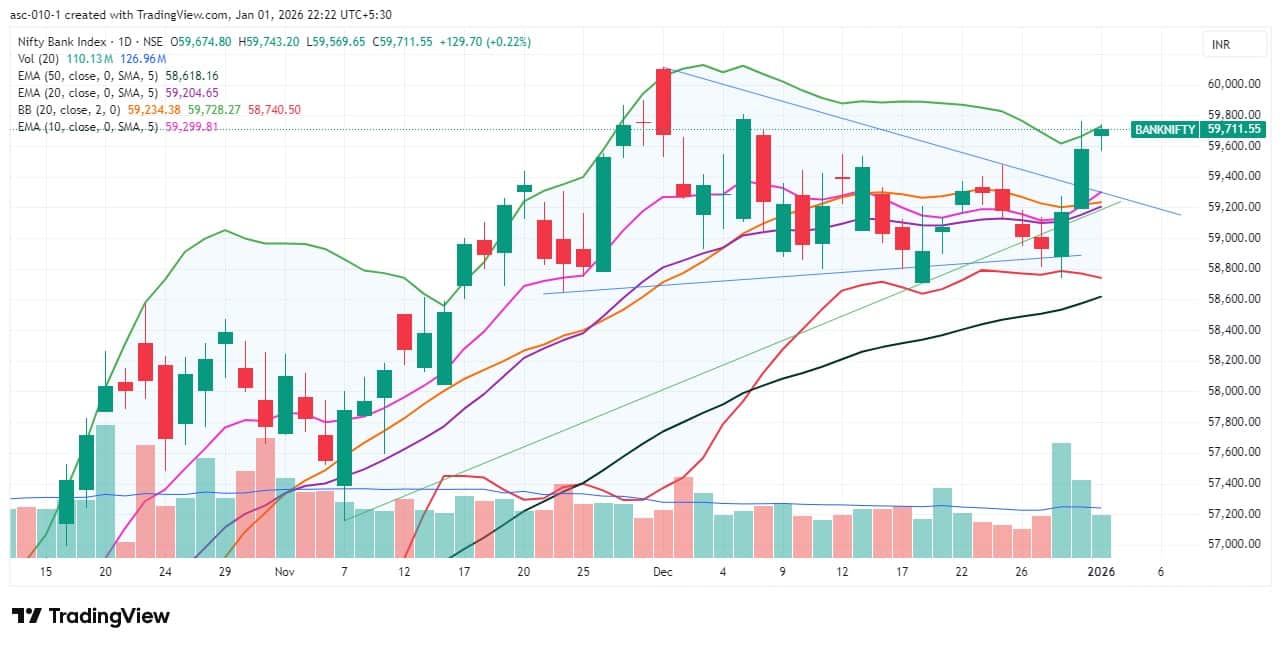
2) Key Levels For The Bank Nifty (59,712)
Resistance based on pivot points: 59,741, 59,782, and 59,848
Support based on pivot points: 59,608, 59,568, and 59,501
Resistance based on Fibonacci retracement: 60,875, 62,294
Support based on Fibonacci retracement: 59,417, 58,985
Special Formation: The Bank Nifty also witnessed range-bound trading, forming a small bullish candle on the daily timeframe and closing near the upper Bollinger Bands. The index could not move beyond the previous day’s high, though it continued its upward journey for the third straight session, rising 130 points. The RSI climbed to 61.95 and the Stochastic RSI reached 81.50, while the MACD remained on the verge of a bullish crossover, with weakness in the histogram fading further. All these indicators point to sustained bullish bias with a possibility of continuation once resistance levels are crossed.
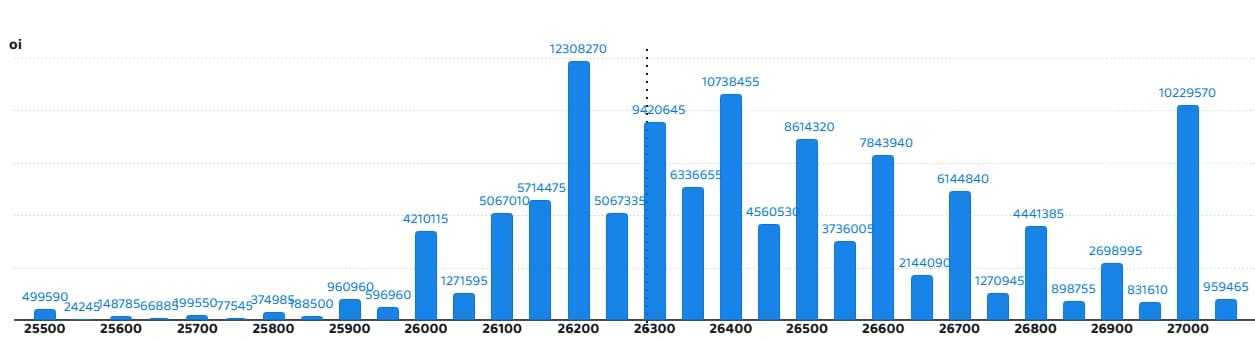
According to the weekly options data, the 26,200 strike holds the maximum Call open interest (with 1.23 crore contracts). This level can act as a key resistance level for the Nifty in the short term. It was followed by the 26,400 strike (1.07 crore contracts) and 27,000 strike (1.02 crore contracts).
Maximum Call writing was observed at the 26,200 strike, which saw an addition of 59.75 lakh contracts, followed by the 26,350 and 27,000 strikes, which added 40.45 lakh and 38.18 lakh contracts, respectively. The maximum Call unwinding was seen at the 26,000 strike, which shed 1.76 lakh contracts, followed by the 25,800 and 25,900 strikes, which shed 1.34 lakh and 1.25 lakh contracts, respectively.
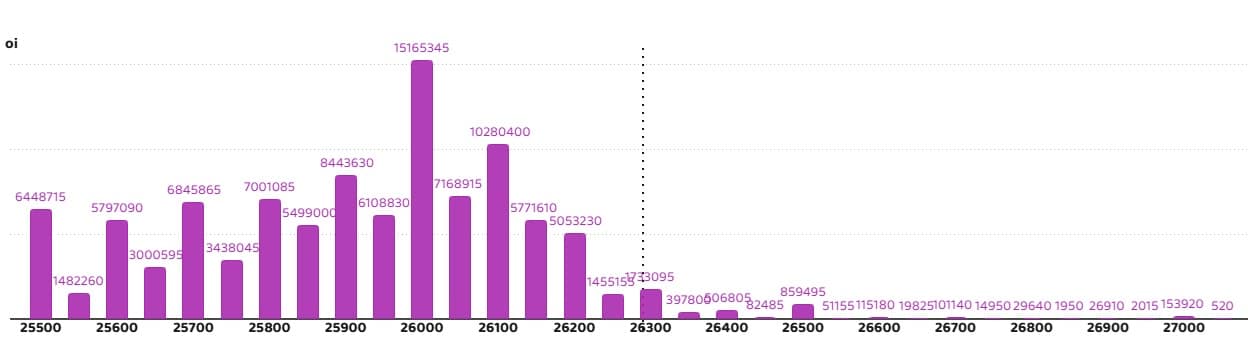
On the Put side, the maximum Put open interest was seen at the 26,000 strike (with 1.51 crore contracts), which can act as a key support level for the Nifty in the short term. It was followed by the 26,100 strike (1.02 crore contracts) and the 25,900 strike (84.43 lakh contracts).
The maximum Put writing was placed at the 26,150 strike, which saw an addition of 24.06 lakh contracts, followed by the 26,100 and 26,000 strikes, which added 23.1 lakh and 15.78 lakh contracts, respectively. The maximum Put unwinding was seen at the 26,450 strike, which shed 19,890 contracts, followed by the 26,500 and 26,600 strikes, which shed 19,695 and 18,850 contracts, respectively.
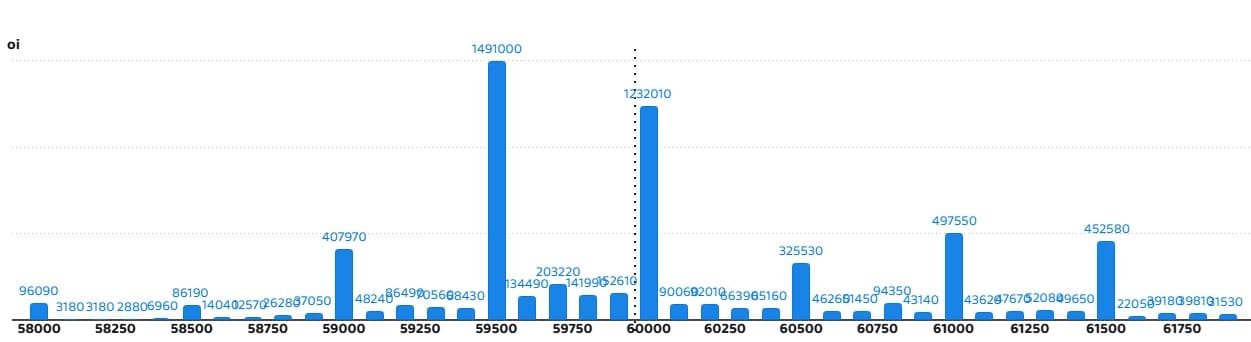
5) Bank Nifty Call Options Data
According to the monthly options data, the 59,500 strike holds the maximum Call open interest, with 14.91 lakh contracts. This can act as a key level for the index in the short term. It was followed by the 60,000 strike (12.32 lakh contracts) and the 61,000 strike (4.97 lakh contracts).
Maximum Call writing was observed at the 60,000 strike (with the addition of 2.1 lakh contracts), followed by the 61,500 strike (49,440 contracts) and 59,700 strike (43,770 contracts). The maximum Call unwinding was seen at the 59,500 strike, which shed 15,300 contracts, followed by the 61,300 and 60,900 strikes which shed 13,470 and 10,260 contracts, respectively.
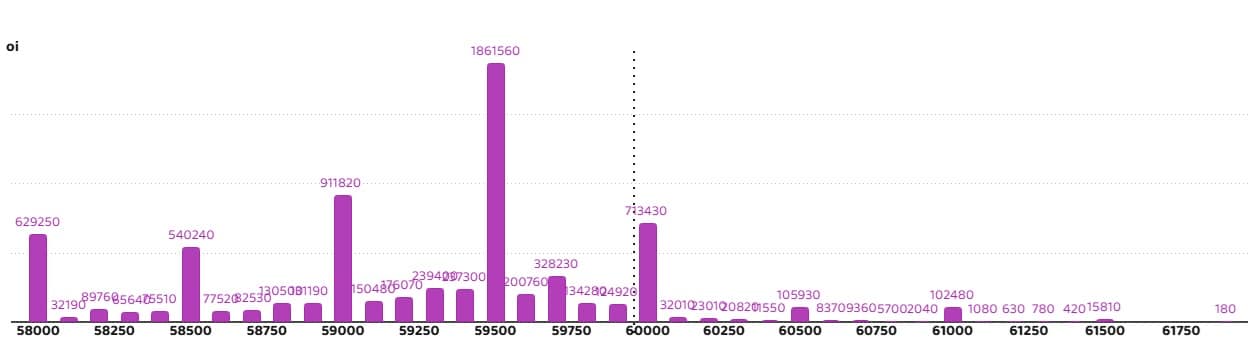
6) Bank Nifty Put Options Data
On the Put side, the maximum Put open interest was seen at the 59,500 strike (with 18.61 lakh contracts), which can act as a key support level for the index. This was followed by the 59,000 strike (9.11 lakh contracts) and the 60,000 strike (7.13 lakh contracts).
The maximum Put writing was placed at the 60,000 strike (which added 1.59 lakh contracts), followed by the 59,500 strike (78,120 contracts) and the 59,700 strike (76,560 contracts). The maximum Put unwinding was seen at the 58,000 strike, which shed 16,530 contracts, followed by the 58,200 and 59,300 strikes, which shed 9420 and 4,020 contracts, respectively.
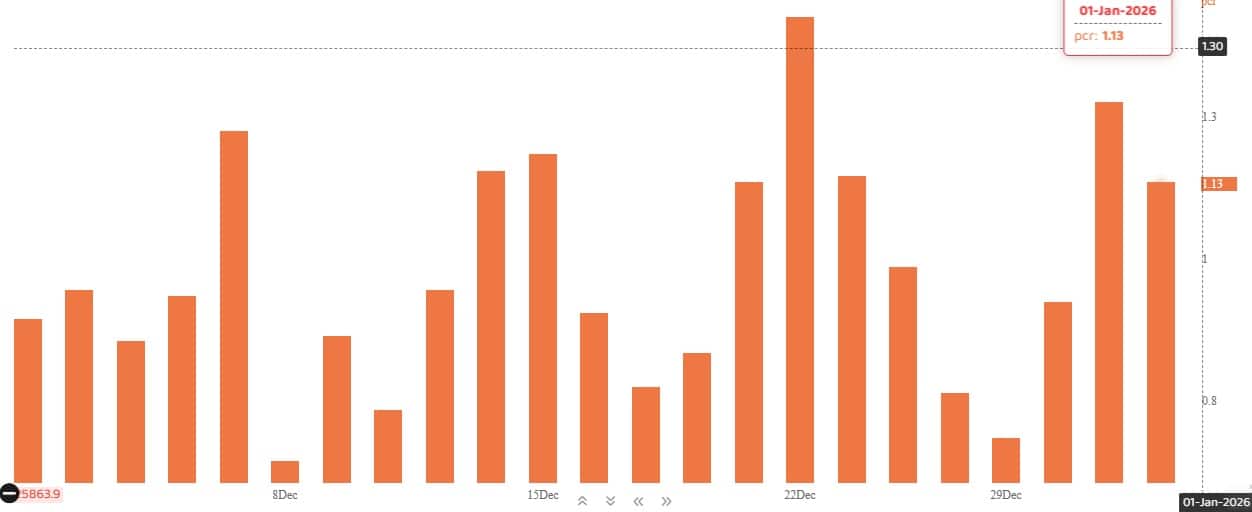
The Nifty Put-Call ratio (PCR), which indicates the mood of the market, fell to 1.13 on January 1, compared to 1.27 in the previous session.
The increasing PCR, or being higher than 0.7 or surpassing 1, means traders are selling more Put options than Call options, which generally indicates the firming up of a bullish sentiment in the market. If the ratio falls below 0.7 or moves towards 0.5, then it indicates selling in Calls is higher than selling in Puts, reflecting a bearish mood in the market.
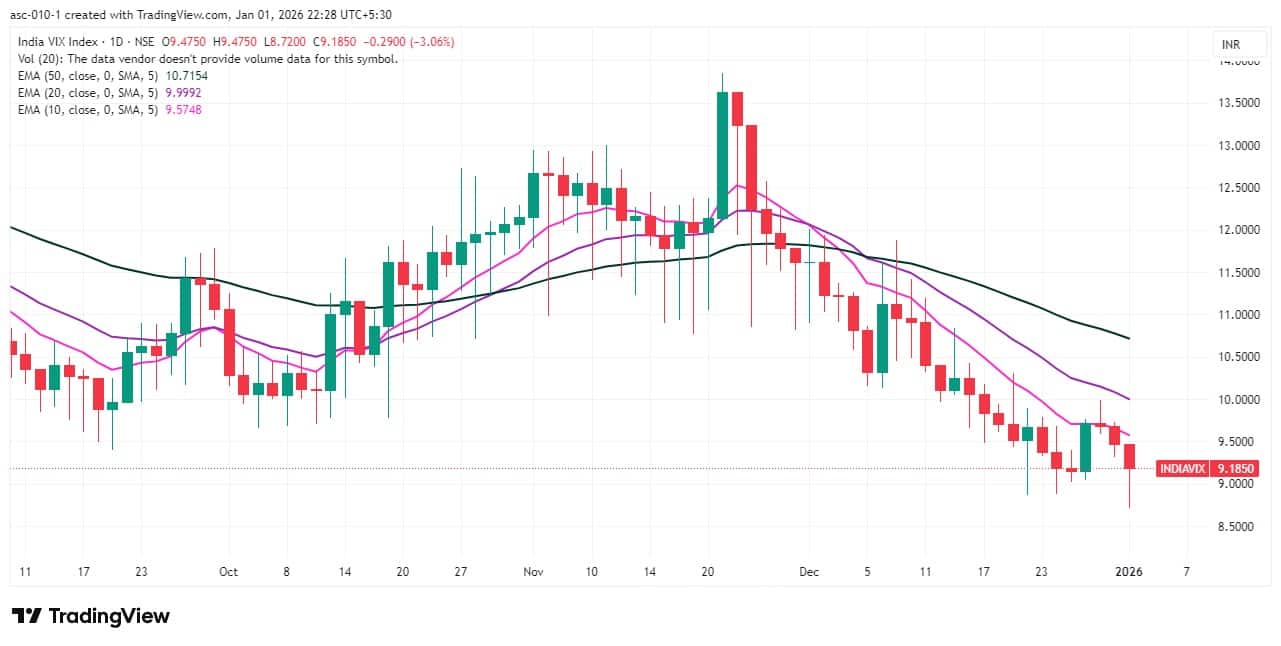
9) India VIX
The India VIX, also known as the fear gauge, finished near an all-time closing low and extended its downward journey for the third consecutive session on Thursday, maintaining a comfort zone for the bulls.
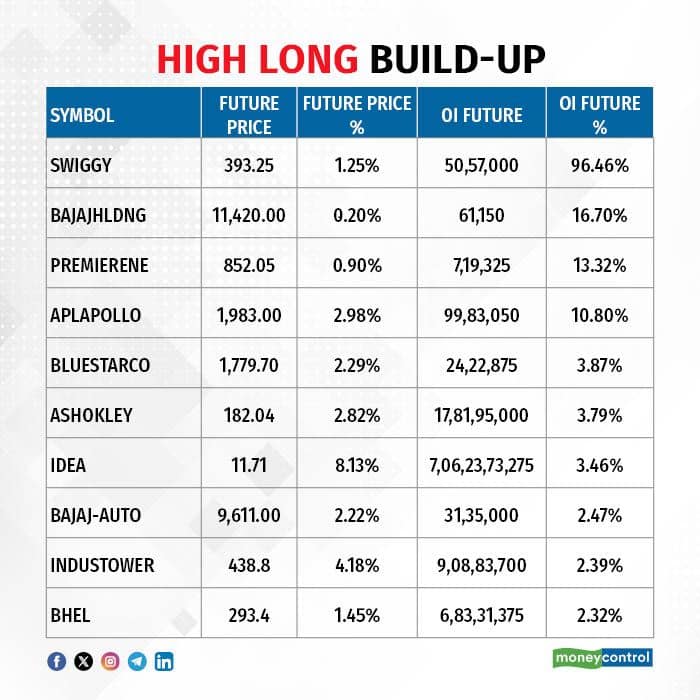
A long build-up was seen in 85 stocks. An increase in open interest (OI) and price indicates a build-up of long positions.
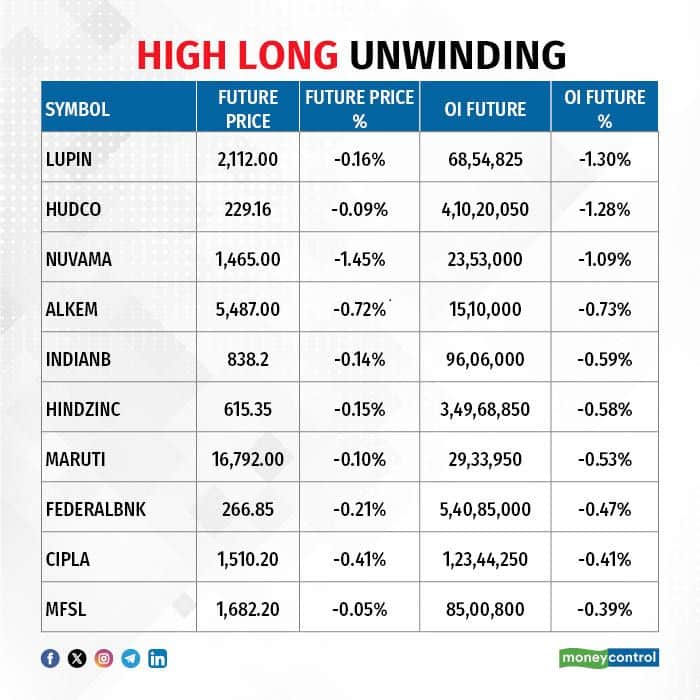
11) Long Unwinding (18 Stocks)
18 stocks saw a decline in open interest (OI) along with a fall in price, indicating long unwinding.
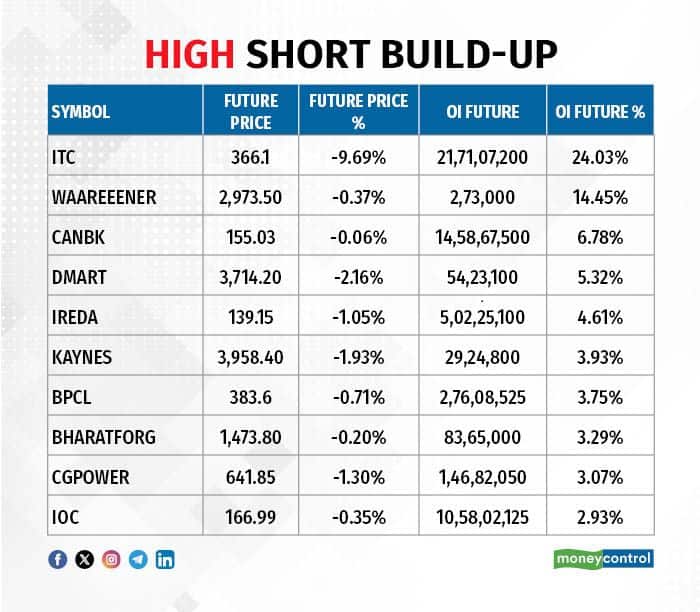
12) Short Build-up (60 Stocks)
60 stocks saw an increase in OI along with a fall in price, indicating a build-up of short positions.
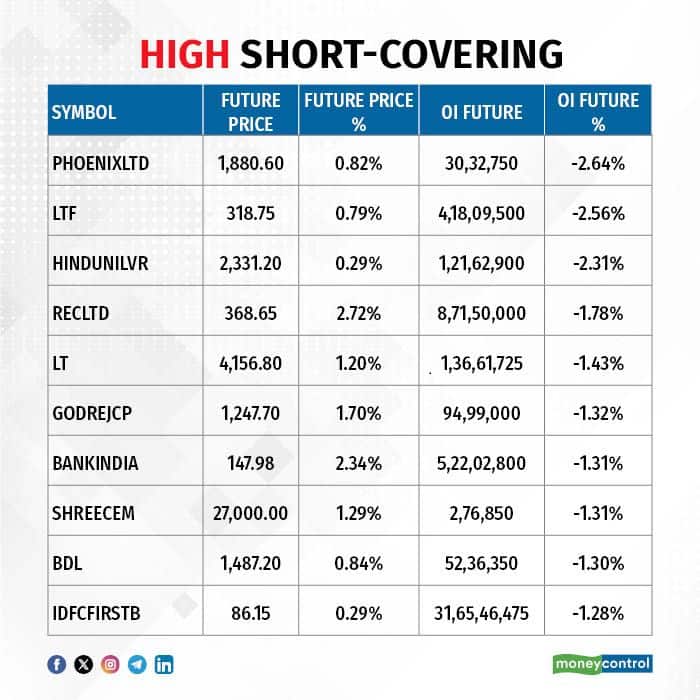
13) Short-Covering (46 Stocks)
46 stocks saw short-covering, meaning a decrease in OI, along with a price increase.
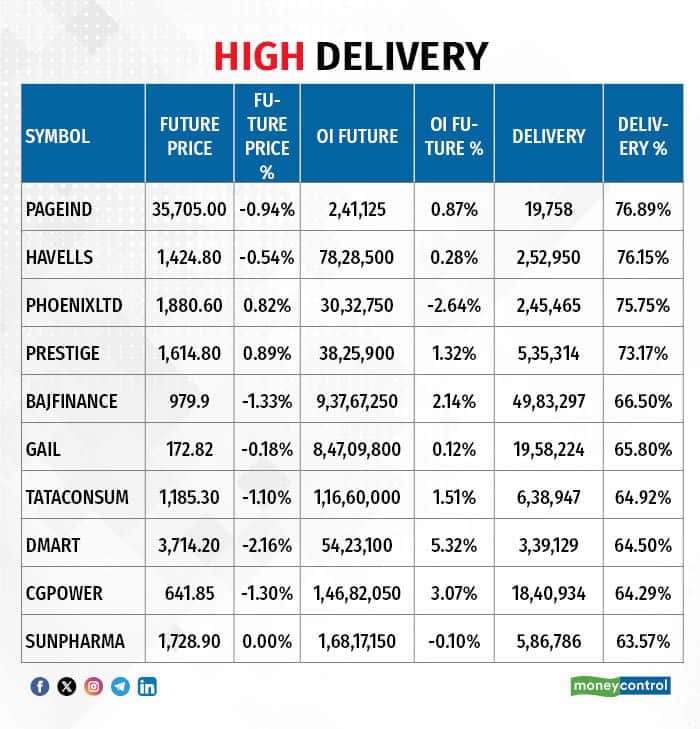
Here are the stocks that saw a high share of delivery trades. A high share of delivery reflects investing (as opposed to trading) interest in a stock.
Securities banned under the F&O segment include companies where derivative contracts cross 95 percent of the market-wide position limit.
Stocks added to F&O ban: SAIL
Stocks retained in F&O ban: Nil
Stocks removed from F&O ban: Nil
Disclaimer: The views and investment tips expressed by experts on Moneycontrol are their own and not those of the website or its management. Moneycontrol advises users to check with certified experts before taking any investment decisions.Disclaimer: Moneycontrol is a part of the Network18 group. Network18 is controlled by Independent Media Trust, of which Reliance Industries is the sole beneficiary.Discover the latest Business News, Sensex, and Nifty updates. Obtain Personal Finance insights, tax queries, and expert opinions on Moneycontrol or download the Moneycontrol App to stay updated!
Find the best of Al News in one place, specially curated for you every weekend.
Stay on top of the latest tech trends and biggest startup news.


