


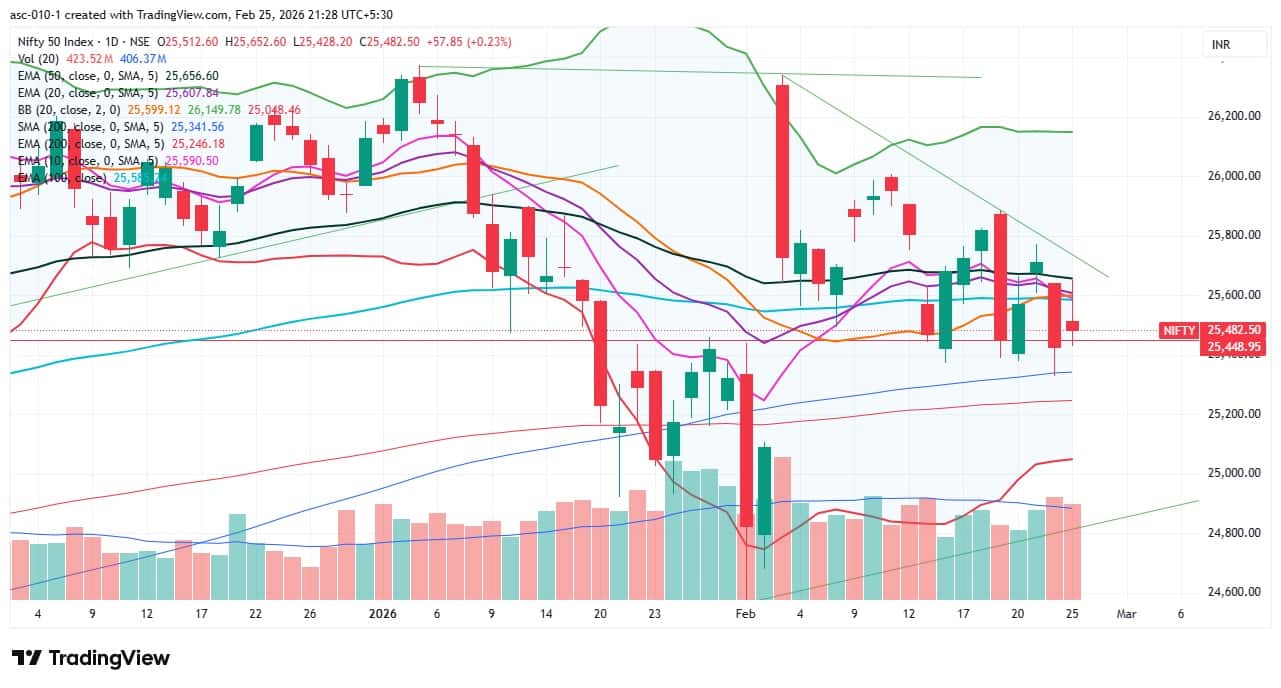
The Nifty 50 rebounded after a day of steep losses but shed 170 points from the day’s high to end with gains of 58 points on February 25, indicating selling pressure during the bounce. The index failed to hold above key moving averages, while momentum indicators continued to maintain bearish crossovers. Hence, consolidation with range-bound trading is expected to persist in the short term until the index decisively breaks out of the 25,300–25,900 range on either side. In the immediate term, the index needs to reclaim and sustain above 25,700 to trigger an upward rally. However, the 25,400 level is likely to act as a support zone, followed by 25,300 as the crucial support, experts said.
Here are 15 data points we have collated to help you spot profitable trades:
1) Key Levels For The Nifty 50 (25,482)
Resistance based on pivot points: 25,607, 25,660, and 25,746
Support based on pivot points: 25,435, 25,382, and 25,297
Special Formation: The Nifty 50 formed a small bearish candle with a long upper shadow on the daily timeframe, indicating a lack of strength in the bounce-back. The index failed in its attempt to hold above key moving averages (20-, 50-, and 100-day EMAs). The RSI, though moving higher to 46.77, remained below the signal line. The MACD stayed below both the zero line and the signal line, with a further decline in the histogram. All these indicators suggest weak underlying momentum.
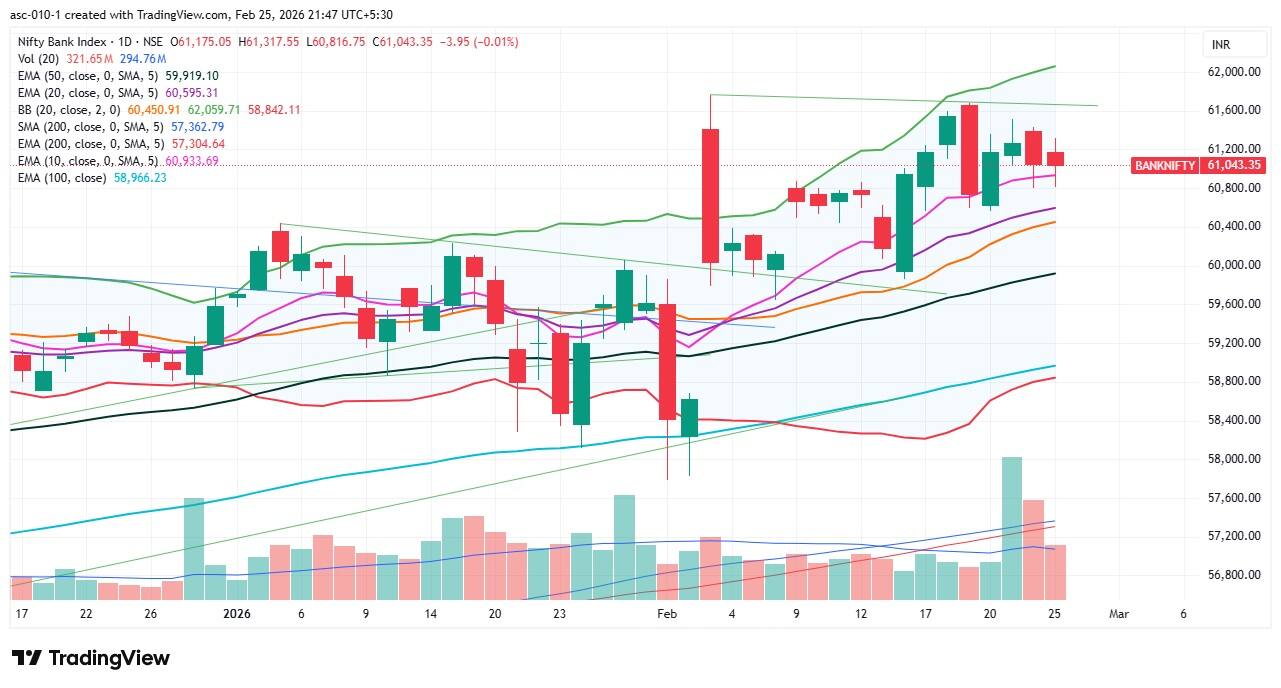
2) Key Levels For The Bank Nifty (61,043)
Resistance based on pivot points: 61,251, 61,369, and 61,560
Support based on pivot points: 60,868, 60,750, and 60,558
Resistance based on Fibonacci retracement: 62,077, 64,732
Support based on Fibonacci retracement: 60,825, 60,244
Special Formation: The Bank Nifty formed a small-bodied red candle with upper and lower shadows within the previous day’s range on the daily timeframe and ended flat with a negative bias, indicating range-bound action. The index continued to hold above all key moving averages; however, the momentum indicators reflected a sideways trend. The RSI remained below the reference mark at 57.09, while the gap between the MACD and the signal line narrowed further, with the MACD sloping downward. The Stochastic RSI has sustained below the reference line for a week. All these signals indicate a pause in bullish momentum.
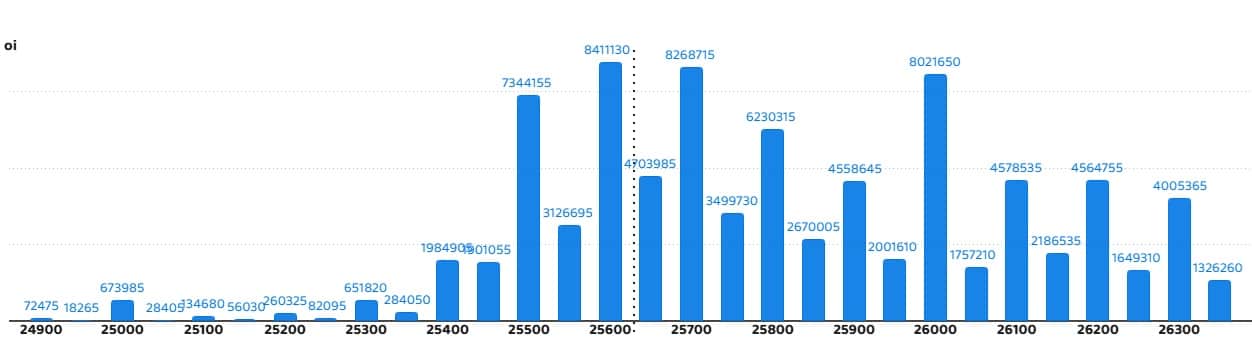
According to the weekly options data, the 25,600 strike holds the maximum Call open interest (with 84.11 lakh contracts). This level can act as a key resistance level for the Nifty in the short term. It was followed by the 25,700 strike (82.68 lakh contracts) and 26,000 strike (80.21 lakh contracts).
Maximum Call writing was observed at the 25,600 strike, which saw an addition of 41.7 lakh contracts, followed by the 25,700 and 25,650 strikes, which added 36 lakh and 33.3 lakh contracts, respectively. The maximum Call unwinding was seen at the 25,400 strike, which shed 5.56 lakh contracts, followed by the 25,100 and 25,000 strikes, which shed 34,905 and 10,530 contracts, respectively.
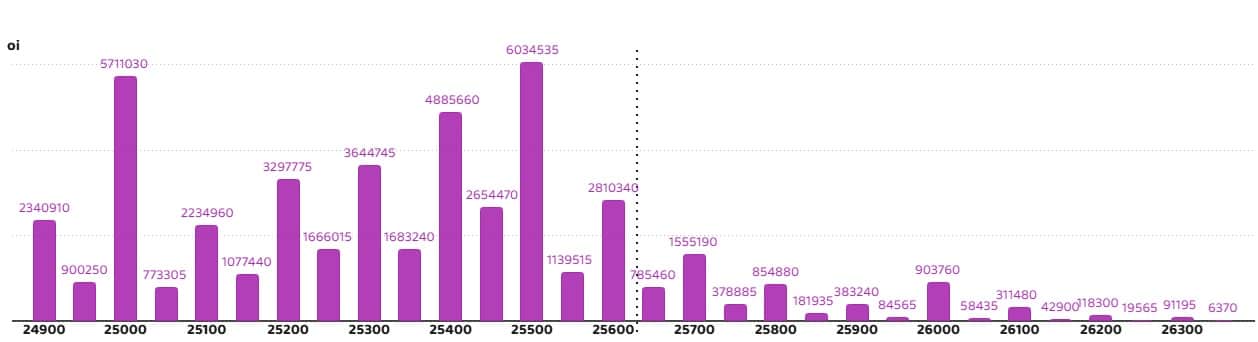
On the Put side, the maximum Put open interest was seen at the 25,500 strike (with 60.34 lakh contracts), which can act as a key support level for the Nifty in the short term. It was followed by the 25,000 strike (57.11 lakh contracts) and the 25,400 strike (48.85 lakh contracts).
The maximum Put writing was placed at the 25,500 strike, which saw an addition of 19.98 lakh contracts, followed by the 25,400 and 25,450 strikes, which added 18.37 lakh and 17.92 lakh contracts, respectively. The maximum Put unwinding was seen at the 25,900 strike, which shed 59,800 contracts, followed by the 26,100 and 26,000 strikes, which shed 50,050 and 34,580 contracts, respectively.
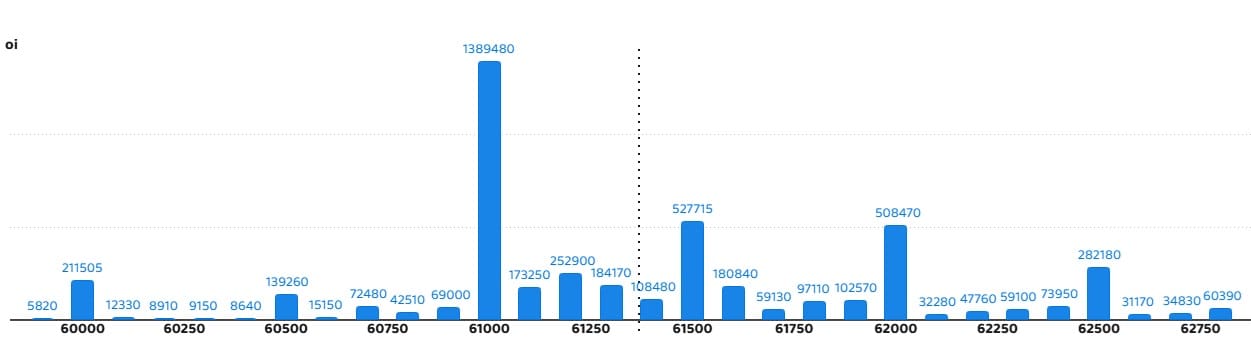
5) Bank Nifty Call Options Data
According to the monthly options data, the 61,000 strike holds the maximum Call open interest, with 13.89 lakh contracts. This can act as a key level for the index in the short term. It was followed by the 61,500 strike (5.27 lakh contracts) and the 62,000 strike (5.08 lakh contracts).
Maximum Call writing was observed at the 61,600 strike (with the addition of 1.339 lakh contracts), followed by the 61,200 strike (1.332 lakh contracts) and 61,500 strike (93,775 contracts). There was hardly any Call unwinding seen in the 60,000-62,750 strike band.
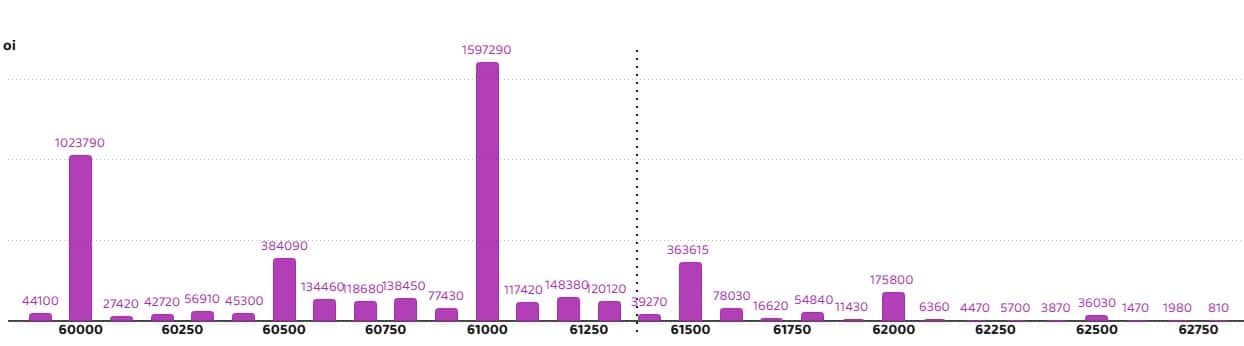
6) Bank Nifty Put Options Data
On the Put side, the maximum Put open interest was seen at the 61,000 strike (with 15.97 lakh contracts), which can act as a key level for the index. This was followed by the 60,000 strike (10.23 lakh contracts) and the 60,500 strike (3.84 lakh contracts).
The maximum Put writing was placed at the 60,000 strike (which added 1.42 lakh contracts), followed by the 60,600 strike (87,840 contracts) and the 60,500 strike (80,340 contracts). There was hardly any Put unwinding seen in the 60,000-62,750 strike band.
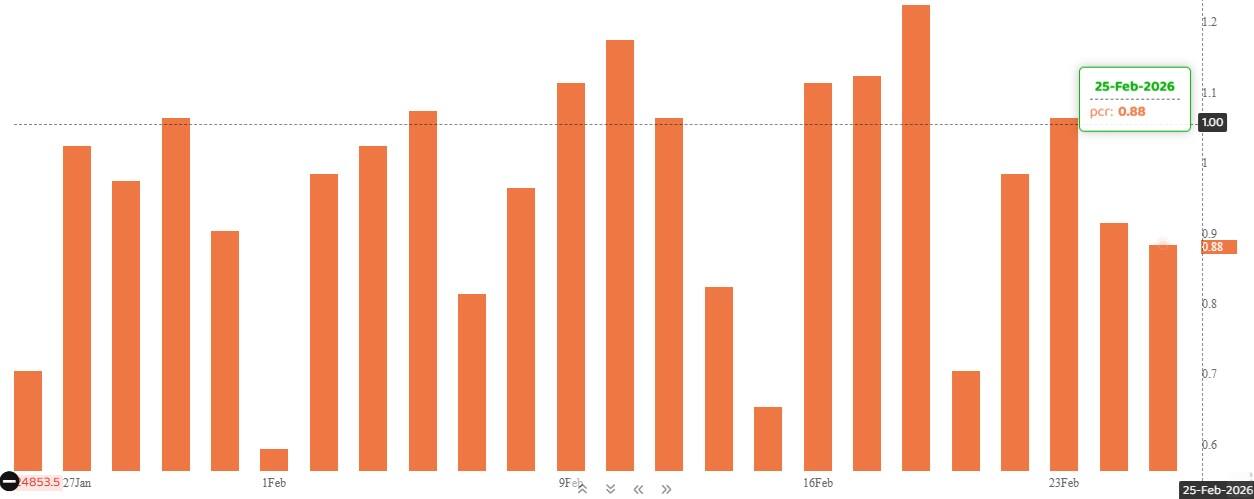
The Nifty Put-Call ratio (PCR), which indicates the mood of the market, declined to 0.88 on February 25, compared to 0.91 in the previous session.
The increasing PCR, or being higher than 0.7 or surpassing 1, means traders are selling more Put options than Call options, which generally indicates the firming up of a bullish sentiment in the market. If the ratio falls below 0.7 or moves towards 0.5, then it indicates selling in Calls is higher than selling in Puts, reflecting a bearish mood in the market.
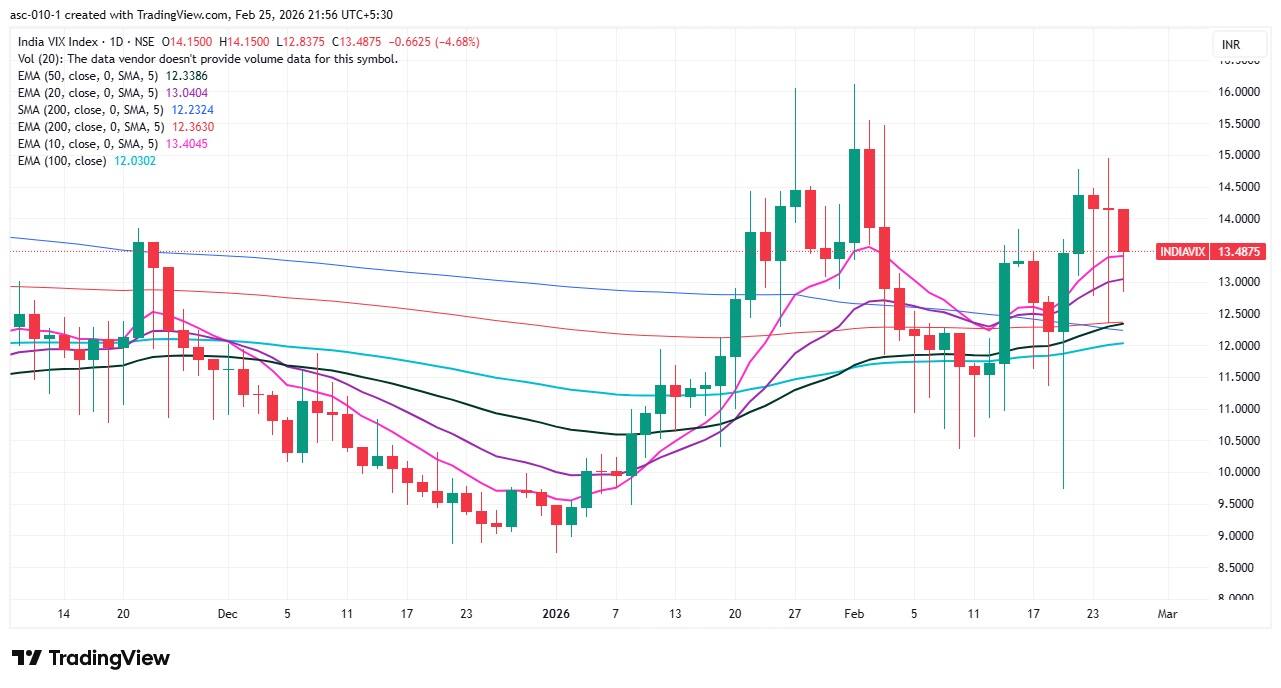
9) India VIX
The India VIX, which measures expected market volatility, extended its decline for the third straight session, falling 4.68 percent to 13.49. This signals some comfort for bulls, although it remains above all key moving averages. A decisive fall below the 12 zone is necessary to further ease concerns for bullish participants.
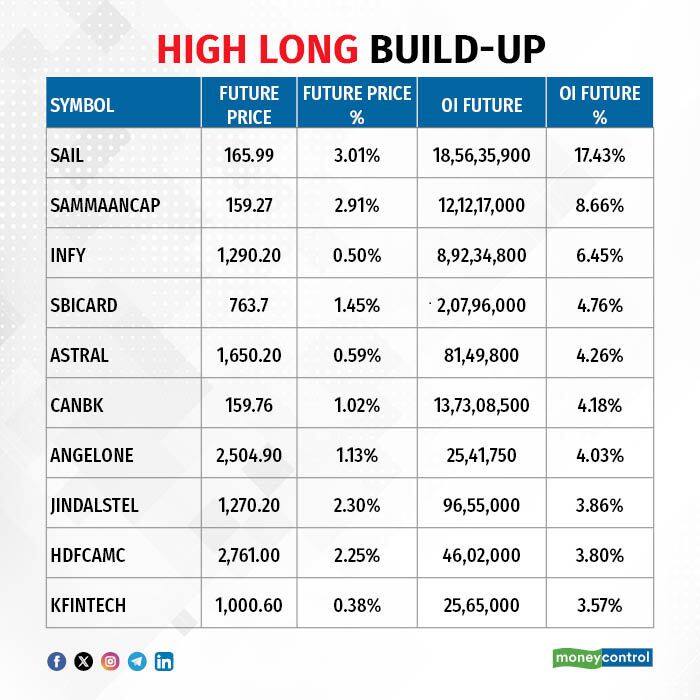
A long build-up was seen in 96 stocks. An increase in open interest (OI) and price indicates a build-up of long positions.
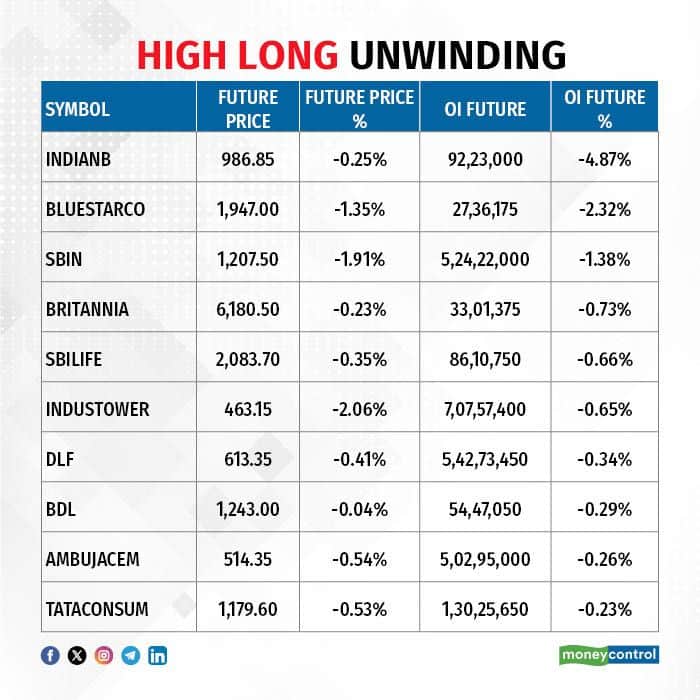
11) Long Unwinding (13 Stocks)
13 stocks saw a decline in open interest (OI) along with a fall in price, indicating long unwinding.
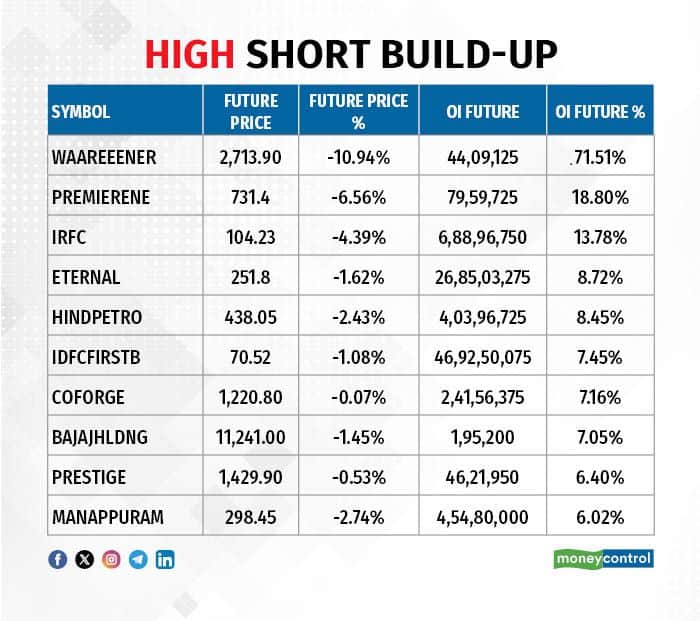
12) Short Build-up (50 Stocks)
50 stocks saw an increase in OI along with a fall in price, indicating a build-up of short positions.
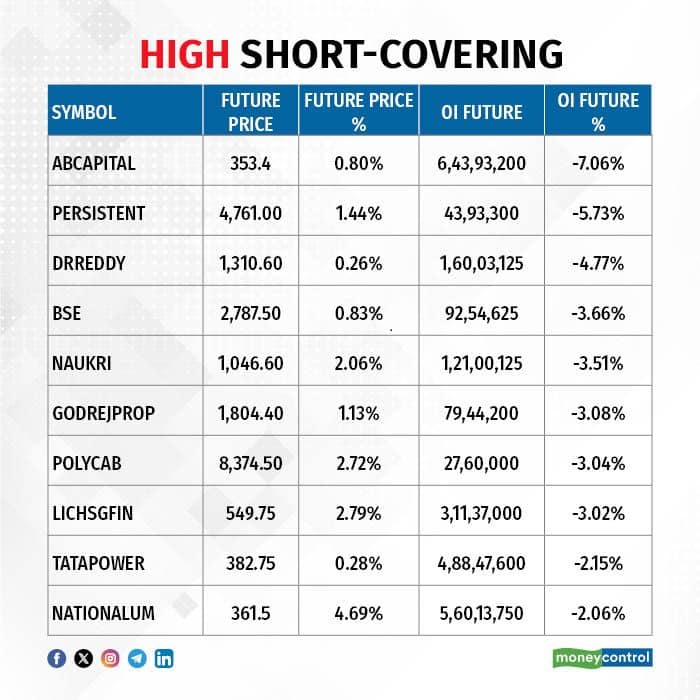
13) Short-Covering (51 Stocks)
51 stocks saw short-covering, meaning a decrease in OI, along with a price increase.
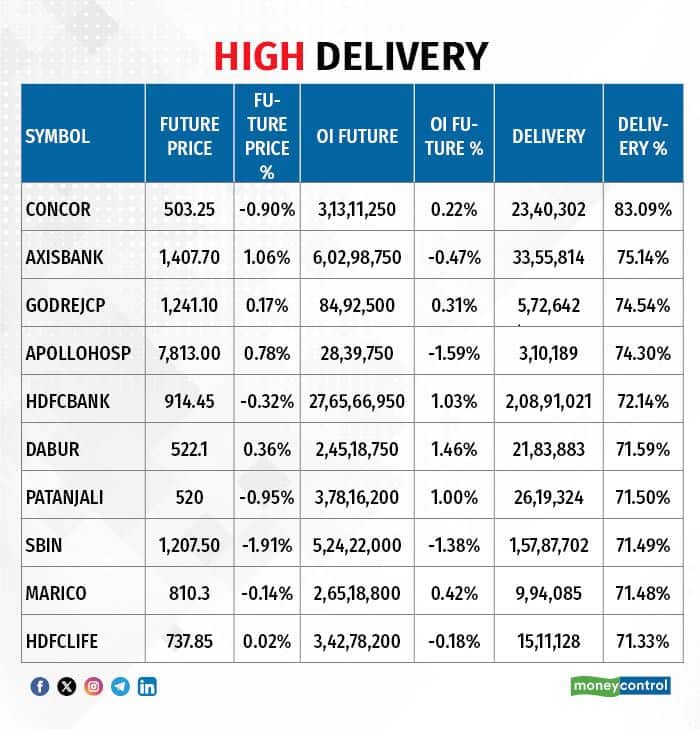
Here are the stocks that saw a high share of delivery trades. A high share of delivery reflects investing (as opposed to trading) interest in a stock.
Securities banned under the F&O segment include companies where derivative contracts cross 95 percent of the market-wide position limit.
Stocks added to F&O ban: Sammaan Capital
Stocks retained in F&O ban: Nil
Stocks removed from F&O ban: Nil
Disclaimer: The views and investment tips expressed by experts on Moneycontrol are their own and not those of the website or its management. Moneycontrol advises users to check with certified experts before taking any investment decisions.Disclaimer: Moneycontrol is a part of the Network18 group. Network18 is controlled by Independent Media Trust, of which Reliance Industries is the sole beneficiary.Discover the latest Business News, Sensex, and Nifty updates. Obtain Personal Finance insights, tax queries, and expert opinions on Moneycontrol or download the Moneycontrol App to stay updated!
Find the best of Al News in one place, specially curated for you every weekend.
Stay on top of the latest tech trends and biggest startup news.


