


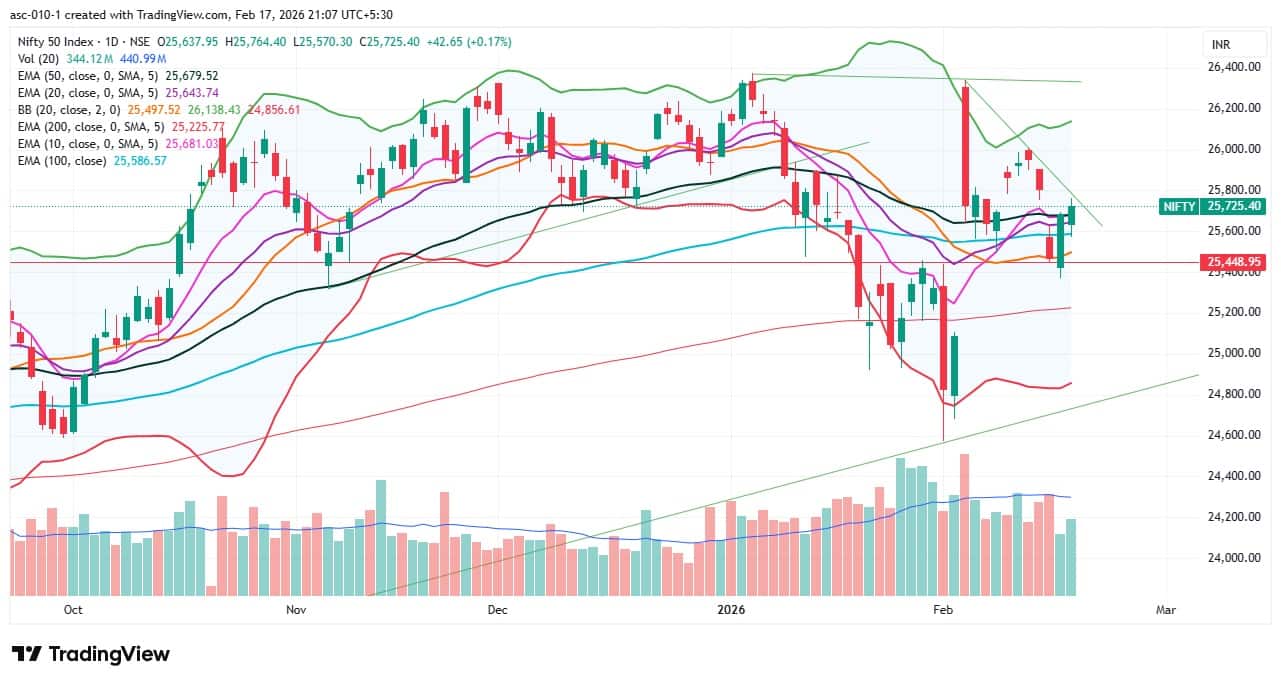
The Nifty 50 extended its upward journey for the second consecutive session, closing 0.17 percent higher on February 17 and sustaining above all key moving averages. The index moved closer to the falling resistance trendline and attempted to close the bearish gap of February 13 by hitting an intraday high of 25,764. Meanwhile, the RSI sustained above the 50 zone and the VIX fell sharply. Hence, if the index manages to close and sustain above 25,750, a rally toward the 25,900–26,000 levels cannot be ruled out in the upcoming sessions. However, 25,600 is expected to act as immediate support, followed by 25,500 as a crucial support level, according to experts.
Here are 15 data points we have collated to help you spot profitable trades:
1) Key Levels For The Nifty 50 (25,725)
Resistance based on pivot points: 25,761, 25,807, and 25,881
Support based on pivot points: 25,613, 25,567, and 25,493
Special Formation: The Nifty 50 formed a bullish candle with upper and lower shadows on the daily timeframe, indicating a positive mood amid volatility. The index sustained above all key moving averages and closed above the previous day’s high. The RSI climbed to 51.81 with a positive crossover, while the MACD continued to sustain above the signal line and the zero line, though the histogram signalled further fading momentum. All these indicators suggest a cautiously positive undertone, despite some moderation in momentum.
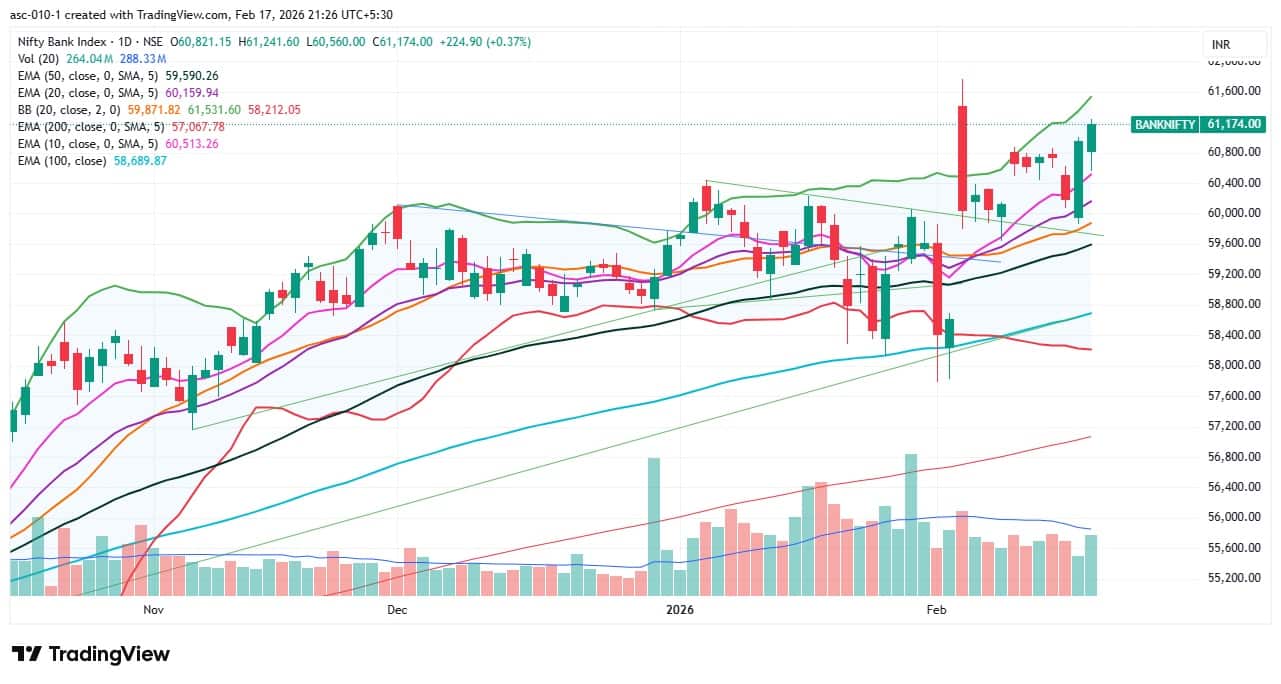
2) Key Levels For The Bank Nifty (61,174)
Resistance based on pivot points: 61,252, 61,413, and 61,673
Support based on pivot points: 60,731, 60,571, and 60,310
Resistance based on Fibonacci retracement: 62,077, 64,731
Support based on Fibonacci retracement: 60,677, 60,000
Special Formation: The Bank Nifty also formed a bullish candle with a lower shadow on the daily charts, indicating a positive bias with buying interest at lower levels. The banking index closed above the previous day’s high and held well above all key moving averages (10, 20, 50, and 100 EMAs). In fact, all these moving averages are trending upward. The index is marching closer to the upper Bollinger Band, while the RSI jumped to 62.12, signalling strengthening momentum. The MACD sustained above the signal line with the histogram rising further, while the Stochastic RSI is on the verge of a breakout. All these indicators point toward strengthening bullish momentum in the banking space.
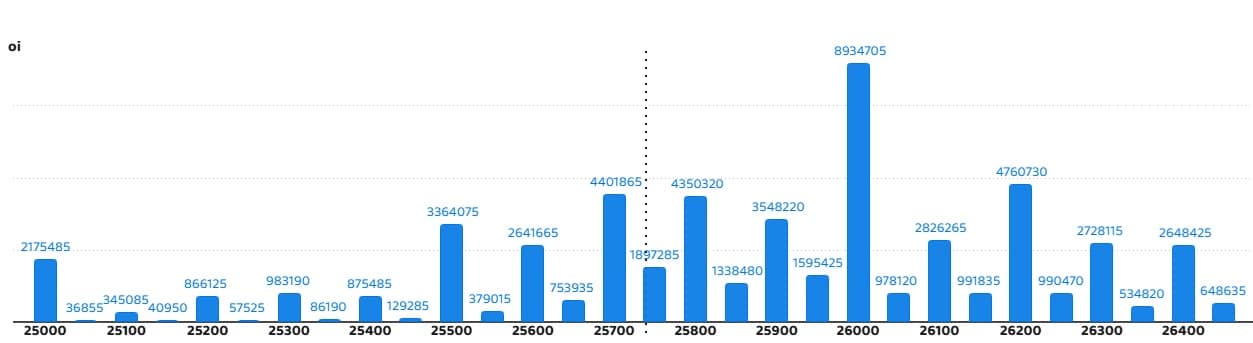
According to the monthly options data, the 26,000 strike holds the maximum Call open interest (with 89.34 lakh contracts). This level can act as a key resistance level for the Nifty in the short term. It was followed by the 26,200 strike (47.6 lakh contracts) and 25,700 strike (44.01 lakh contracts).
Maximum Call writing was observed at the 26,200 strike, which saw an addition of 23.7 lakh contracts, followed by the 26,000 and 25,700 strikes, which added 16.23 lakh and 14.49 lakh contracts, respectively. The maximum Call unwinding was seen at the 25,300 strike which shed 60,515 contracts, followed by the 25,550 and 25,450 strikes, which shed 30,550 and 11,310 contracts, respectively.
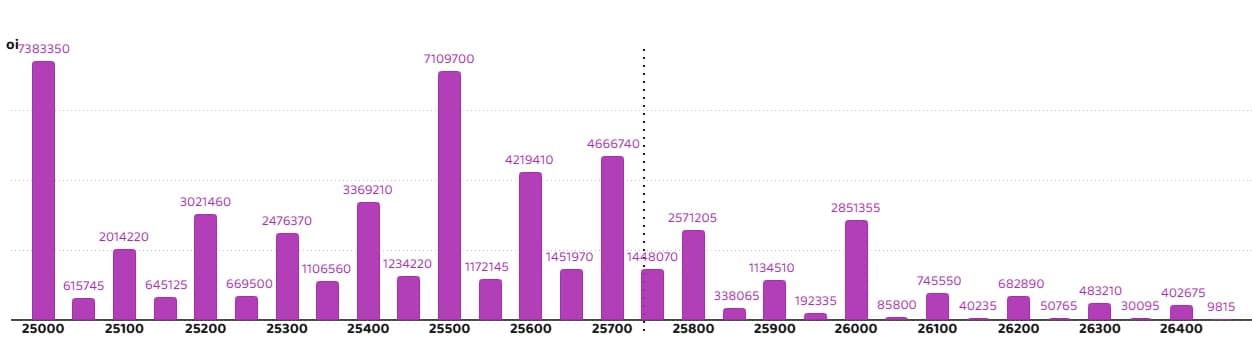
On the Put side, the maximum Put open interest was seen at the 25,000 strike (with 73.83 lakh contracts), which can act as a key support level for the Nifty in the short term. It was followed by the 25,500 strike (71.09 lakh contracts) and the 25,700 strike (46.66 lakh contracts).
The maximum Put writing was placed at the 25,700 strike, which saw an addition of 19.73 lakh contracts, followed by the 25,600 and 25,750 strikes, which added 12.3 lakh and 10.27 lakh contracts, respectively. The maximum Put unwinding was seen at the 25,300 strike, which shed 33,020 contracts, followed by the 26,400 and 26,150 strikes, which shed 10,140 and 6,695 contracts, respectively.
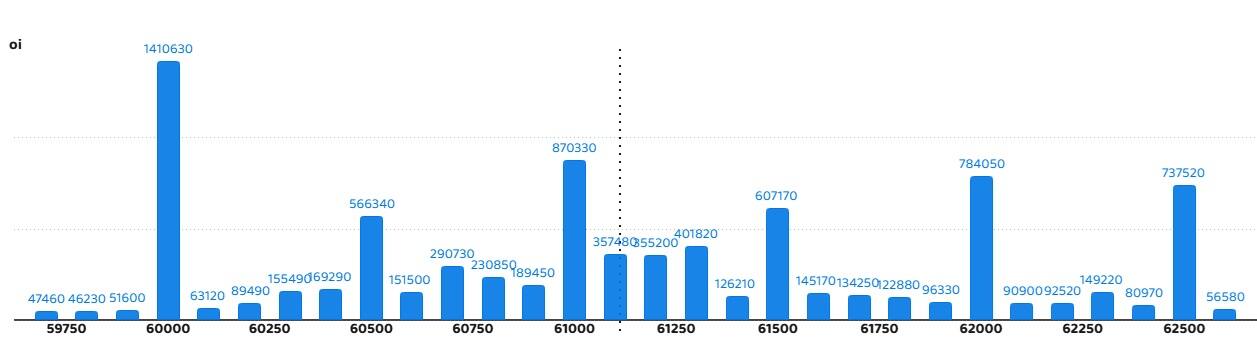
5) Bank Nifty Call Options Data
According to the monthly options data, the 60,000 strike holds the maximum Call open interest, with 14.1 lakh contracts. This can act as a key level for the index in the short term. It was followed by the 61,000 strike (8.7 lakh contracts) and the 62,000 strike (7.84 lakh contracts).
Maximum Call writing was observed at the 61,100 strike (with the addition of 2.41 lakh contracts), followed by the 61,200 strike (1.93 lakh contracts) and 62,500 strike (61,350 contracts). The maximum Call unwinding was seen at the 60,800 strike, which shed 1.56 lakh contracts, followed by the 60,500 and 60,900 strikes which shed 1.08 lakh and 78,330 contracts, respectively.
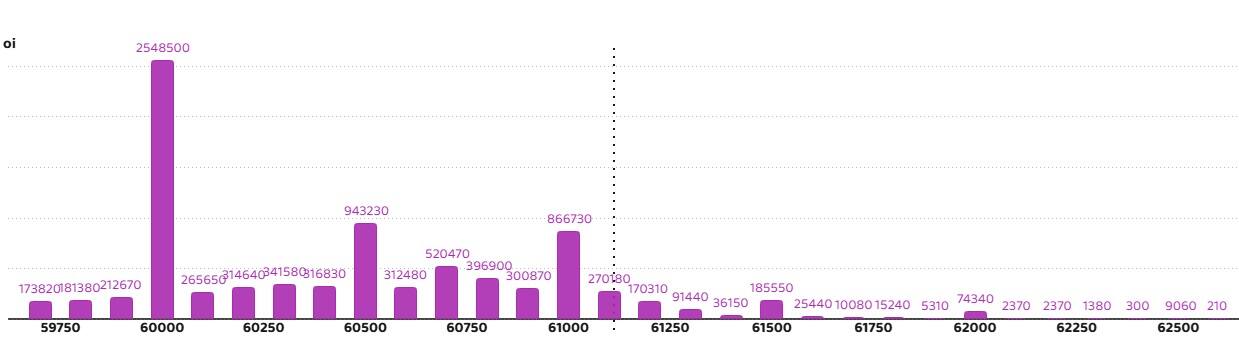
6) Bank Nifty Put Options Data
On the Put side, the maximum Put open interest was seen at the 60,000 strike (with 25.48 lakh contracts), which can act as a key support level for the index. This was followed by the 60,500 strike (9.43 lakh contracts) and the 61,000 strike (8.66 lakh contracts).
The maximum Put writing was placed at the 60,000 strike (which added 3.68 lakh contracts), followed by the 61,000 strike (2.84 lakh contracts) and the 61,100 strike (2.06 lakh contracts). The maximum Put unwinding was seen at the 60,800 strike, which shed 40,290 contracts, followed by the 59,800 and 62,000 strikes, which shed 15,420 and 1,380 contracts, respectively.
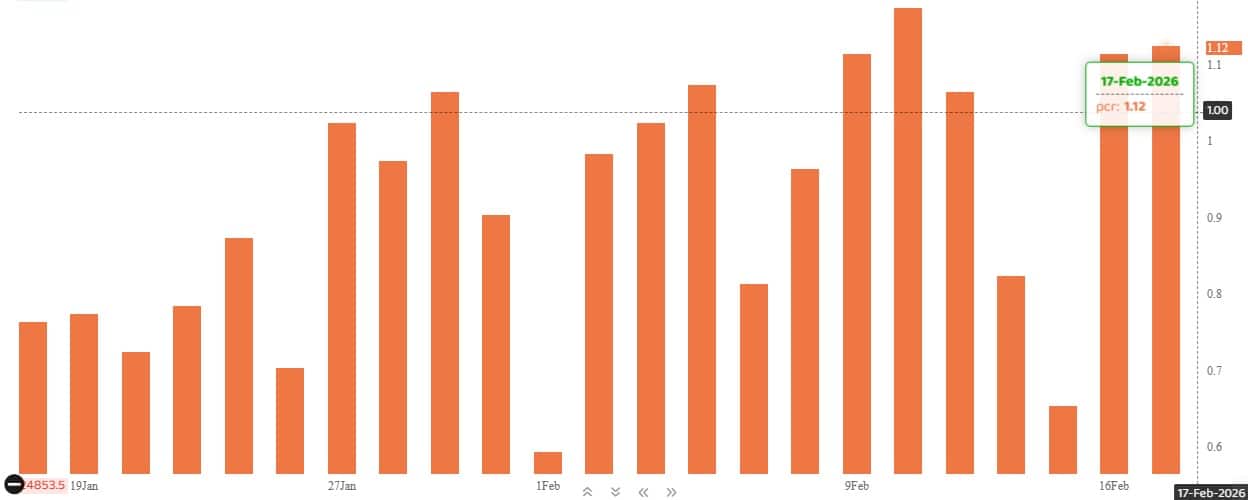
The Nifty Put-Call ratio (PCR), which indicates the mood of the market, climbed to 1.12 on February 17, compared to 1.11 in the previous session.
The increasing PCR, or being higher than 0.7 or surpassing 1, means traders are selling more Put options than Call options, which generally indicates the firming up of a bullish sentiment in the market. If the ratio falls below 0.7 or moves towards 0.5, then it indicates selling in Calls is higher than selling in Puts, reflecting a bearish mood in the market.
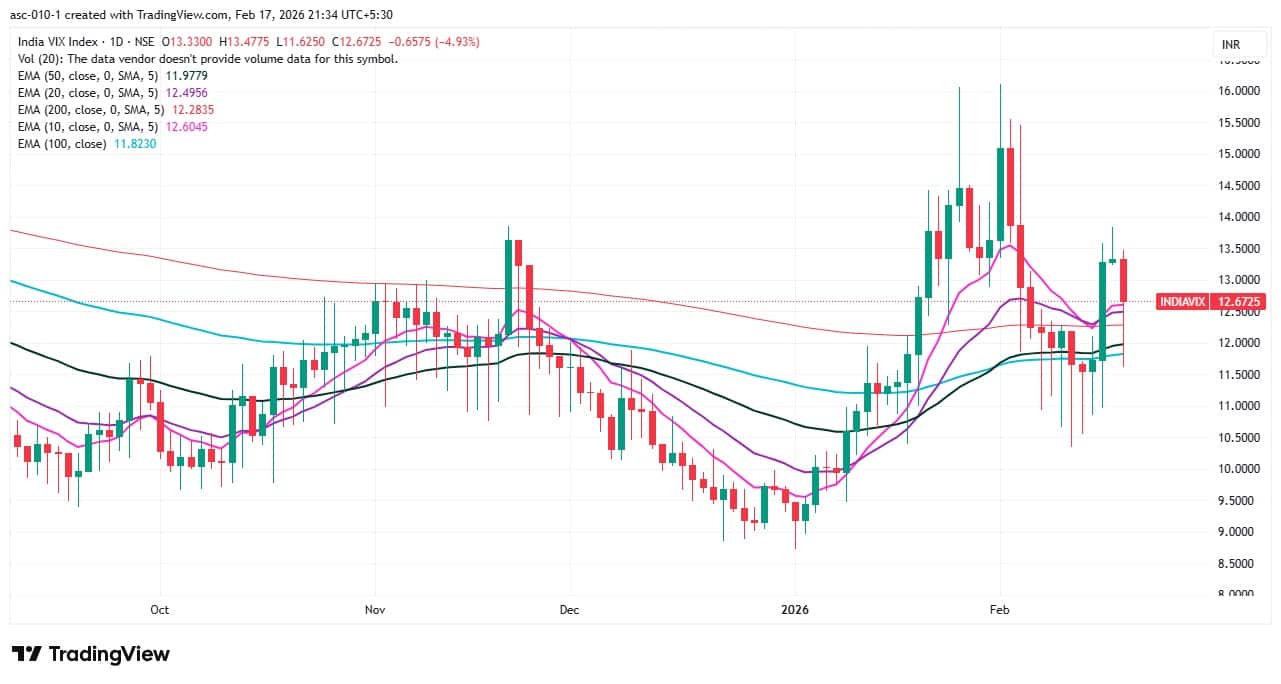
9) India VIX
The India VIX, also known as the fear index, fell 4.93 percent to 12.67 after a three-day winning streak, signalling some comfort for bulls. However, the index needs to decisively fall below the 12 zone or below all its key moving averages for bulls to enter a major comfort zone.
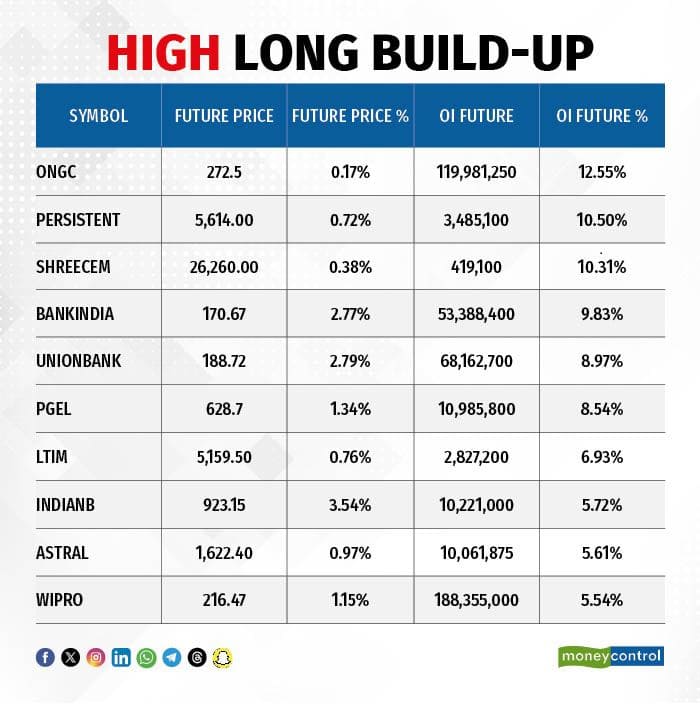
A long build-up was seen in 73 stocks. An increase in open interest (OI) and price indicates a build-up of long positions.
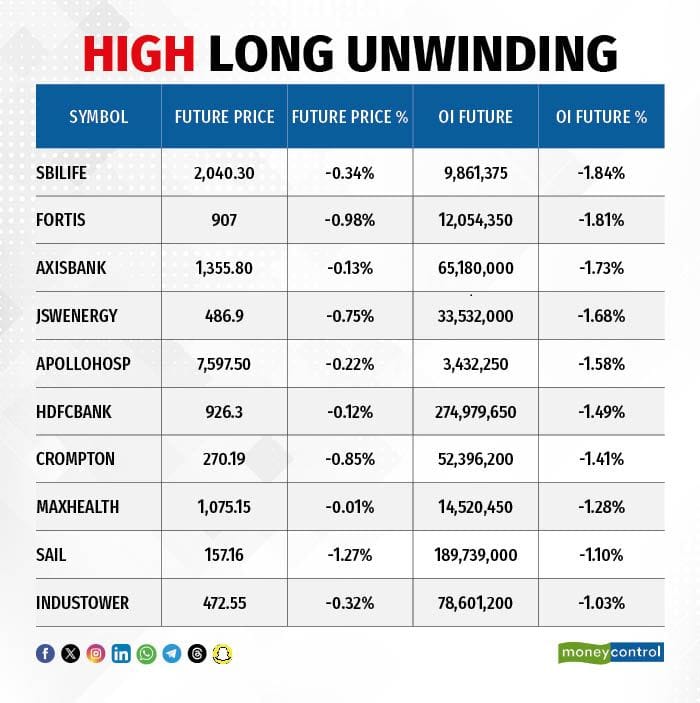
11) Long Unwinding (29 Stocks)
29 stocks saw a decline in open interest (OI) along with a fall in price, indicating long unwinding.
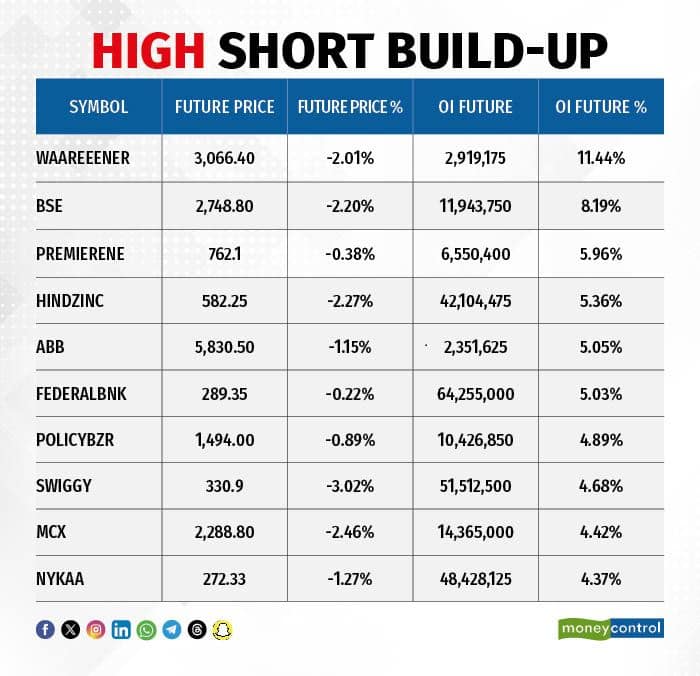
12) Short Build-up (65 Stocks)
65 stocks saw an increase in OI along with a fall in price, indicating a build-up of short positions.
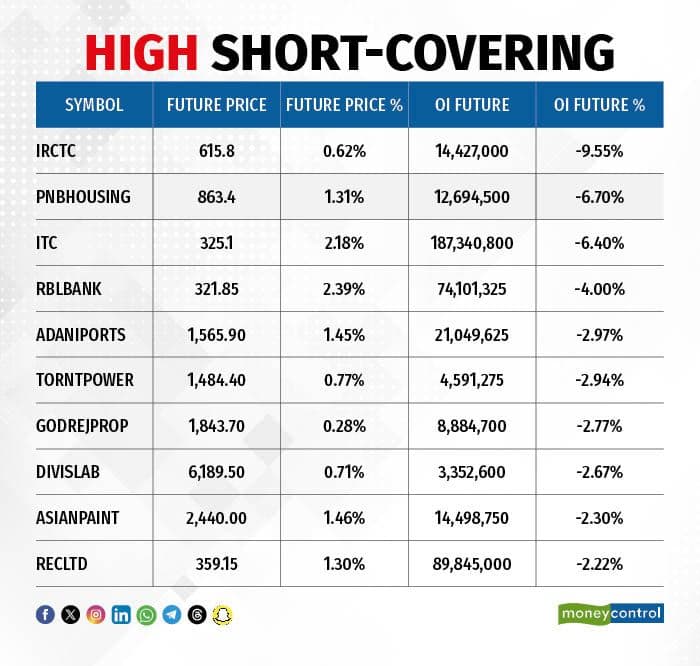
13) Short-Covering (44 Stocks)
44 stocks saw short-covering, meaning a decrease in OI, along with a price increase.
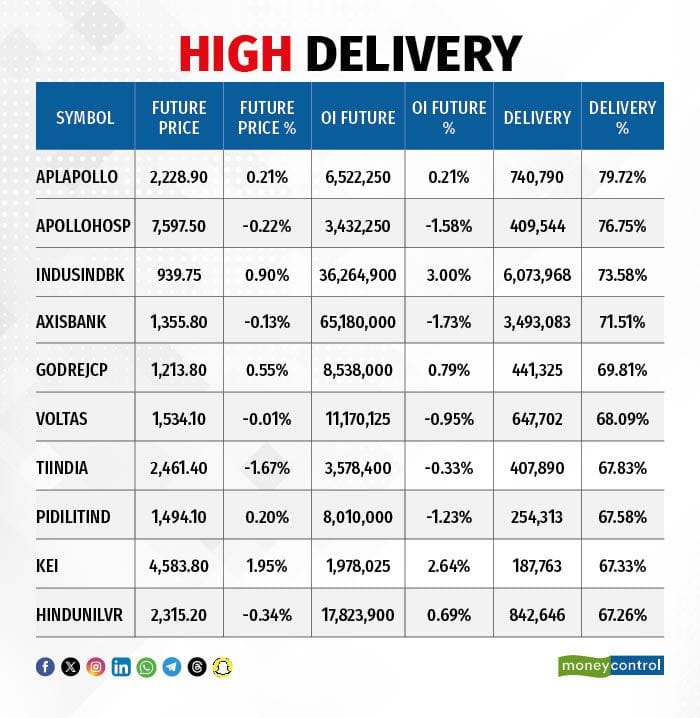
Here are the stocks that saw a high share of delivery trades. A high share of delivery reflects investing (as opposed to trading) interest in a stock.
Securities banned under the F&O segment include companies where derivative contracts cross 95 percent of the market-wide position limit.
Stocks added to F&O ban: Nil
Stocks retained in F&O ban: SAIL, Sammaan Capital
Stocks removed from F&O ban: Nil
Disclaimer: The views and investment tips expressed by experts on Moneycontrol are their own and not those of the website or its management. Moneycontrol advises users to check with certified experts before taking any investment decisions.Disclaimer: Moneycontrol is a part of the Network18 group. Network18 is controlled by Independent Media Trust, of which Reliance Industries is the sole beneficiary.Discover the latest Business News, Sensex, and Nifty updates. Obtain Personal Finance insights, tax queries, and expert opinions on Moneycontrol or download the Moneycontrol App to stay updated!
Find the best of Al News in one place, specially curated for you every weekend.
Stay on top of the latest tech trends and biggest startup news.


