


The Nifty 50 saw minor profit booking amid range-bound trading on January 30, especially after a three-day winning streak, as the market awaits the Union Budget scheduled for February 1. Volumes remained strong for the fourth consecutive session. Momentum still needs to strengthen, though it has gradually been improving over recent sessions. Strong momentum is possible only after the index convincingly surpasses the 25,650–25,700 zone. In the upcoming session, the index is expected to trade in the 24,900–25,500 range. A decisive move above this range could take the index toward 25,700, while a move below it could bring bears into action, experts said.
Here are 15 data points we have collated to help you spot profitable trades:
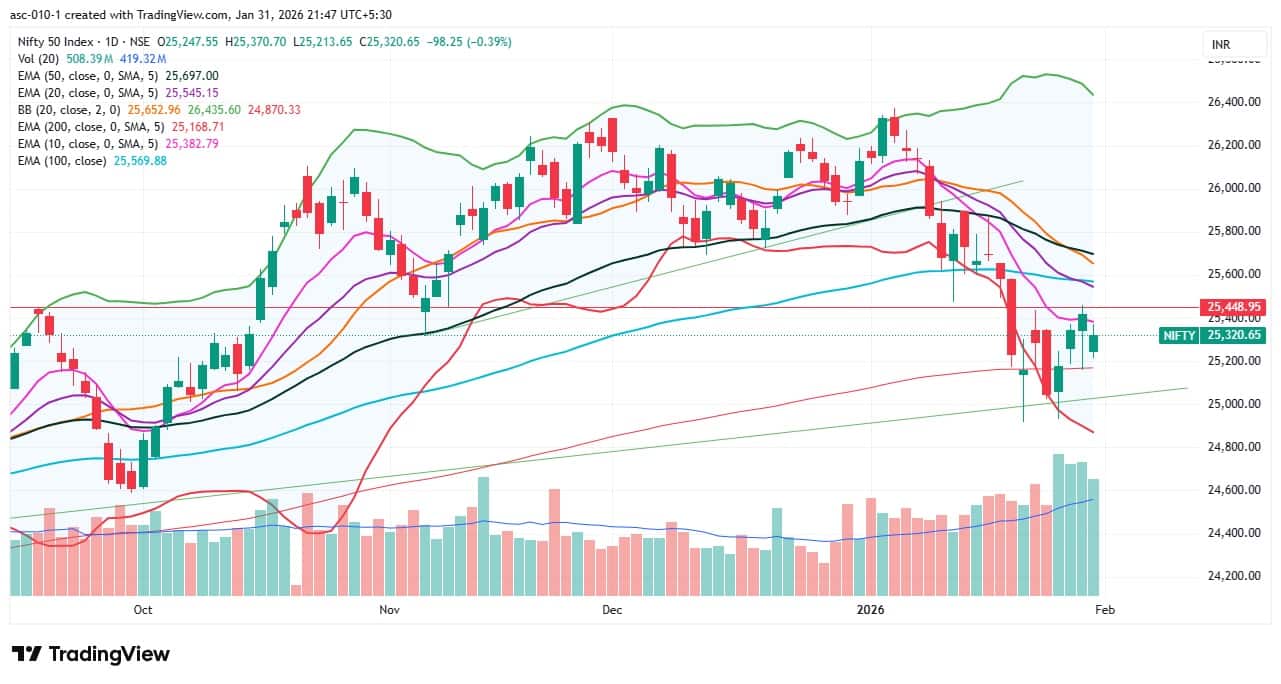
1) Key Levels For The Nifty 50 (25,321)
Resistance based on pivot points: 25,362, 25,399, and 25,459
Support based on pivot points: 25,242, 25,205, and 25,145
Special Formation: The Nifty 50 formed a bullish candle with minor upper and lower shadows on the daily charts, indicating consolidation near the resistance zone. The index could not sustain above the 10-day EMA and also remained below the 20-, 50-, and 100-day EMAs, though it stayed above the 200-day EMA for the fourth straight session. The RSI (40.59) trended downward but remained above the reference line. The Stochastic RSI continued its upward journey for more than a week, while the MACD stayed below the zero and signal lines, though weakness has consistently faded in the histogram. All these indicators suggest consolidation with gradual improvement in momentum, but confirmation is still awaited.
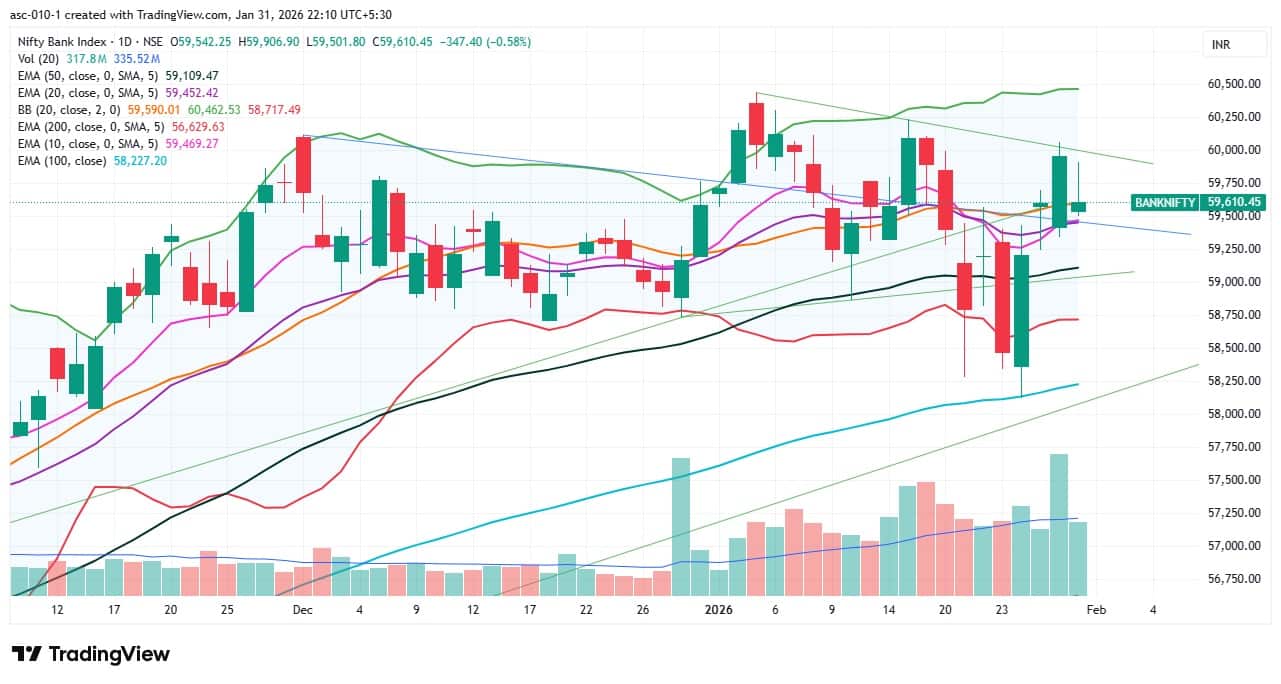
2) Key Levels For The Bank Nifty (59,610)
Resistance based on pivot points: 59,828, 59,923, and 60,078
Support based on pivot points: 59,518, 59,423, and 59,268
Resistance based on Fibonacci retracement: 59,941, 60,437
Support based on Fibonacci retracement: 58,820, 57,815
Special Formation: The Bank Nifty formed a small bullish candle with a long upper shadow (within the previous day’s long green candle) on the daily charts, signalling pressure at higher levels. However, the index sustained above all key moving averages and the midline of the Bollinger Bands, which is a positive sign. The RSI slipped to 52.24 but continued to hold above the signal line. The Stochastic RSI sustained its uptrend, while the MACD is on the verge of a bullish crossover with histogram weakness fading further. All these indicators point to underlying strength despite near-term resistance.
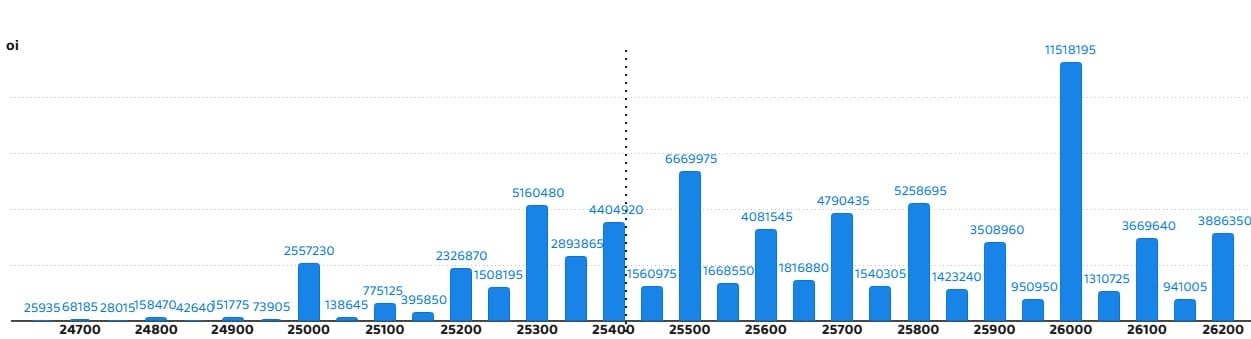
According to the weekly options data, the maximum Call open interest was seen at the 26,000 strike (with 1.15 crore contracts). This level can act as a key resistance level for the Nifty in the short term. It was followed by the 25,500 strike (66.69 lakh contracts) and 25,800 strike (52.58 lakh contracts).
Maximum Call writing was observed at the 26,000 strike, which saw an addition of 25.85 lakh contracts, followed by the 25,300 and 25,350 strikes, which added 19.91 lakh and 15.32 lakh contracts, respectively. The maximum Call unwinding was seen at the 25,450 strike, which shed 2.5 lakh contracts, followed by the 24,900 and 25,100 strikes, which shed 61,555 and 55,120 contracts, respectively.
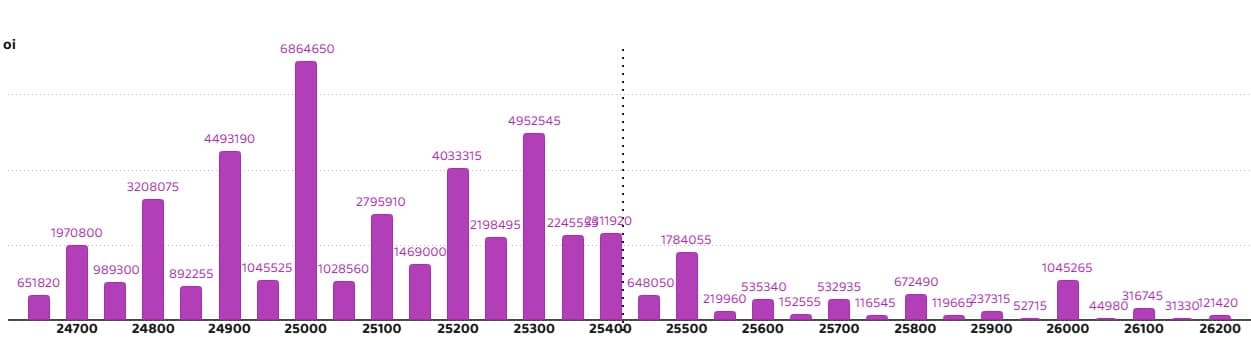
On the Put side, the 25,000 strike holds the maximum Put open interest (with 68.64 lakh contracts), which can act as a key support level for the Nifty in the short term. It was followed by the 25,300 strike (49.52 lakh contracts) and the 24,900 strike (44.93 lakh contracts).
The maximum Put writing was placed at the 24,900 strike, which saw an addition of 13.44 lakh contracts, followed by the 25,350 and 25,300 strikes, which added 4.91 lakh and 4.17 lakh contracts, respectively. The maximum Put unwinding was seen at the 25,400 strike, which shed 10.92 lakh contracts, followed by the 25,500 and 25,450 strikes, which shed 4.23 lakh and 4.2 lakh contracts, respectively.
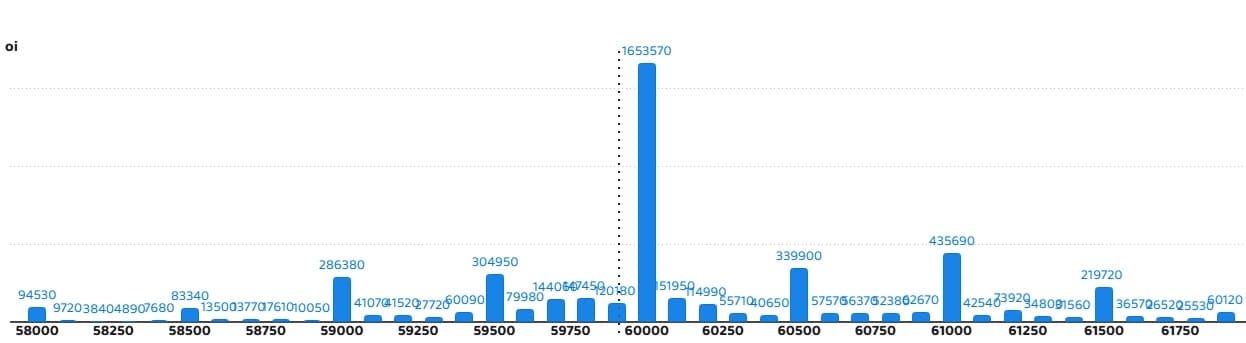
5) Bank Nifty Call Options Data
According to the monthly options data, the maximum Call open interest was seen at the 60,000 strike, with 16.53 lakh contracts. This can act as a key resistance level for the index in the short term. It was followed by the 61,000 strike (4.35 lakh contracts) and the 60,500 strike (3.39 lakh contracts).
Maximum Call writing was observed at the 60,500 strike (with the addition of 66,780 contracts), followed by the 61,200 strike (40,020 contracts) and 60,000 strike (35,460 contracts). The maximum Call unwinding was seen at the 61,900 strike, which shed 21,120 contracts, followed by the 61,300 and 59,000 strikes which shed 9,300 and 8,730 contracts, respectively.
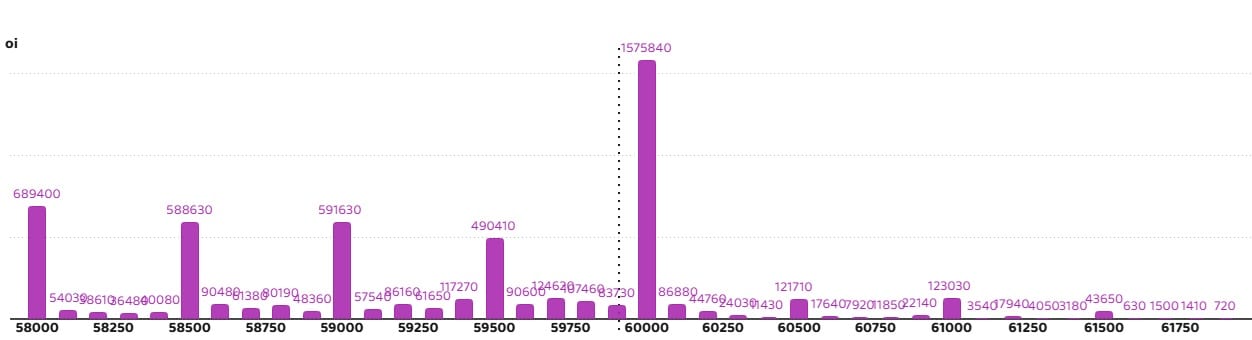
6) Bank Nifty Put Options Data
On the Put side, the 60,000 strike holds the maximum Put open interest (with 15.75 lakh contracts), which can act as a key level for the index. This was followed by the 58,000 strike (6.89 lakh contracts) and the 59,000 strike (5.91 lakh contracts).
The maximum Put writing was placed at the 58,600 strike (which added 37,260 contracts), followed by the 60,600 strike (12,450 contracts) and the 61,000 strike (3,900 contracts). The maximum Put unwinding was seen at the 59,000 strike, which shed 1.28 lakh contracts, followed by the 59,500 and 58,000 strikes, which shed 97,410 and 49,410 contracts, respectively.
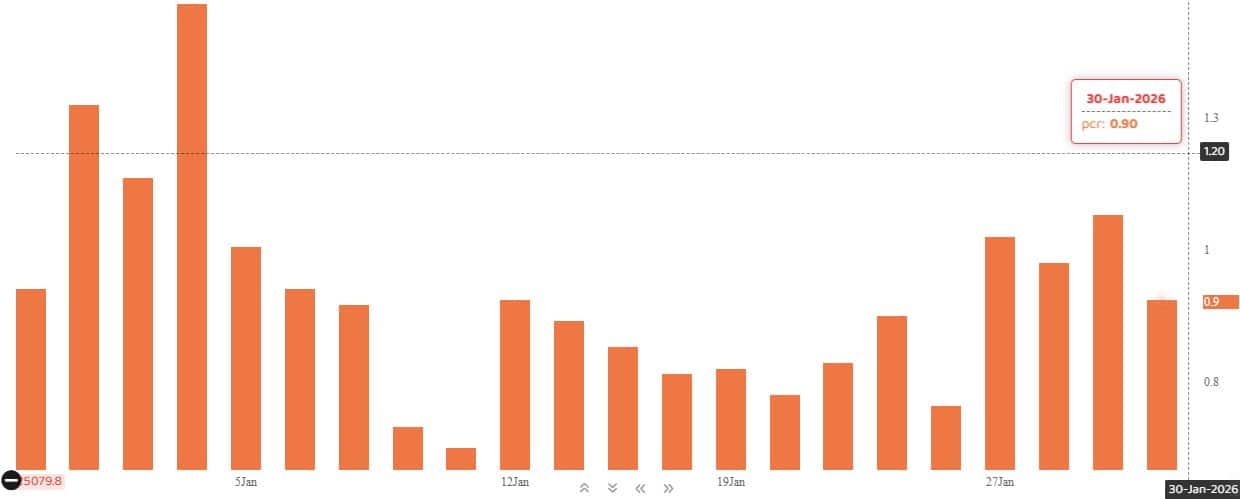
The Nifty Put-Call ratio (PCR), which indicates the mood of the market, fell to 0.9 on January 30, compared to 1.06 in the previous session.
The increasing PCR, or being higher than 0.7 or surpassing 1, means traders are selling more Put options than Call options, which generally indicates the firming up of a bullish sentiment in the market. If the ratio falls below 0.7 or moves towards 0.5, then it indicates selling in Calls is higher than selling in Puts, reflecting a bearish mood in the market.
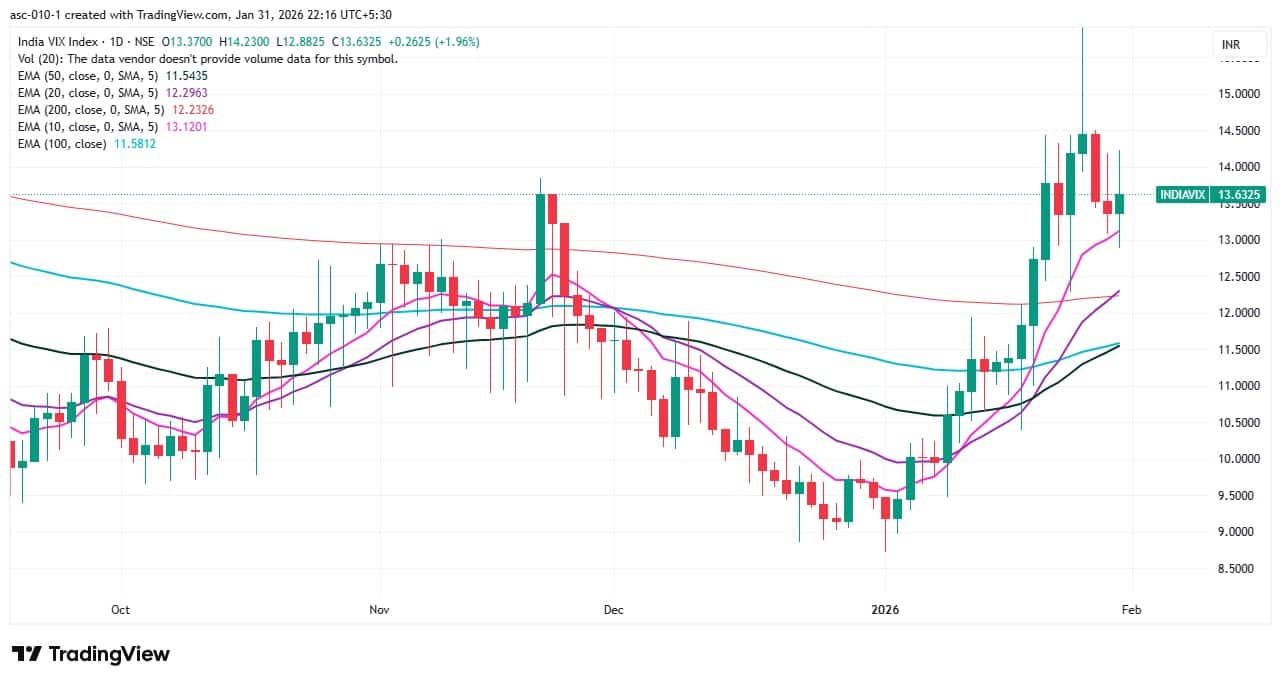
9) India VIX
The India VIX, which measures expected market volatility, climbed 1.96 percent to 13.63 after a two-day fall and remained well above all key moving averages, signalling sustained caution among bulls ahead of the Union Budget.
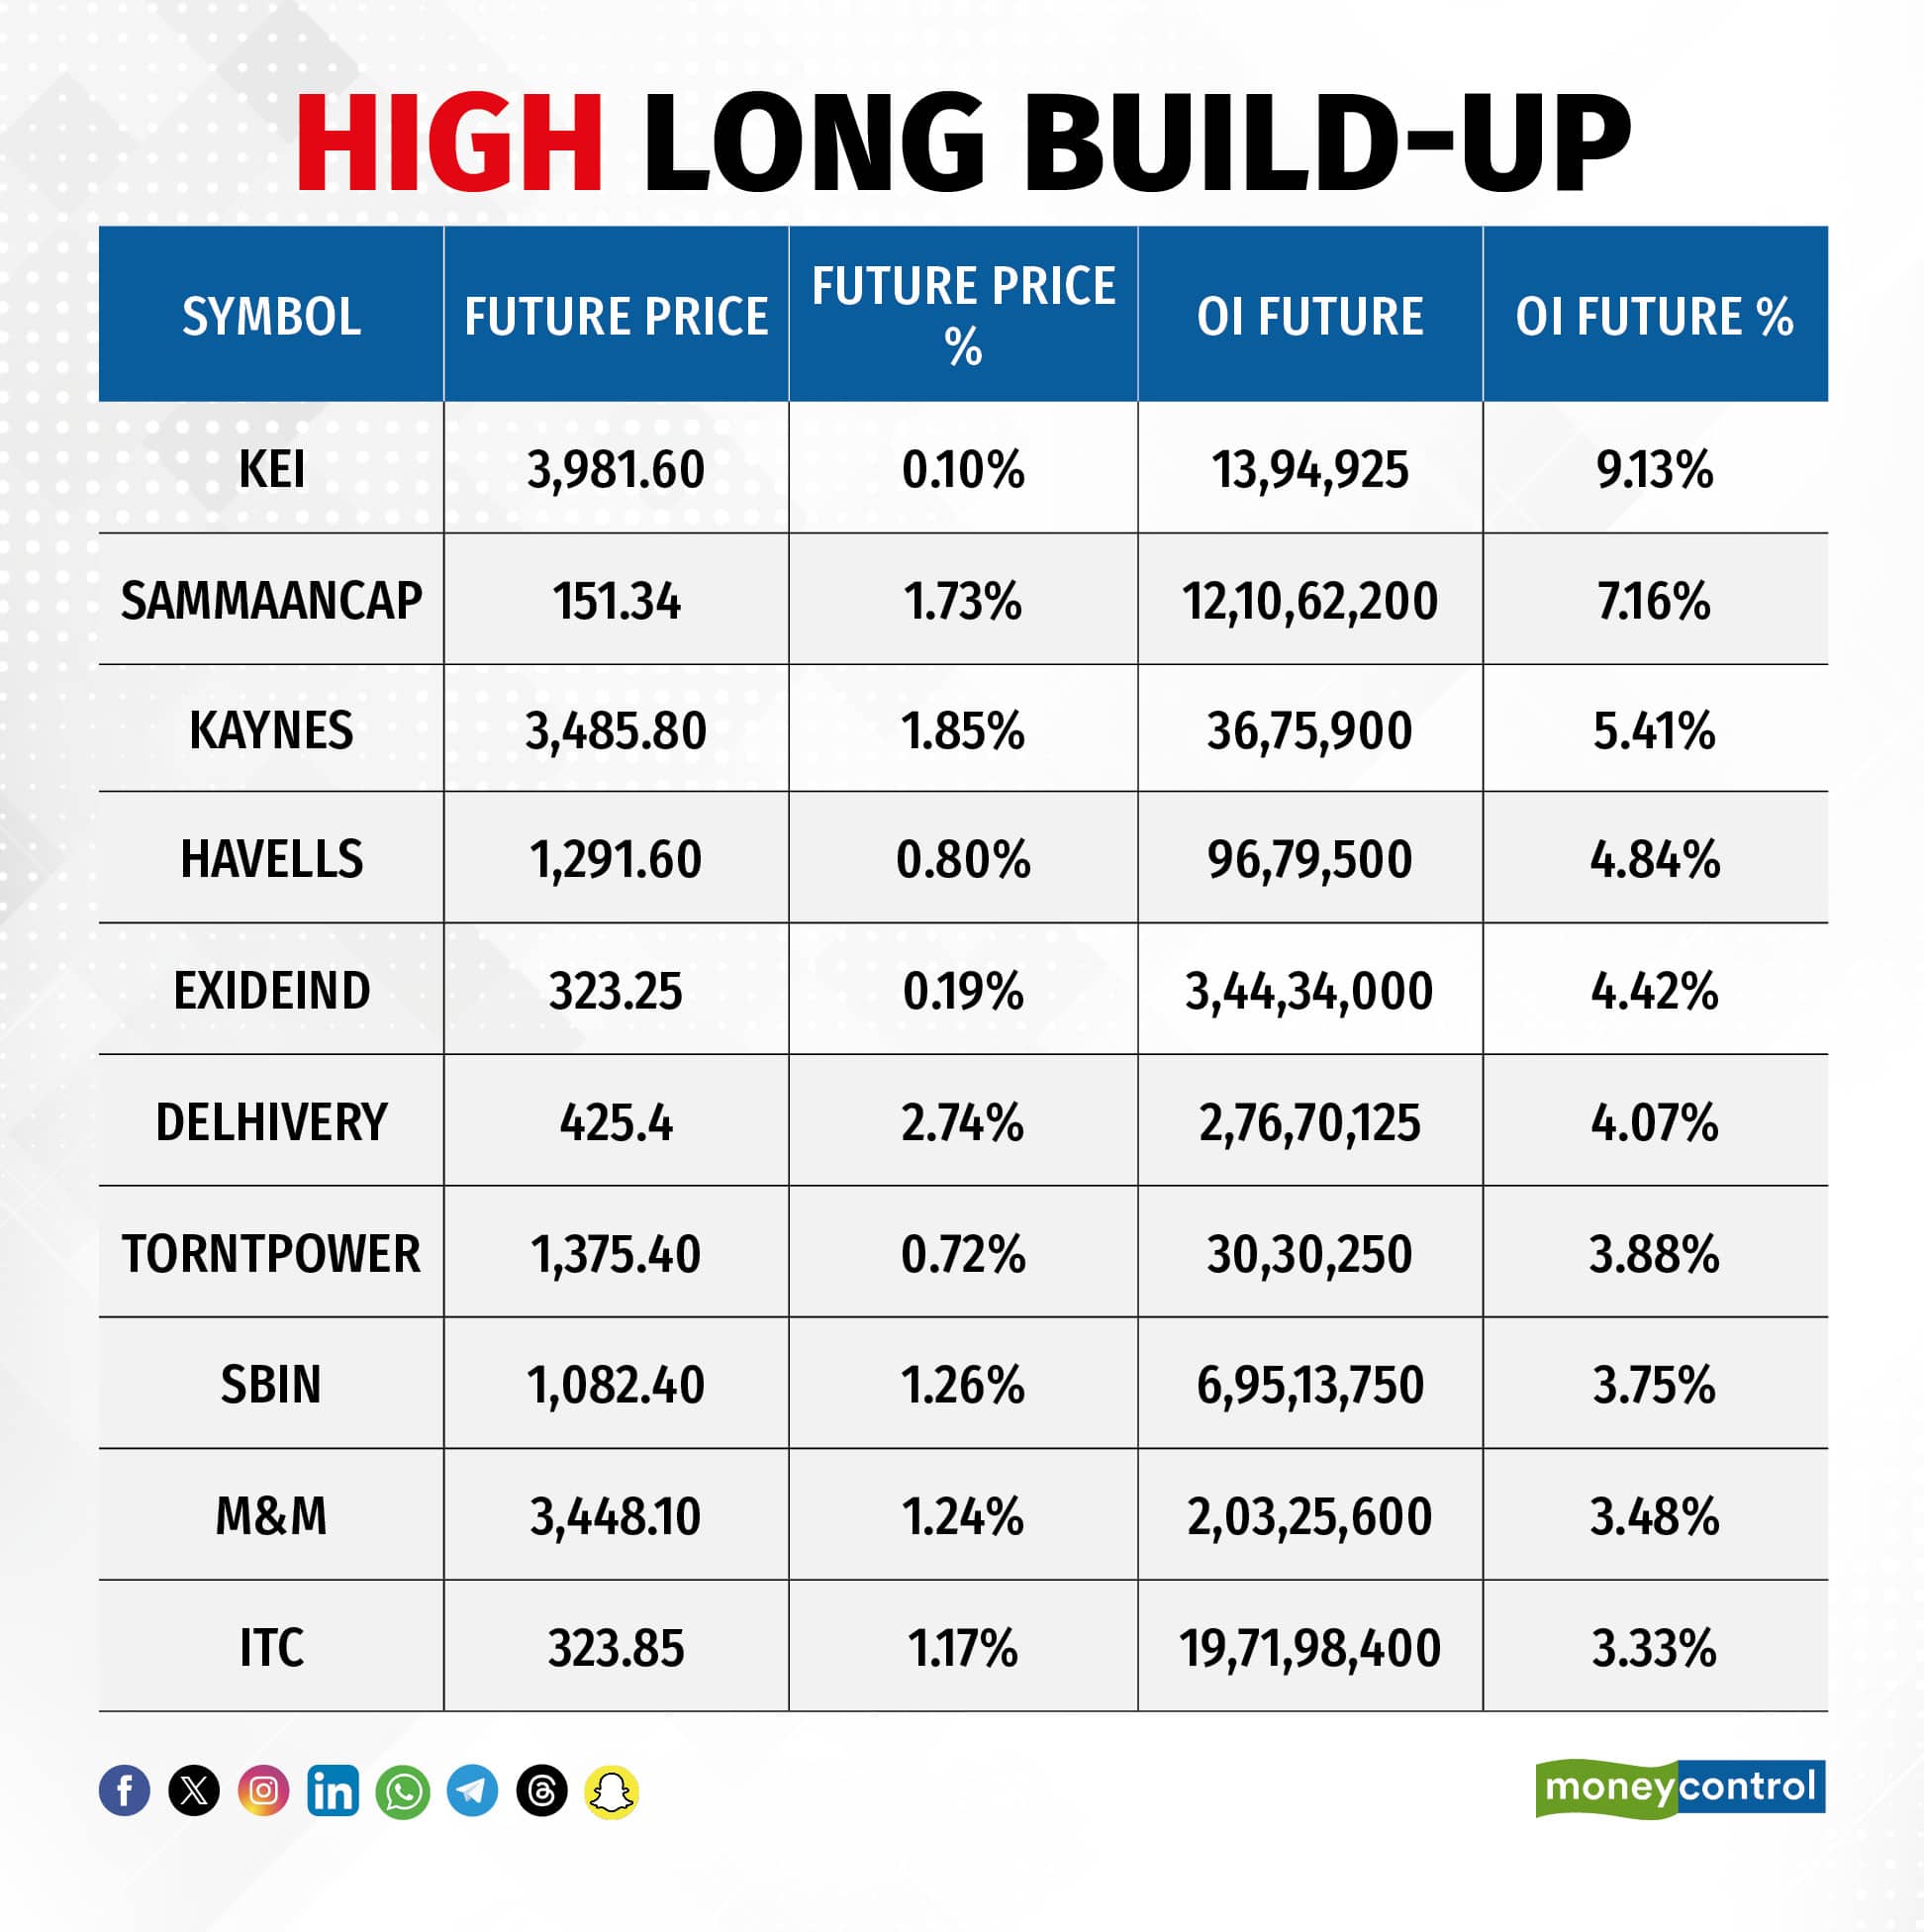
A long build-up was seen in 42 stocks. An increase in open interest (OI) and price indicates a build-up of long positions.
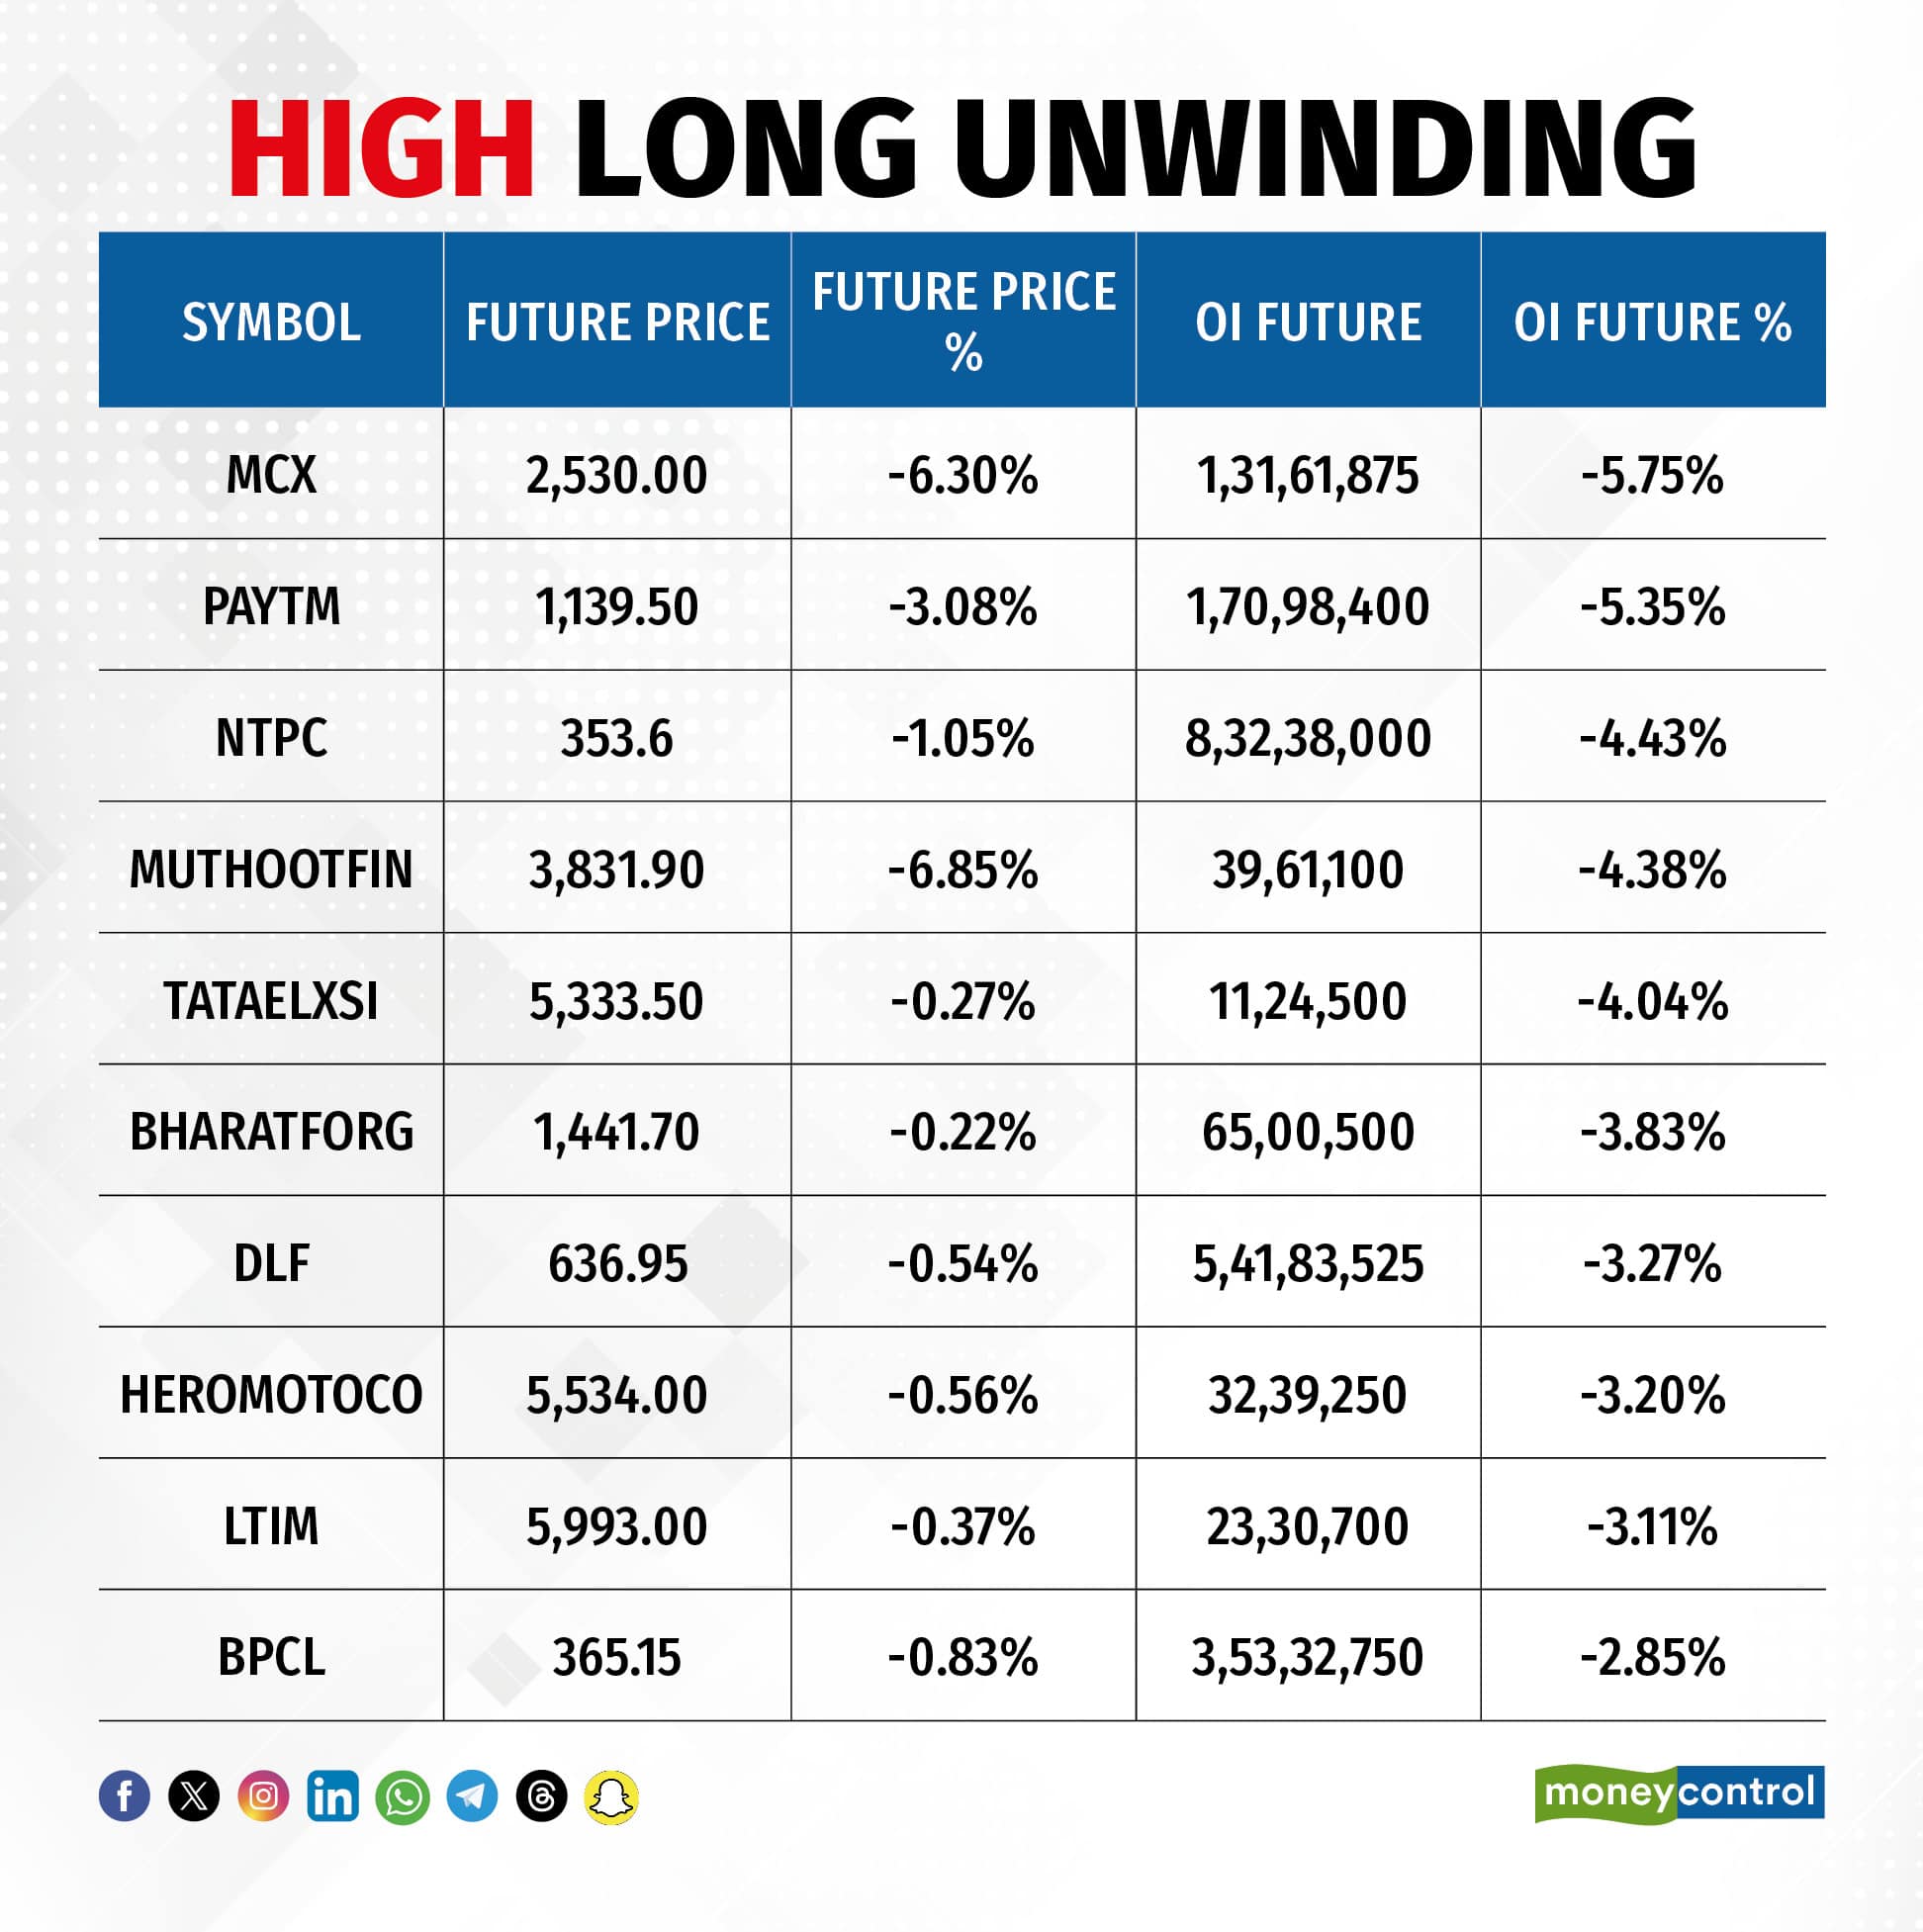
11) Long Unwinding (58 Stocks)
58 stocks saw a decline in open interest (OI) along with a fall in price, indicating long unwinding.
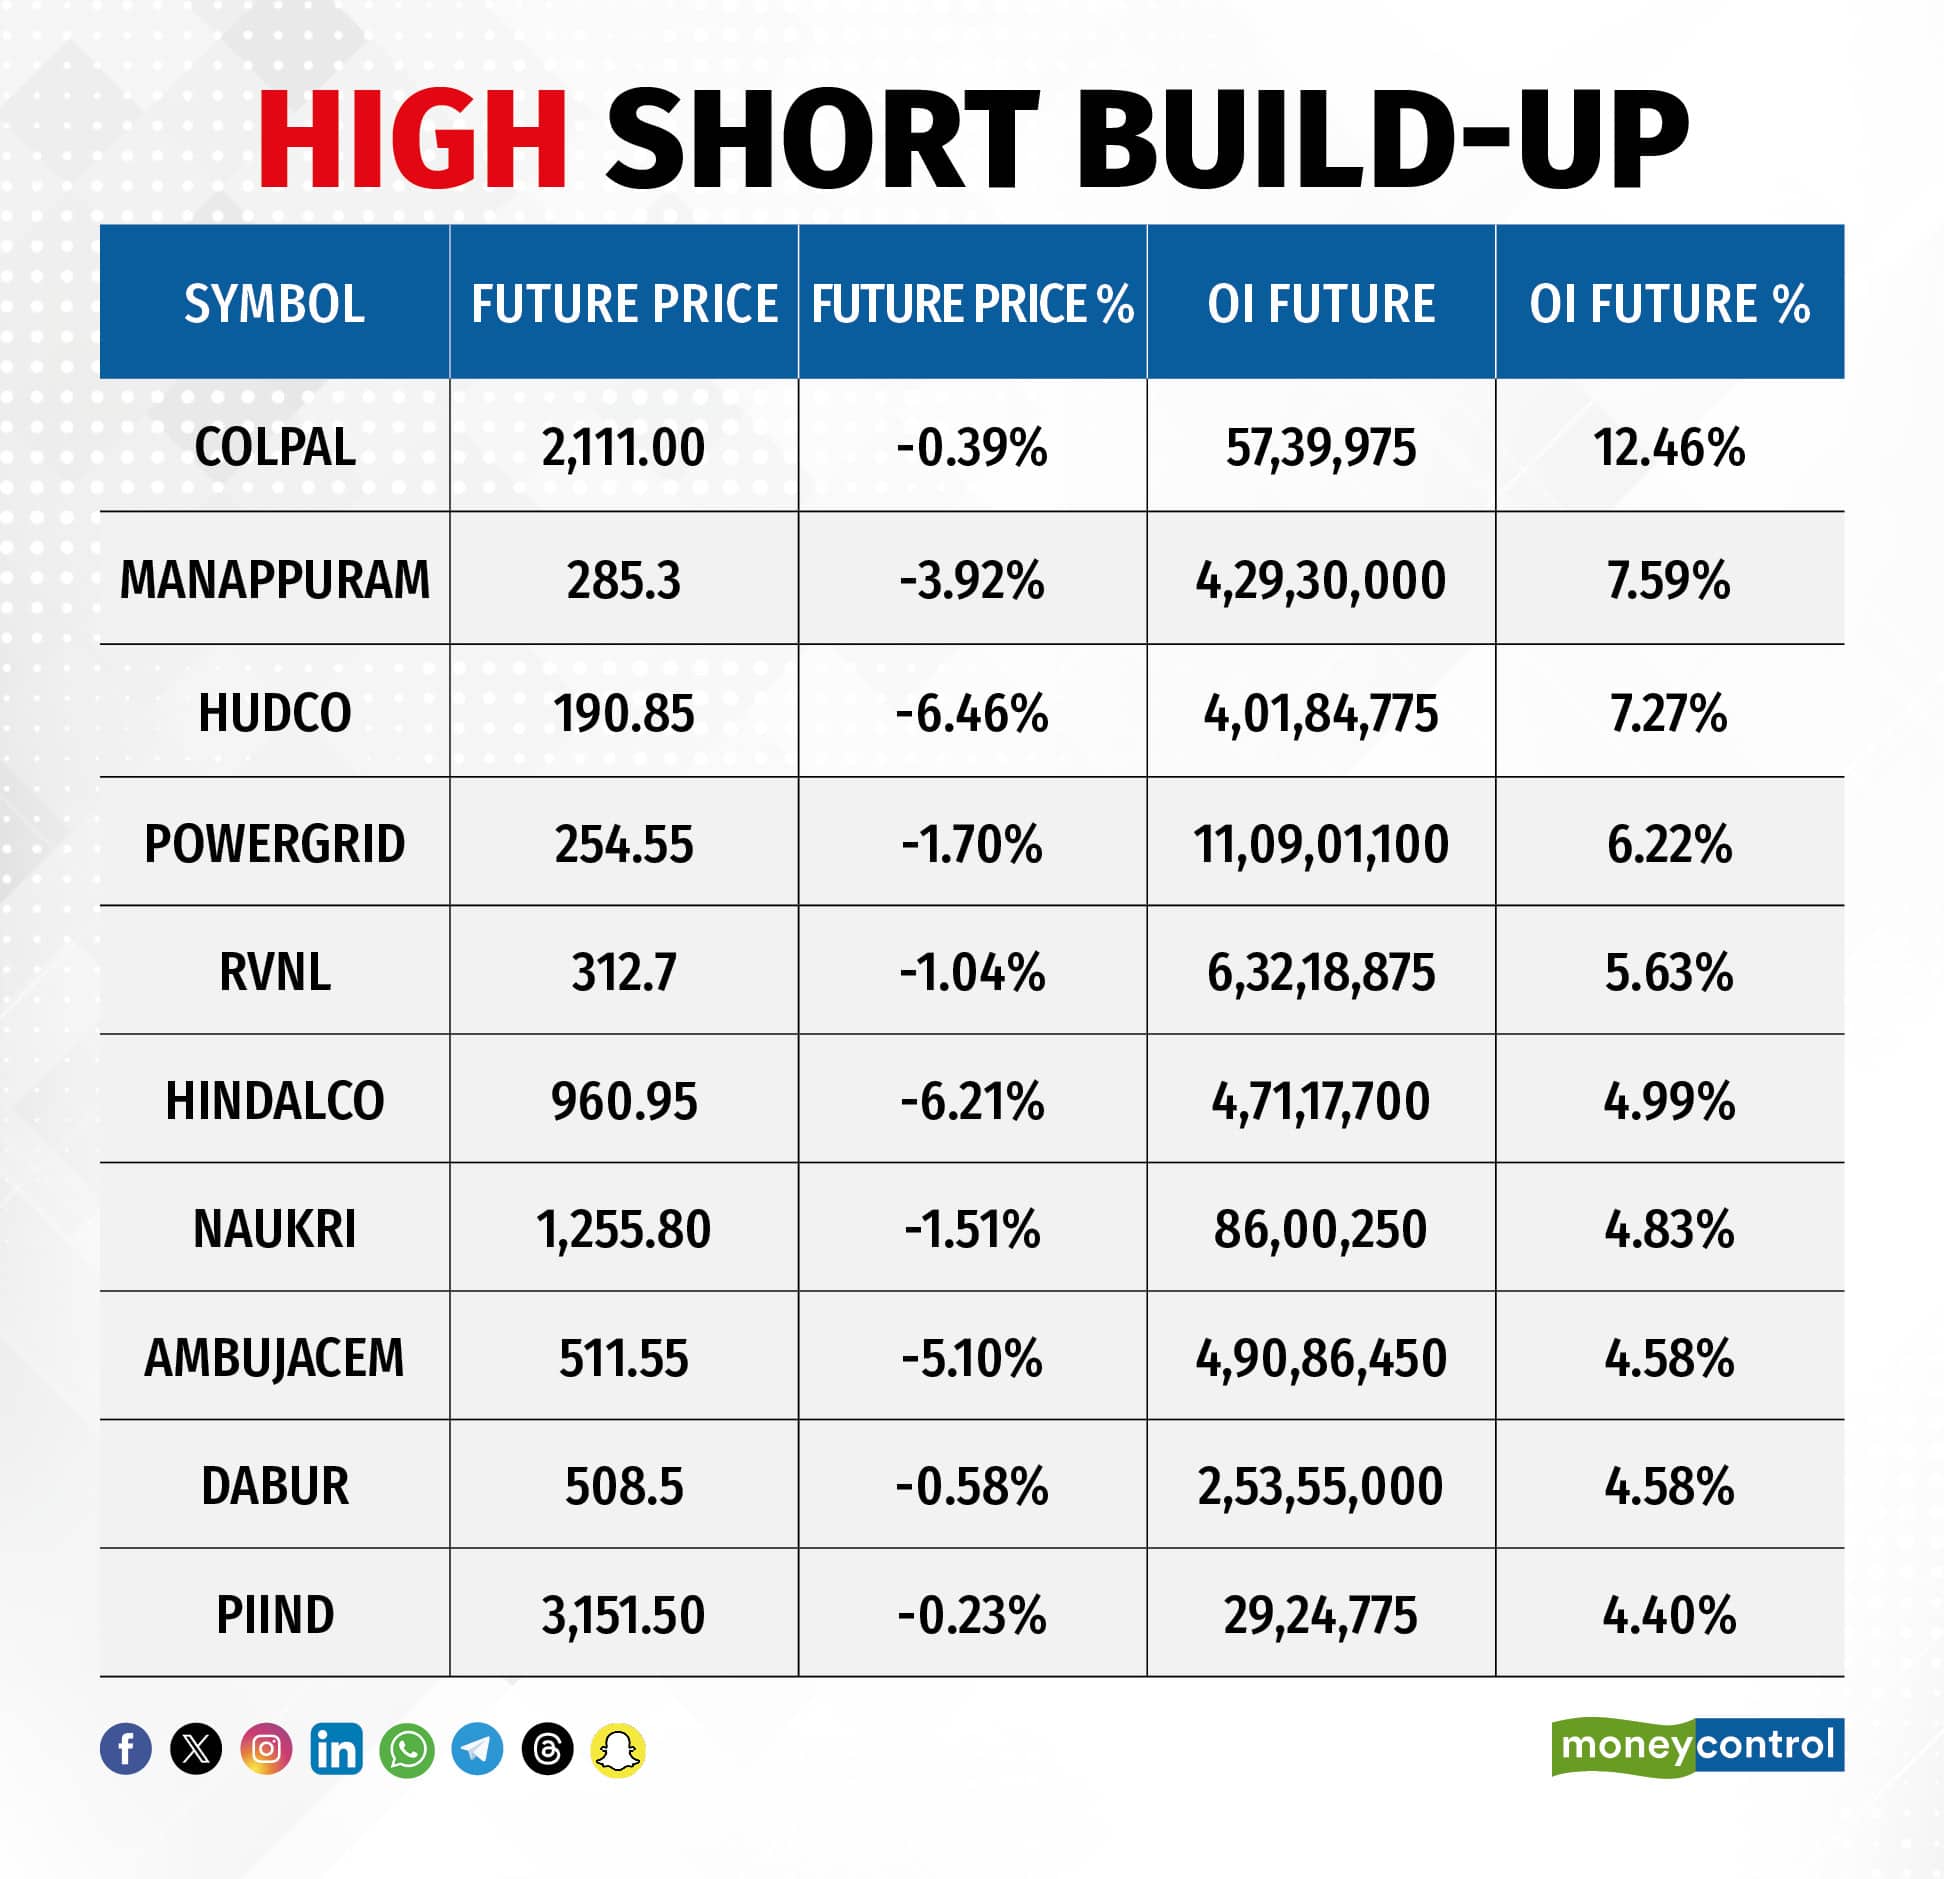
12) Short Build-up (56 Stocks)
56 stocks saw an increase in OI along with a fall in price, indicating a build-up of short positions.
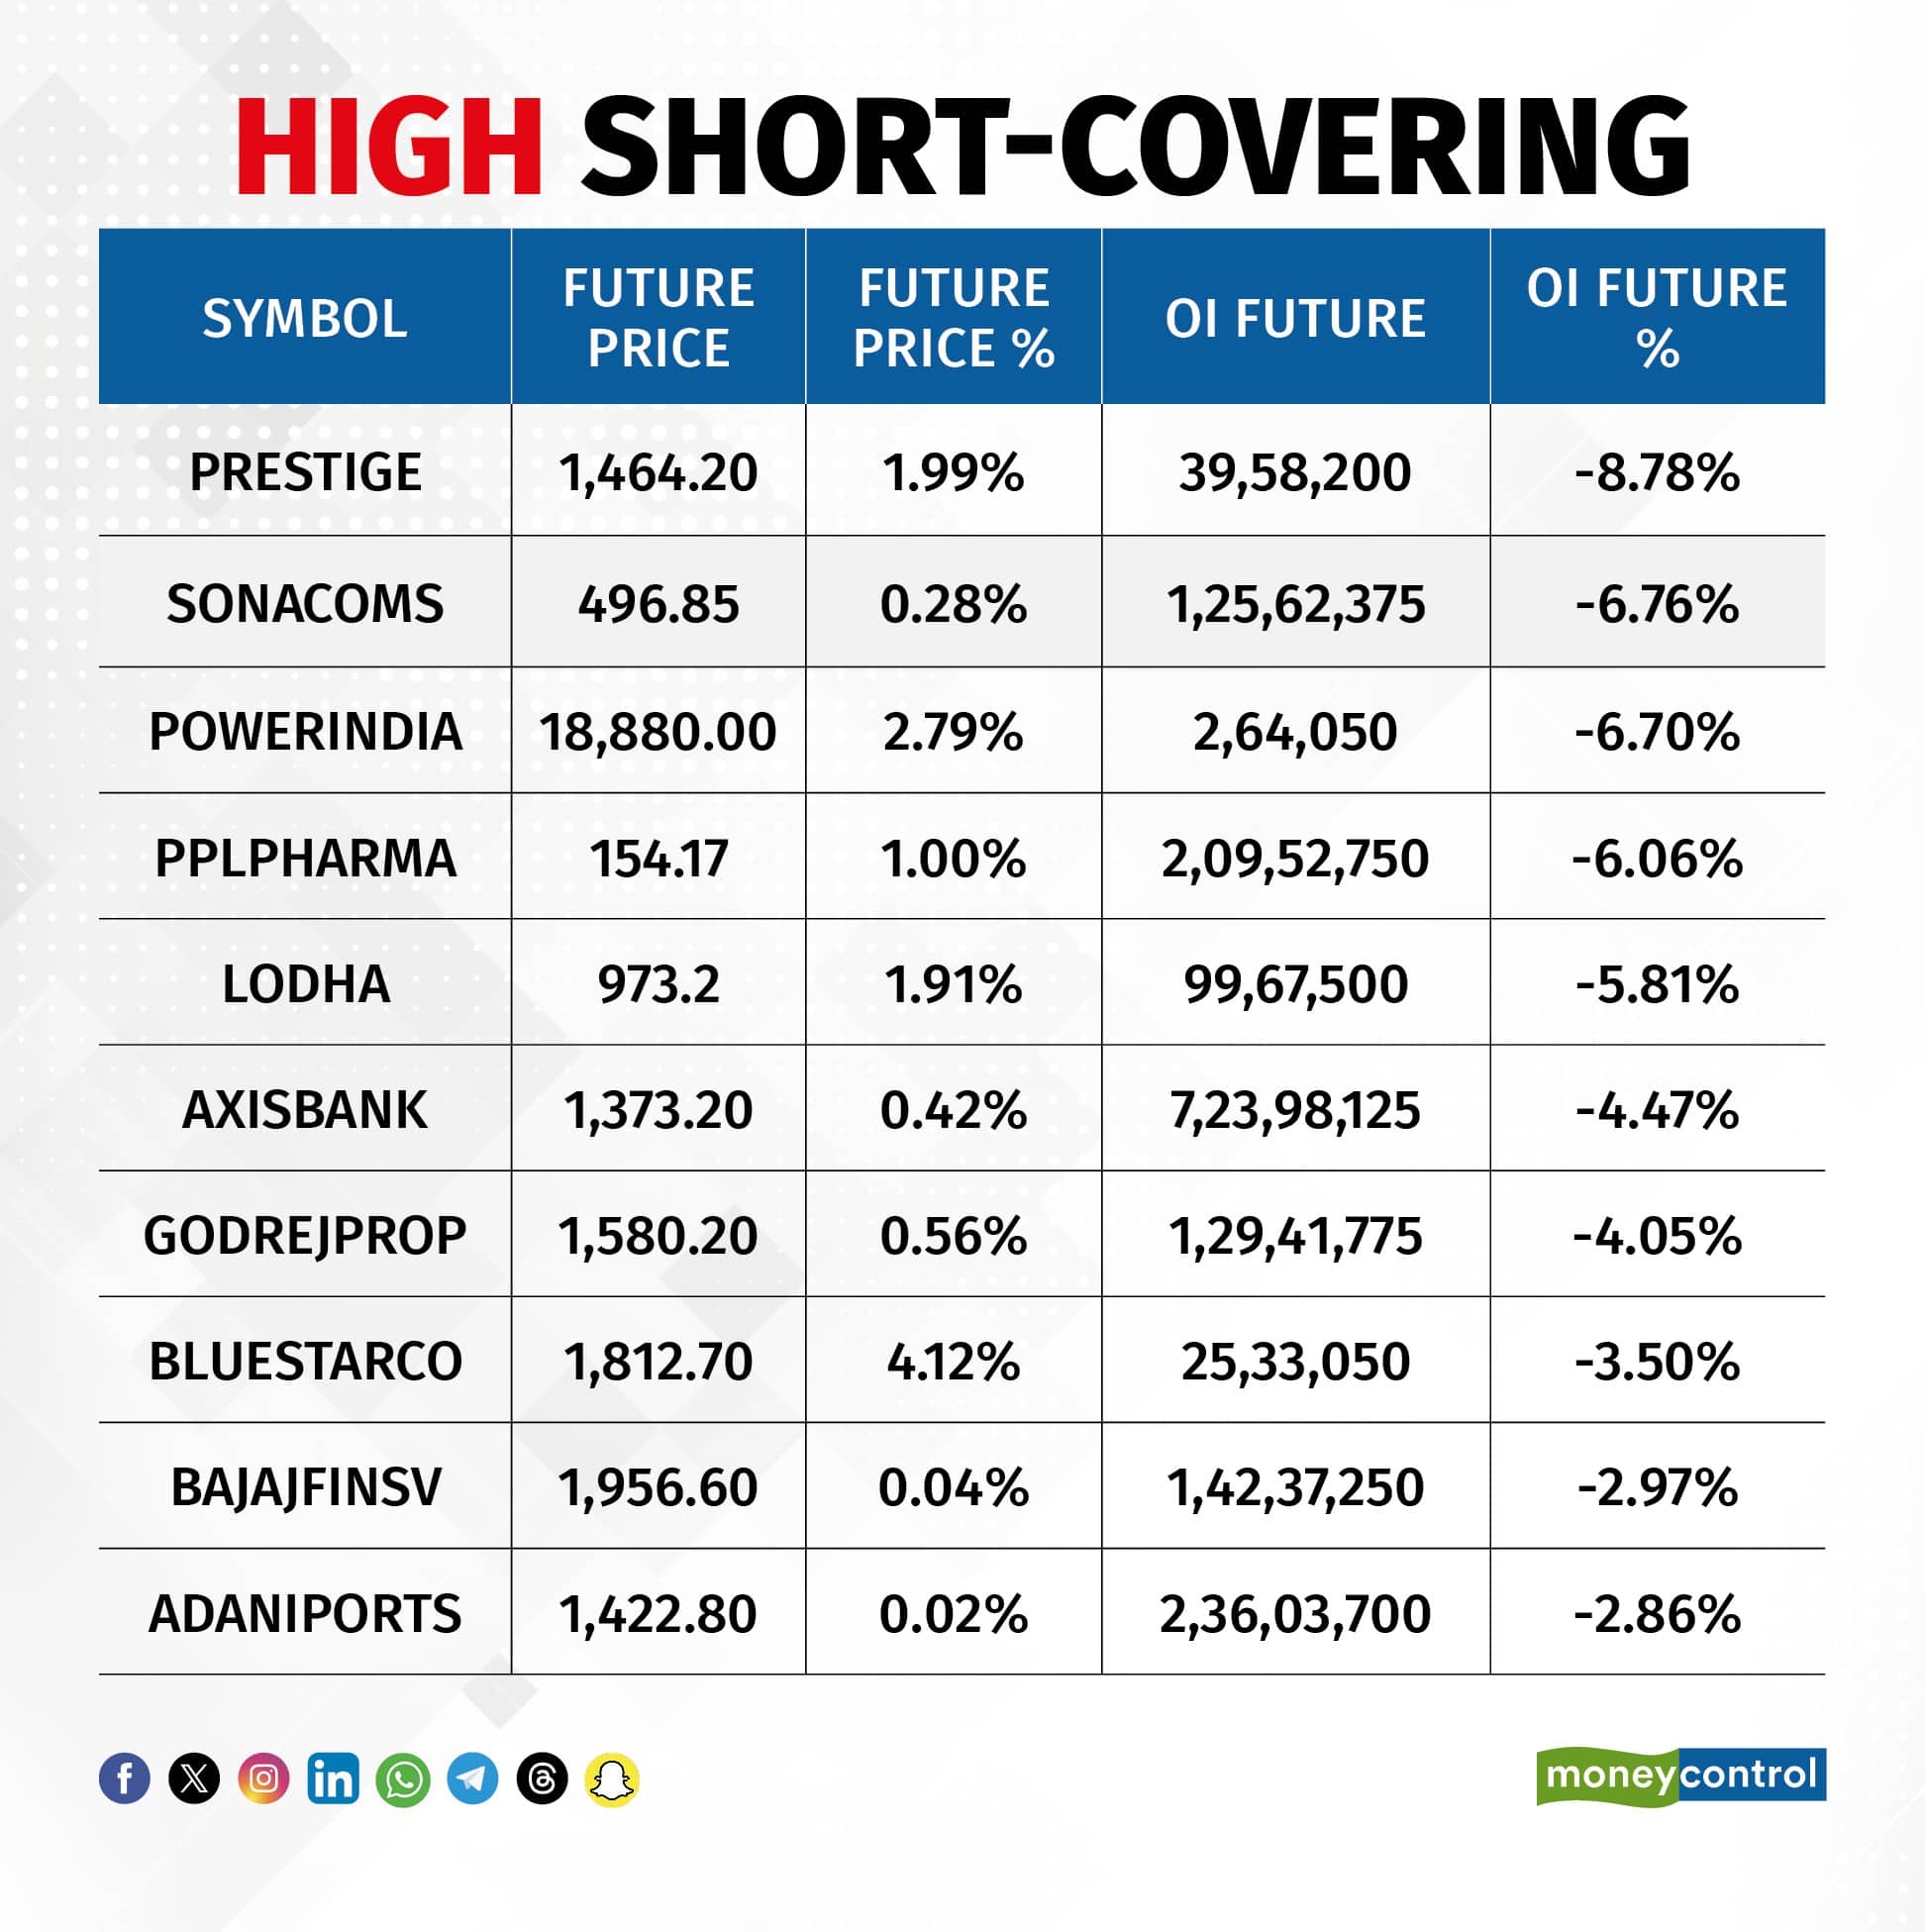
13) Short-Covering (54 Stocks)
54 stocks saw short-covering, meaning a decrease in OI, along with a price increase.
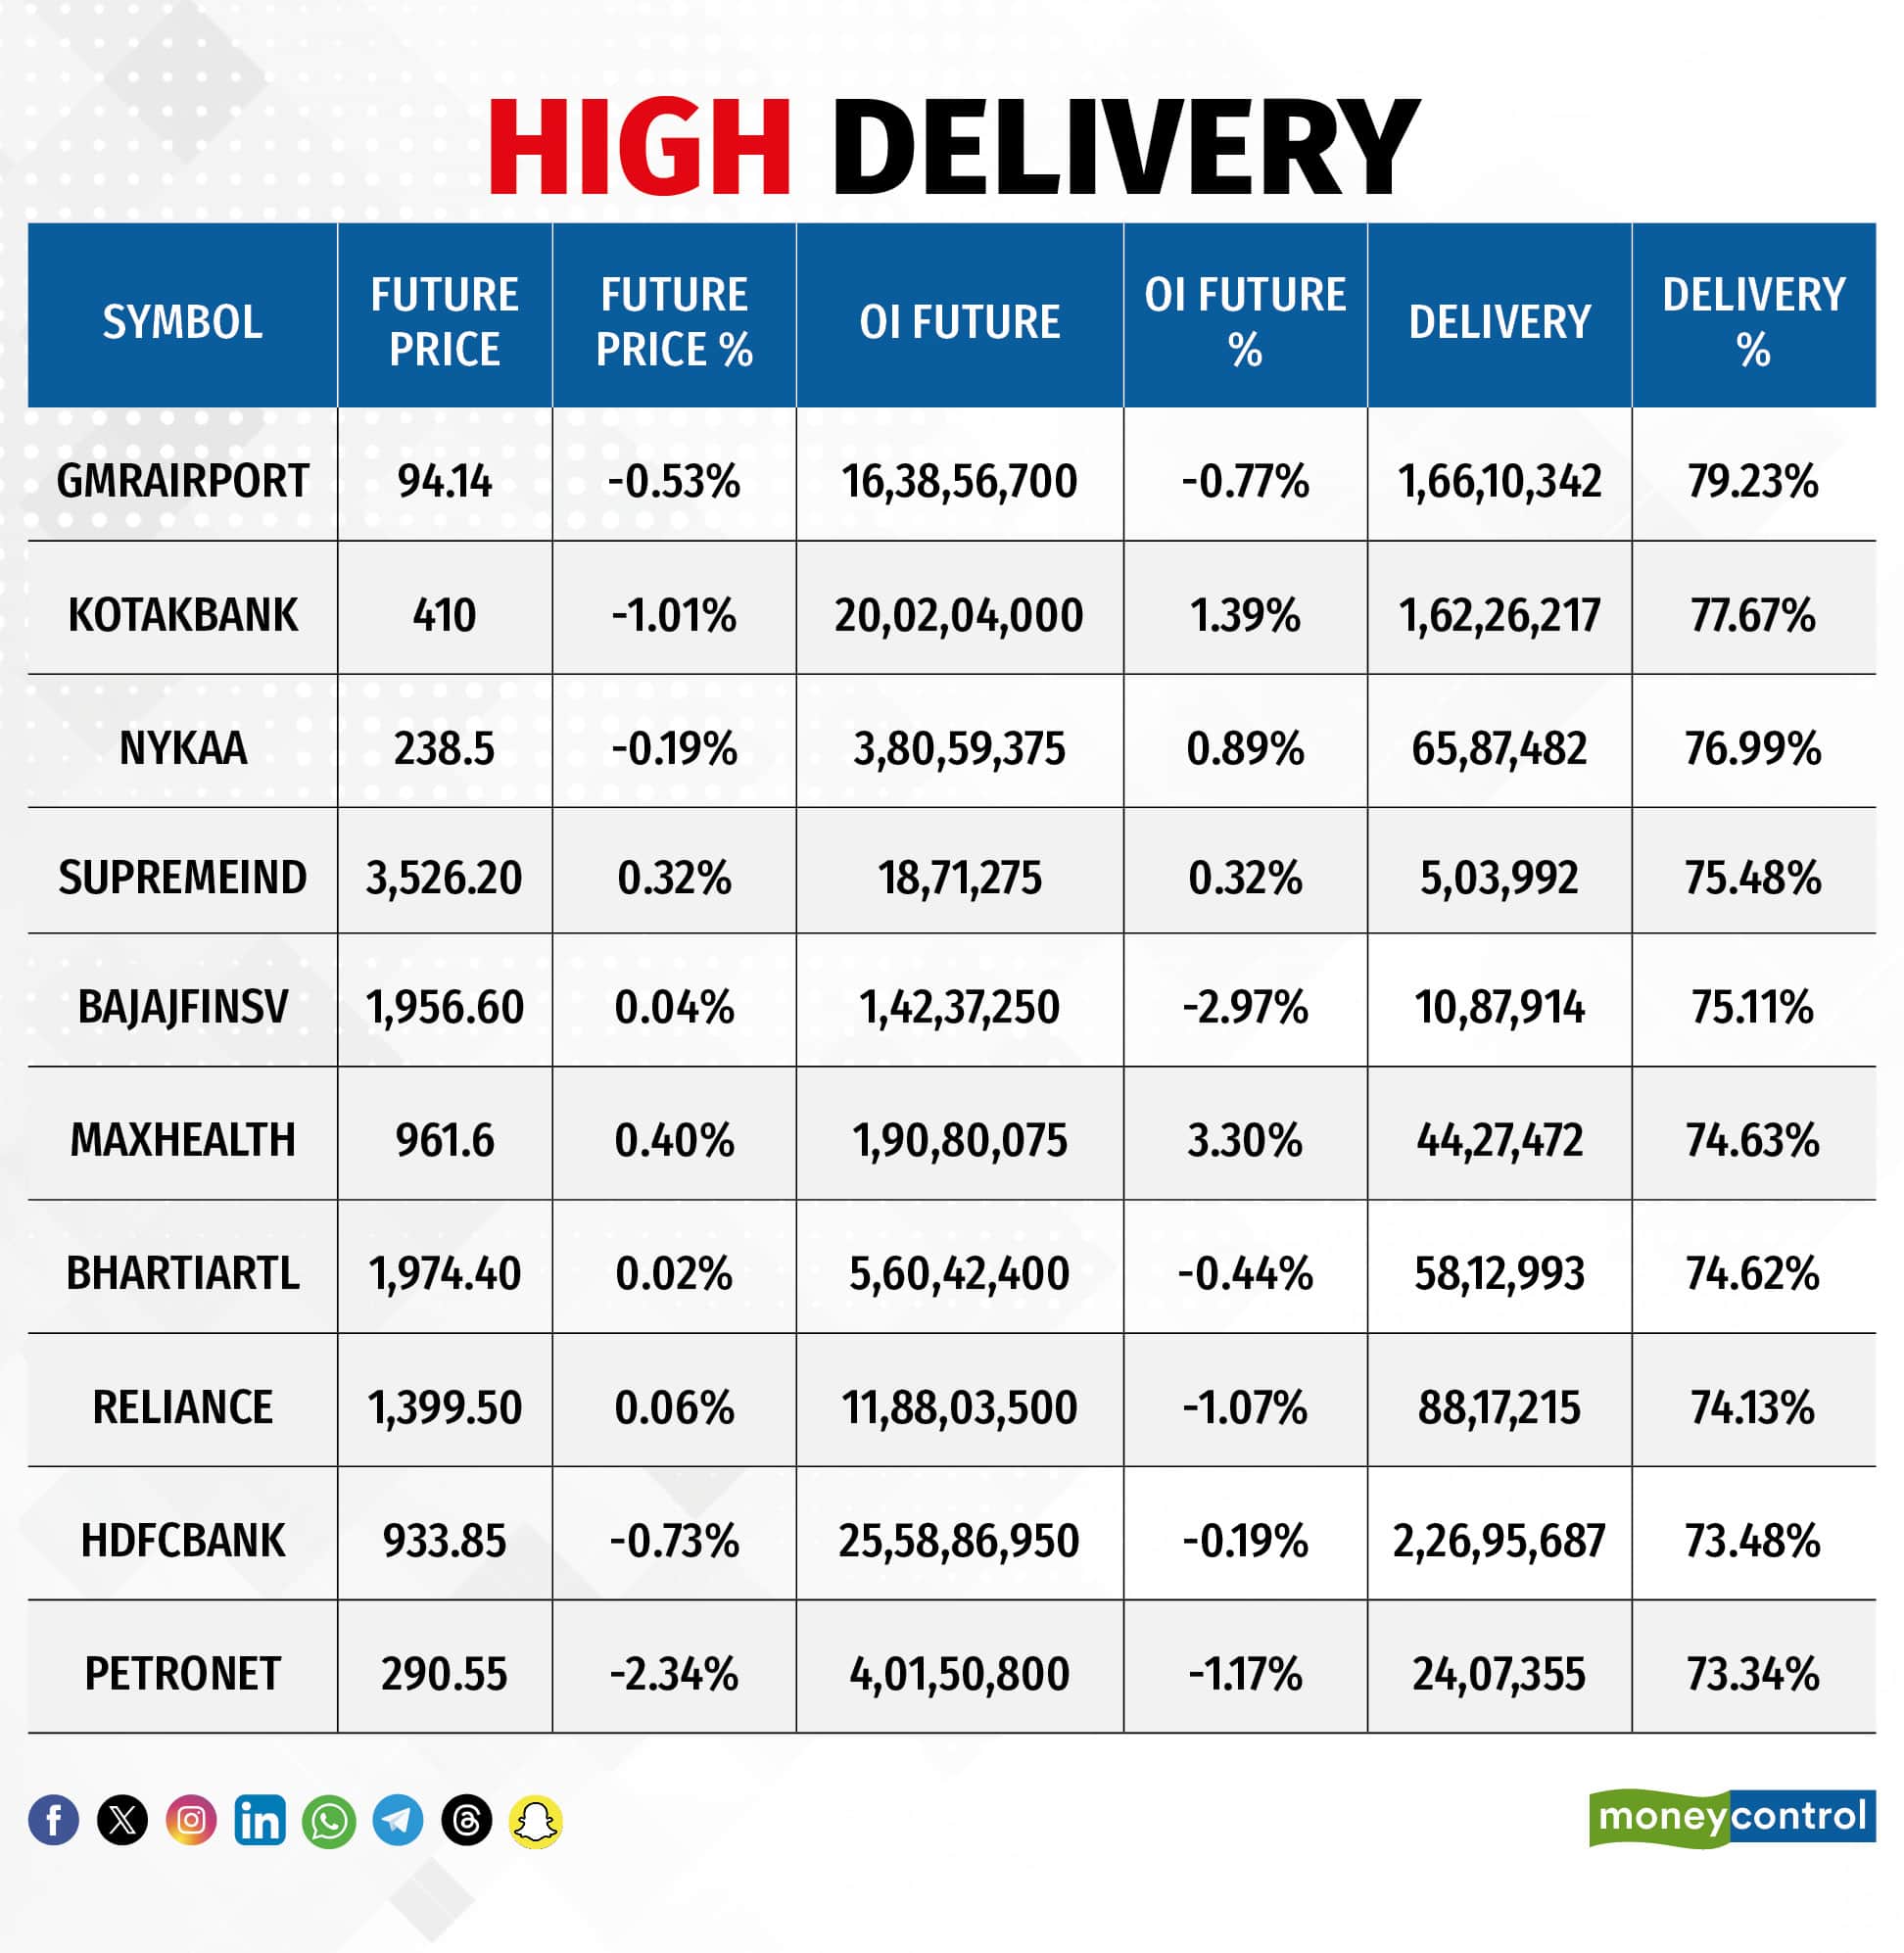
Here are the stocks that saw a high share of delivery trades. A high share of delivery reflects investing (as opposed to trading) interest in a stock.
Securities banned under the F&O segment include companies where derivative contracts cross 95 percent of the market-wide position limit.
Stocks added to F&O ban: Sammaan Capital
Stocks retained in F&O ban: Nil
Stocks removed from F&O ban: Nil
Disclaimer: The views and investment tips expressed by experts on Moneycontrol are their own and not those of the website or its management. Moneycontrol advises users to check with certified experts before taking any investment decisions.Disclaimer: Moneycontrol is a part of the Network18 group. Network18 is controlled by Independent Media Trust, of which Reliance Industries is the sole beneficiary.Discover the latest Business News, Sensex, and Nifty updates. Obtain Personal Finance insights, tax queries, and expert opinions on Moneycontrol or download the Moneycontrol App to stay updated!
Find the best of Al News in one place, specially curated for you every weekend.
Stay on top of the latest tech trends and biggest startup news.


