


The Indian stock market has been on a downward spiral lately, leaving many investors on edge. Yet, even in the face of discouragement, there’s a silver lining—some stocks are showing signs of outperformance and may be poised for a breakout.
As Bitcoin nears a six-figure price tag, it’s been the talk of the town, but a few stocks are trending like Bitcoins (bullish) in this bearish Indian stock market.
In this article, we will explore three stocks that have been trending bullish even as the market battles bearish sentiment. With the Nifty50 index showing early signs of a potential reversal, these stocks could be set for bigger gains if the market continues its bullish shift.
Before we dive into the stock charts, let us analyse the Nifty50 chart.
After a strong rally driven by short-covering last Friday, the Nifty50 index ended the last week with a 1.59 percent gain.
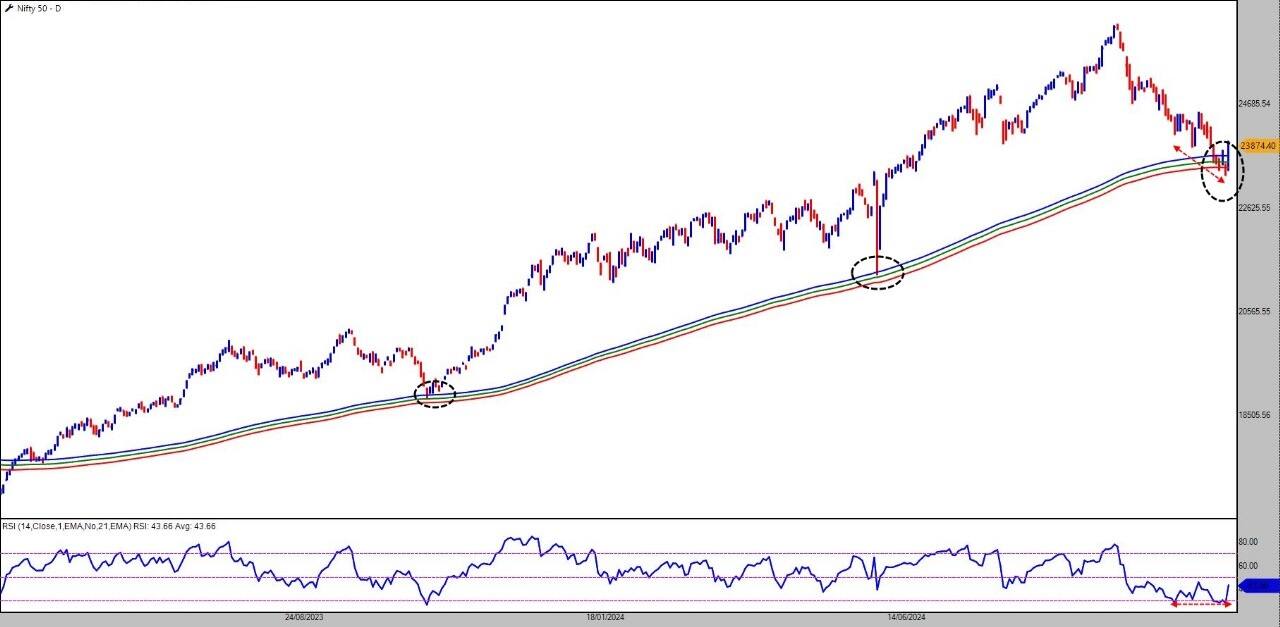
Source: TradePoint, Definedge
The Nifty50 index has recently bounced back from the 200-day exponential moving average (DEMA) on the daily chart, indicating potential support at this level. The 200DEMA and two other moving averages (200DEMA High and 200DEMA Low) form what I termed a "Moving Average Channel." Historically, this channel has acted as a demand zone, and current price action suggests the possibility of a market rebound.
Furthermore, the relative strength index (RSI) shows a positive divergence, reinforcing the potential for bullish momentum. As the market faces a critical juncture, this analysis suggests that traders can take advantage of an upward move.
Let us focus on three stocks with strong potential, following a strict selection process.Amber Enterprises India | CMP: Rs 6,483Amber Ratio Chart 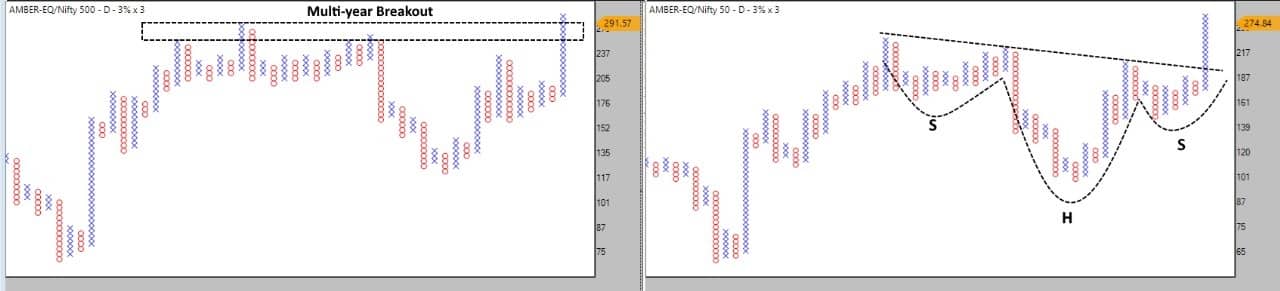
The stock recently broke out of a multi-year resistance level against the Nifty500 index, signalling a new growth phase. Additionally, the ratio chart against the Nifty50 shows a bullish Head and Shoulders pattern, indicating Amber's potential for outperformance relative to the broader market.
Amber Daily Chart 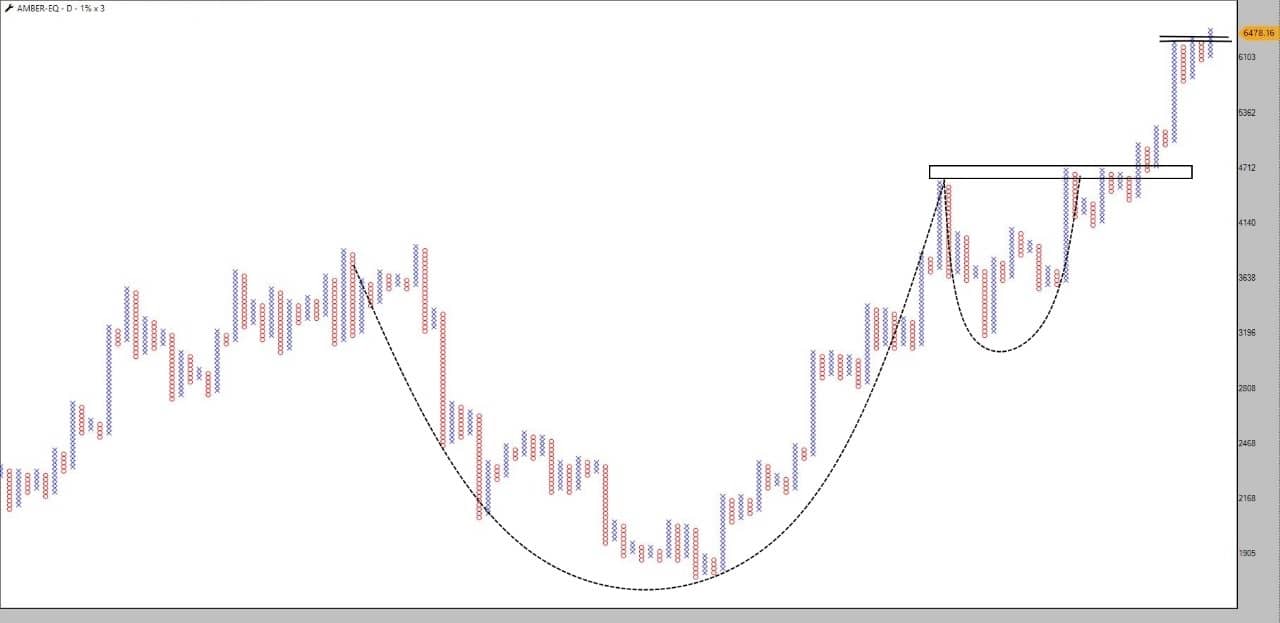
On the P&F (point-and-figure) chart, Amber Enterprises recently broke out of a Cup-and-Handle formation, signalling a potential continuation of its northward trend. A recent breakout from the anchor column pattern suggests that the bullish momentum will likely persist. Any dips could present attractive entry points for traders looking to enter, with the pattern negating below Rs 5,950.
Coforge | CMP: Rs 8,327.5Coforge Ratio Chart 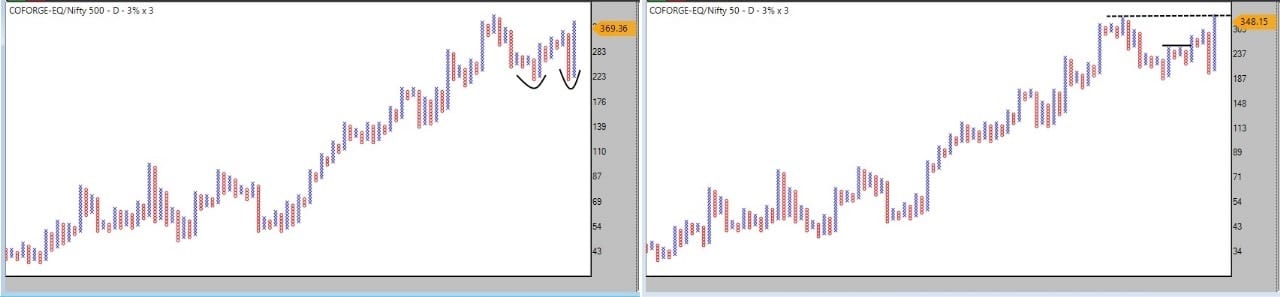
The Coforge/Nifty500 ratio chart shows a sharp reversal from support, suggesting that the recent bearish pressure was short-lived. The series of double-top breakouts on the ratio chart further strengthens the case for Coforge's outperformance. The Coforge/Nifty50 ratio is approaching a 52-week high, indicating that the stock may continue outperforming its benchmark.
Coforge Daily Chart 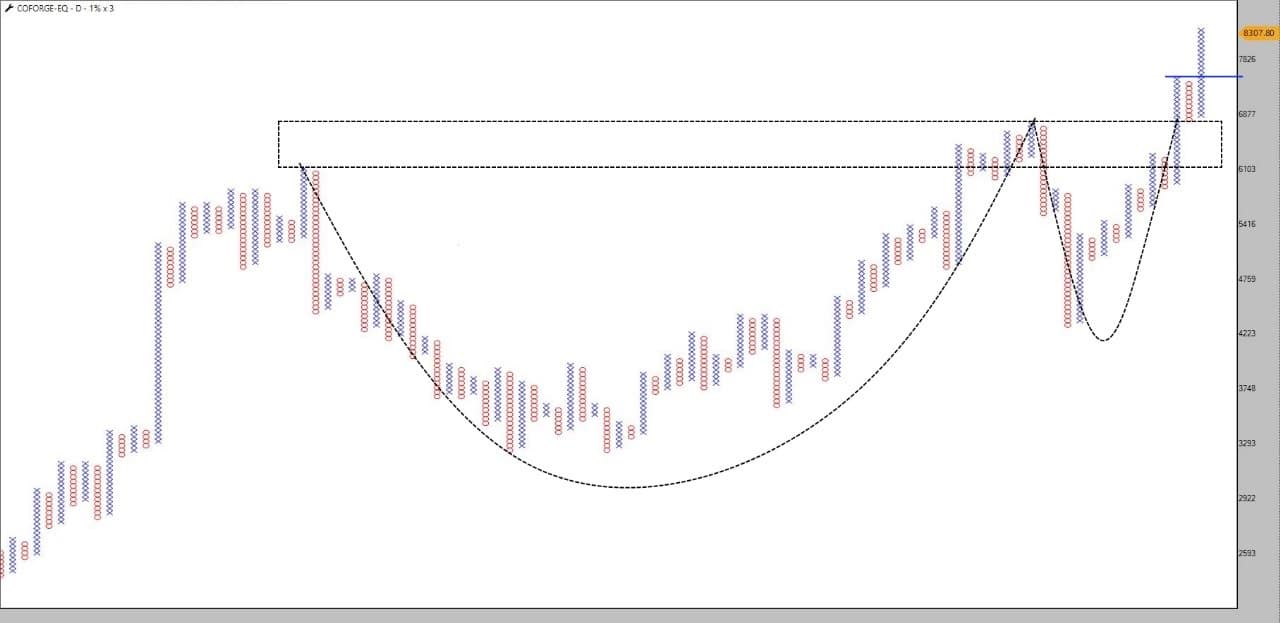
Like Amber, Coforge’s P&F chart highlights a Cup-and-Handle pattern, followed by a bullish anchor column breakout. With strong relative performance and a positive technical setup, Coforge is a potential stock to consider for your watchlist.
Indian Hotels | CMP: Rs 799Indian Hotels Ratio Chart 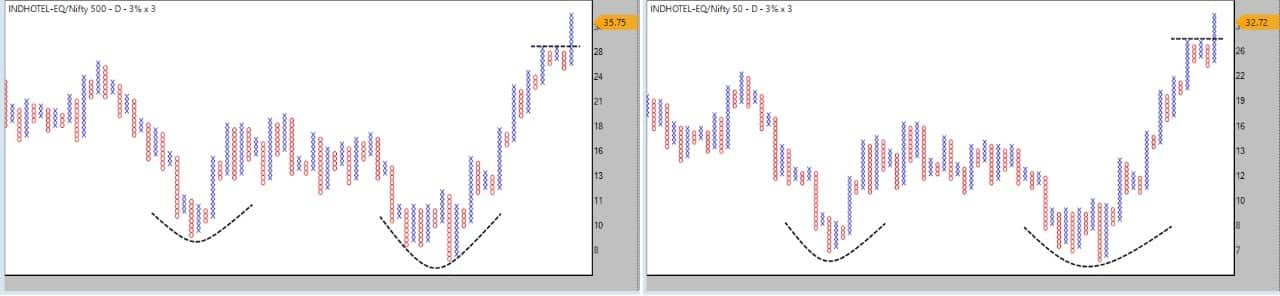
On the ratio charts against Nifty500 and Nifty50, Indian Hotels shows a "shakeout" or bear trap pattern at the bottom, which has followed a series of bullish breakouts. The appearance of a triple top buy (TTB) pattern signals the potential for continued outperformance relative to both Nifty500 and Nifty50.
Indian Hotels Daily Chart 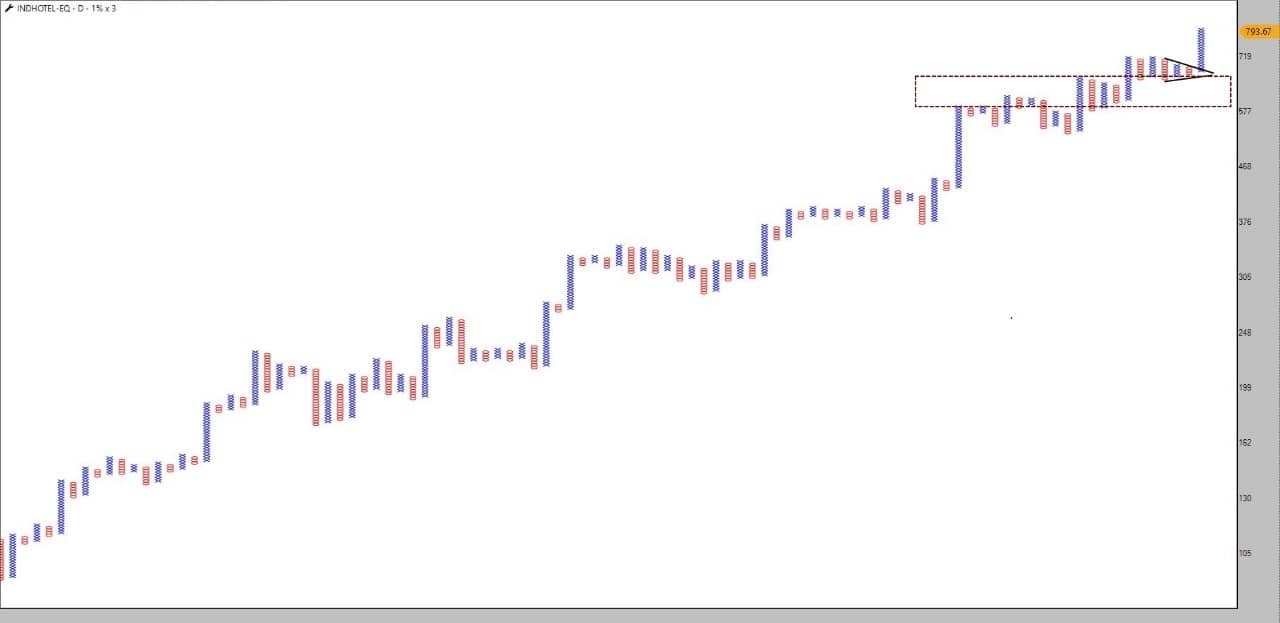
Indian Hotels has recently consolidated at higher levels after a breakout. Last week, a 7.8 percent rise in stock price indicates a strong resumption of bullish momentum, suggesting that the stock is in a strong position for potential upside.
To conclude, the broader market has been uncertain, and a few stocks, like Amber Enterprises, Coforge, and Indian Hotels, are showing significant bullish potential. These stocks have strong technical setups and are outperforming the broader market indices, making them worthy candidates to add to your watchlist.
The Stock Selection MethodOur stock selection methodology incorporates a 3-step process using point-and-figure (P&F) charting. The criteria for selecting stocks are as follows:
1> The stock should be at its highest-ever weekly closing level.
2> The stock must outperform both the Nifty50 index and the broader Nifty500 index.
3> The stock should offer a favourable risk-reward ratio, as it is trading near its all-time highs.
What is a P&F Chart?A point-and-figure chart is a chart method using X’s and O’s. The X denotes bullish moves, while O denotes bearish moves. Unlike traditional time-based charts, P&F charts focus solely on price changes and are considered "noiseless." They filter out minor price fluctuations, highlighting significant trends and reversals. The lack of time constraints gives a clearer picture of supply and demand dynamics, helping chartists make more informed decisions.
Note: The purpose of this article is only to share interesting charts, data points and thought-provoking opinions. It is NOT a recommendation. This article is strictly for educative purposes only.
Disclaimer: The views and investment tips expressed by investment experts on Moneycontrol.com are their own and not those of the website or its management. Moneycontrol.com advises users to check with certified experts before taking any investment decisions.
Discover the latest Business News, Sensex, and Nifty updates. Obtain Personal Finance insights, tax queries, and expert opinions on Moneycontrol or download the Moneycontrol App to stay updated!
Find the best of Al News in one place, specially curated for you every weekend.
Stay on top of the latest tech trends and biggest startup news.


