


 board is seen at the trading room of stock exchange in Frankfurt, Germany, May 8, 2017. REUTERS/Kai Pfaffenbach - RTS15MH4")
Shabbir Kayyumi
The Commodity Channel Index (CCI) is an oscillator originally developed in 1980 by Donald Lambert and featured in his book "Commodities Channel Index: Tools for Trading Cyclical Trends". The commodity channel index (CCI) is an oscillator used to identify cyclical trends in indices, ETFs, stocks, and commodities.
What is a 'CCI Indicator'?
It gained its name because it was originally used to analyze commodities. CCI is a versatile indicator that can be used to identify a new trend and it warns of extreme conditions too. Lambert originally developed CCI to identify cyclical turns in commodities, however, the indicator can be successfully applied to indices, ETFs, other securities.
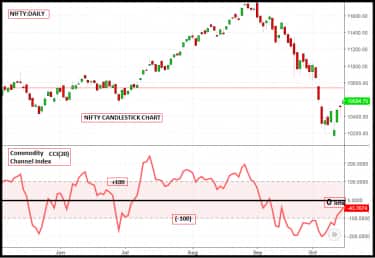 Figure .1.Illustration of CCI Indicator
The default period for the CCI indicator is 20 and it is non-limiting or unbound oscillators just like MACD. The indicator has grown in popularity and is now a very common tool for traders to identify cyclical trends not only in commodities but also in equities and currencies. Construction of CCI Indicator
An understanding of the underlying formula used for the construction of CCI helps traders to take a prudent decision, while trading complex scenarios. CCI indicator is calculated using the following formula:
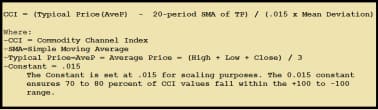 Figure .2.CCI Indicator Formula
Working of CCI CCI measures the difference between a security's price change and its average price change as shown above in formula. High or positive readings indicate that prices are well above their average, which shows strength. Low or negative readings indicate that prices are well below their average, which shows weakness.
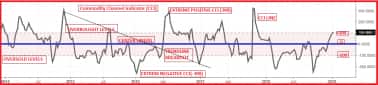 Figure .3.CCI indicator
The indicator measures the current price level relative to an average price level over a given period of time. However, the default period is taken as 20. The CCI can be adjusted to the timeframe of the market traded on by changing the averaging period.
Trading Technique:
Overbought / Oversold CCI
A rule of thumb for the commodity channel index is that oversold is - 100 and overbought +100. Theoretically, there are no upside or downside limits as it is a non-limiting oscillator. This makes an overbought or oversold assessment subjective. And that requires using CCI to be combined with an additional trading tool. One can use a stochastic oscillator with CCI for successful trading.
Trading Strategy Using CCI and Stochastic Oscillator:
Buy Signal:-
Entry
• CCI crosses above +100 for the first time, signaling buy on the dip
• After that, it starts to curve downward and retraces down to the center line.
• After CCI gets near the center line, stochastic oscillator gives bullish crossover. A Buy signal is generated.
Exit
• One can use multiple exit strategy like CCI again in over bought zone or price trend line break down or CCI trend line break down.
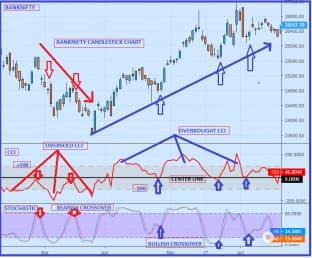 Figure .4.CCI Indicator - OB & OS Buy & Sell Signals
Sell Signal:
Entry
• CCI crosses below -100 for the first time, sell on rise strategy is triggered
• CCI then curves upward and rises to the center line
• Once CCI is near the center line and the stochastic oscillator gives bearish crossover, Sell signal is generated.
Exit
• One can use multiple ways to cover short sell trades, like CCI again in over sold or price trend line break out or CCI trend line break out.
CCI Centerline
The center line is very useful for understanding the trend of the underlying financial instrument. One can use a simple yet powerful trading strategy using center line of CCI as discussed below. First, draw a zone between +30 and -30 CCI values as indicated by dotted lines and add RSI (14) oscillator on the chart too.
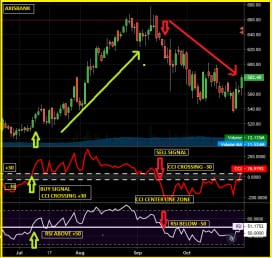 Figure .5.CCI Indicator Center Line Buy & Sell Signals
Buy Signal:-Entry
• After touching over sold zone (-100), when CCI crosses +30 from below and RSI is also trading above 50, buy signal is generated.
Exit
• CCI breaching -30 levels from above or RSI trading below 50, signals to book profit & exit.
Sell Signal:-Entry
• After touching over bough zone (+100), when CCI crosses -30 from above and RSI is also trading below 50, sell signal is generated.
Exit
• CCI breaching +30 levels from below or RSI trading above 50, signals to book profit & exit.
Trend lines and Divergences
The practice of drawing trend lines on a stock chart is almost as old as buying stock itself, but one can also draw trend lines on the indicators. Drawing a support and a resistance level at the same time creates a channel of action that helps measure the trend's current strength. The strength of the current trend can be measured by channeling the CCI. One can use trend line breakouts to justify buy or sell signals too.
The CCI divergence is similar to other oscillator divergences. And it forms when the CCI diverges from the price action of the underlying security. A bullish divergence forms when a security records a lower low and the CCI forms a higher low.
Trend lines and divergence together also forms a profitable trading strategy.
Buy Signal:-
Entry
• CCI must develop a bullish regular divergence in over sold zone
• Buy signal is generated after a CCI trend line break out as indicated
Exit
• One can use multiple ways to book profit and exit, like when CCI re-enters the overbought zone or price trend line break down or CCI trend line break down.
Sell Signal:-
Entry
• CCI must develop a bearish regular divergence in over bought zone
• Sell signal is generated after a CCI trend line break down as indicated
Exit
One can use multiple ways to cover short sell trades, like when CCI re-enters the oversold zone or price trend line break out or CCI trend line break out.
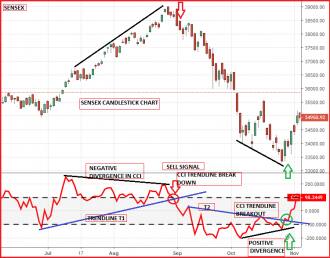 Figure .6.CCI Indicator Divergence & Trend line Buy & Sell Signals
Conclusion
• The commodity channel index is an oscillator used to identify cyclical trends.
• The indicator creates overbought/oversold signals. It also exhibits properties of trend lines and helps to discover divergence.
• Center line trading method, overbought/oversold levels and divergence technique are the most popular ways of trading using CCI.
The author is Head - Technical & Derivative Research, Narnolia Financial Advisors Ltd.
Disclaimer: The views and investment tips expressed by investment experts on moneycontrol.com are their own, and not that of the website or its management. Moneycontrol.com advises users to check with certified experts before taking any investment decisions.

Discover the latest Business News, Sensex, and Nifty updates. Obtain Personal Finance insights, tax queries, and expert opinions on Moneycontrol or download the Moneycontrol App to stay updated!
Find the best of Al News in one place, specially curated for you every weekend.
Stay on top of the latest tech trends and biggest startup news.


