
Taking Stock: Sensex, Nifty Close In The Red; Oil & Gas, Power Stocks Gain
On the BSE, the realty index shed 3 percent and the IT index fell 2 percent but power, oil & gas and metal indices gained a percent each... Read More

| Index | Prices | Change | Change% |
|---|---|---|---|
| Sensex | 85,712.37 | 447.05 | +0.52% |
| Nifty 50 | 26,186.45 | 152.70 | +0.59% |
| Nifty Bank | 59,777.20 | 488.50 | +0.82% |
| Biggest Gainer | Prices | Change | Change% |
|---|---|---|---|
| Shriram Finance | 854.90 | 26.75 | +3.23% |
| Biggest Loser | Prices | Change | Change% |
|---|---|---|---|
| Interglobe Avi | 5,370.50 | -66.00 | -1.21% |
| Best Sector | Prices | Change | Change% |
|---|---|---|---|
| Nifty PSU Bank | 8381.75 | 125.05 | +1.51% |
| Worst Sector | Prices | Change | Change% |
|---|---|---|---|
| Nifty Pharma | 22947.20 | -11.80 | -0.05% |
The spot rupee closed at the highest level in a month at 74.04 against the dollar on the back of a sharp rise in US treasury bond yields and Brent crude oil prices. Brent crude is trading at the highest level since October 2018 and TSY yields are at the highest levels since June 2021.
Fed turning hawkish and rising oil prices, are pushing yields higher. Higher yields and higher oil prices are double negatives for the Rupee, as they can trigger outflows. Over the near term, the rupee could trade within a range of 73.70-74.70 with a slightly upward bias.
Markets faltered as investors resorted to profit-taking after the record-breaking rally in the last few sessions. Investors booked profit in realty, IT, and select telecom and banking stocks that saw benchmark Nifty plunge sharply but trimmed losses to end below 17800 which is broadly negative.
Technically, on daily charts, the index has formed a bearish candle which indicates further weakness from current levels. However, as long as the index is trading above the 20 days SMA, the uptrend texture is intact. We are of the view that the market has completed one leg of correction and now 20 days SMA and 17600 -17550 levels would act as a sacrosanct support zone.
For day traders, 17800-17840 would be the intraday resistance level. On the flip side, 17600–17550 would be the strong intraday support zone. The texture of the market is volatile and it will remain volatile till the monthly expiry day.
On a technical front, the Nifty has taken support from the lower band of a rising wedge pattern which suggests an upside rally in coming sessions. Moreover, the Index has taken support from 100 HMA and given closing above the same, which further adds strength to the upside.
On four hourly charts, the Index has formed a Hammer candlestick with the support of the 21-Four Hourly Moving Average as well as Hourly Momentum Indicator Stochastic. It has also bounced from the oversold zone with a positive crossover which points to upside movement in the counter. At present, the Index has support at 17,550 levels, while upside resistance comes at 17,950 levels.
Following negative global cues and profit booking in IT and realty sectors, the domestic market hit rough weather, however, it witnessed a rebound towards the closing. Rise in US bond yield and crude oil price along with the Chinese crisis acted as key headwinds to the ongoing rally in the global market. Amid broad-based selling in the domestic market, public sector, energy and metal stocks traded higher.
Highly volatile trade witnessed today with significant swings on either side led by the IT & Oil & Gas Index. The PSE Index put up a stellar show today rising over 3% with power stocks making a smart up move. Despite the smart pullback from the lows of the day, declines were higher than advances in the broader market.
The market witnessed a correction and an attempt to hold the level around the Nifty 50 Index level of 17,600. It suggests that 17,550-17,600 will be an important support zone for the market to stay positive in the short term.
If the market is able to sustain the level of 17,550-17,600, it can witness higher levels of 18,000. Technical indicator suggests, a volatile movement in the market in a small range between 17,600-18,000.
: Benchmark indices witnessed profit booking on September 28 but recovered from the day's low amid buying seen in the metal, power and oil & gas stocks.
At close, the Sensex was down 410.28 points or 0.68% at 59,667.60, and the Nifty was down 106.50 points or 0.60% at 17,748.60. About 1463 shares have advanced, 1715 shares declined, and 164 shares are unchanged.
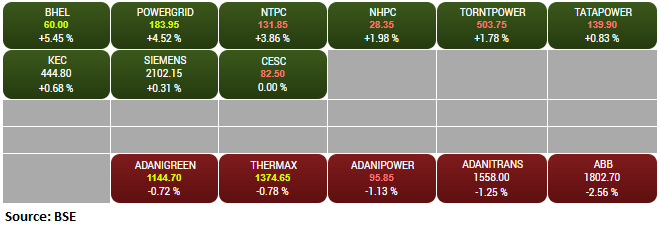
Bharti Airtel, Tech Mahindra, Bajaj Finance, Divis Labs and Bajaj Finserv were among major losers on the Nifty, while gainers were Power Grid Corp, Coal India, NTPC, IOC and BPCL.
BSE midcap and smallcap indices ended lower with each down over 0.5 percent.
On the sectoral front, the IT and realty indices fell 2-3 percent, while power, oil & gas and metal indices ended in the green.
Precious metals prices rose on Monday morning session, owing to rising safe-haven demand as a result of China's Evergrande Group's contagion risk. The gold surge, however, was short-lived, as the dollar index rose and global bond yields rose, pushing prices lower.
If Evergrande's and China's nerves continue to relax, gold is likely to face headwinds once more. After the Fed changed its stance on bond buying in the coming months, gold is now trading at $1740, down considerably from this month's high of $1836.9. US 10-year T-note yield and 10-year German bund yield rose to 2-3/4 month highs on Monday which pushed also gold prices lower.
Although, Gold is likely to find support from worldwide spread of the delta Covid variant which is likely to crimp the global economic recovery. The overall number of global Covid cases have now surged past 232 million despite the ongoing mass inoculations in several countries.
Gold prices are projected to continue their short-term downward trend when trading below the 20-day EMA of $1770 and the 50-day EMA of $1790, with immediate support seen around $1736-$1727.
Benchmark indices erased some of the losses but still trading lower with Nifty around 17700.
The Sensex was down 498.86 points or 0.83% at 59,579.02, and the Nifty was down 129.60 points or 0.73% at 17,725.50. About 1246 shares have advanced, 1754 shares declined, and 127 shares are unchanged.

Gold prices fell to a 1-1/2-month low on Tuesday, as firmer dollar and soaring U.S. Treasury yields dented the metal's safe-haven appeal, amid more signals emerging that the U.S. Federal Reserve could be shifting towards tighter policy.
Indian equity benchmarks traded in red in the afternoon session, with both Sensex and Nifty trading in red terrain. Domestic sentiments impacted by negative cues from other Asian markets.
Traders were cautious, after the World Bank said that East Asia and Pacific region’s recovery has been undermined by the spread of the Covid-19 delta variant, which is likely slowing economic growth and increasing inequality in the region. Our research suggests that If the market sustains the level of 59,000, we can witness higher levels of 60,450-60,600. If the index slips by this point, it will extend its losses.


