


The Nifty 50 had another bullish week ended July 5, continuing the positive momentum from June. During the week, it gained 1.3 percent and closed above the significant 24,300 mark. The index confirmed a breakout from the rising channel that had been in place for several months. The breakout target was around 24,200-24,400, and the index reached a high of 24,401 last week. Notably, despite a negative opening last Friday, the index closed in the green, signalling strong market resilience.
A key metric, the foreign institutional investors' (FIIs) long-short ratio in index futures, has surged to 84 percent, the highest in months. This indicates a heavy leaning towards bullish positions, suggesting potential for significant profit booking in the near term. Traders are advised to close their short-term long positions to capitalize on these gains. Immediate support levels are identified in the 24,000-23,800 range, but even a minor dip could significantly impact individual stocks. If the index surpasses 24,400, the rally could extend to higher levels; however, it's prudent to book full profits even in that scenario. This strategy aims to mitigate risks associated with the current bullish extremities in the market.
In the Nifty Bank index, the market experienced a relatively narrow trading range of about 1,200 points. The weekly low was approximately 51,996, and the high reached 53,357. By the end of the week, the index managed to close in the green, recording a modest gain of 0.61 percent. The index encountered resistance in the 53,000-53,400 zone and subsequently experienced a minor pullback to the 52,600 level. This movement resulted in a Doji candlestick pattern, often indicative of market indecision. Looking forward, a sustained move above 53,400 could extend the rally towards the 54,000 mark, signalling further bullish momentum. Conversely, a daily close below 52,000 could confirm a temporary top for the index, suggesting potential downward pressure. This dual scenario highlights the importance of these key levels for traders, as a break in either direction could significantly influence market sentiment and subsequent trading strategies.
Here are three buy calls for short term:
HDFC Life Insurance Company | CMP: Rs 607.35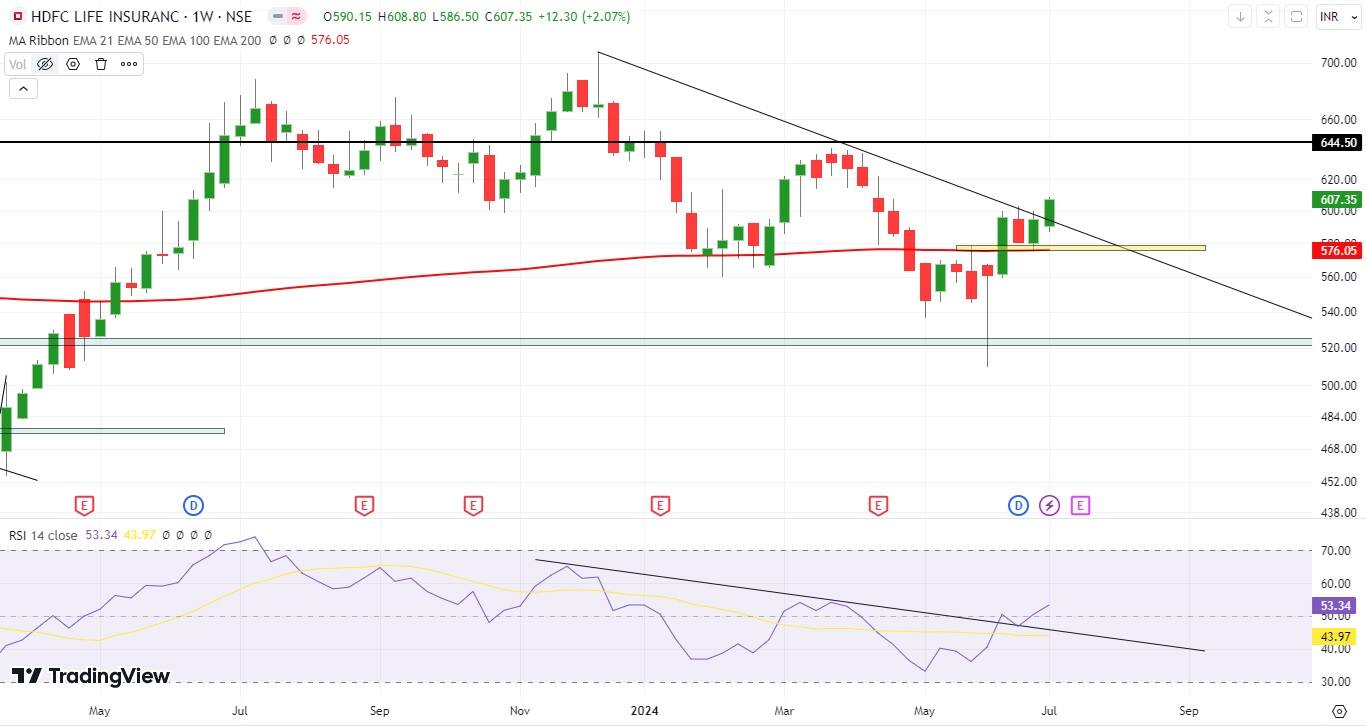
HDFC Life recently gave a clean breakout on the weekly chart, signalling a potential bullish trend. Prior to this breakout, the stock had been consolidating for 2 weeks, precisely around the 200 Exponential Moving Average (EMA) on the weekly scale. This consolidation phase built a solid foundation for the subsequent breakout. The stock managed to close above the last three weeks' high of Rs 603 and is currently positioned near Rs 607 mark. Additionally, there have been significant violations of bearish trendlines, both in the price action and in the Relative Strength Index (RSI) on the weekly chart. These trendline breaches, which persisted over the past six months, further reinforce the bullish outlook for HDFC Life. Based on this analysis, we recommend going long on HDFC Life within the price range of Rs 595-610.
Strategy: Buy
Target: Rs 660
Stop-Loss: Rs 575
Cipla | CMP: Rs 1,509.9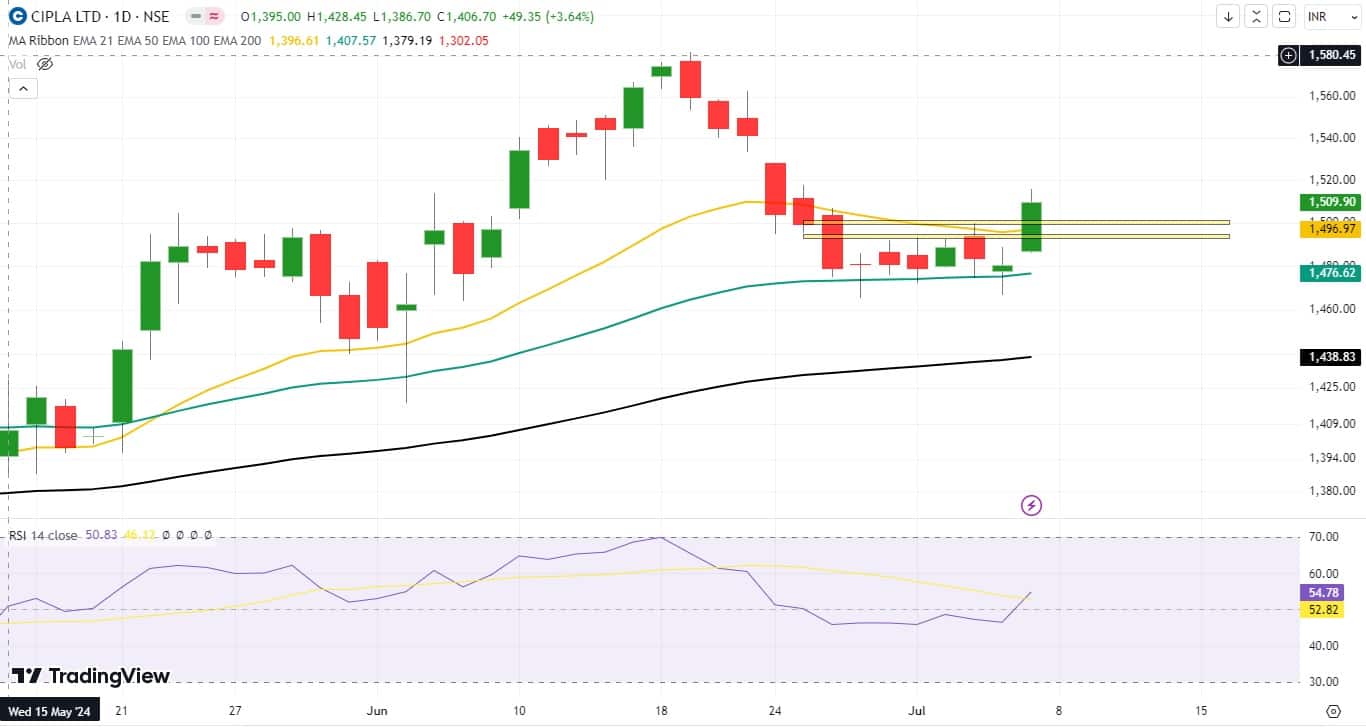
Cipla recently displayed a clean breakout on the daily chart, signalling a potential bullish trend. Prior to this breakout, the stock had been consolidating for 7 days, precisely on the 50-day DEMA on the daily scale. This consolidation phase built a solid foundation for the subsequent breakout. The stock managed to close above the last seven days high of Rs 1,500 and is currently positioned near Rs 1,510 mark. Additionally, daily RSI has reversed from 40 levels and currently placed near 55 levels which is positive sign for Cipla. Based on this analysis, we recommend going long on Cipla within the price range of Rs 1,500-1,510.
Strategy: Buy
Target: Rs 1,600
Stop-Loss: Rs 1,460
SJVN | CMP: Rs 142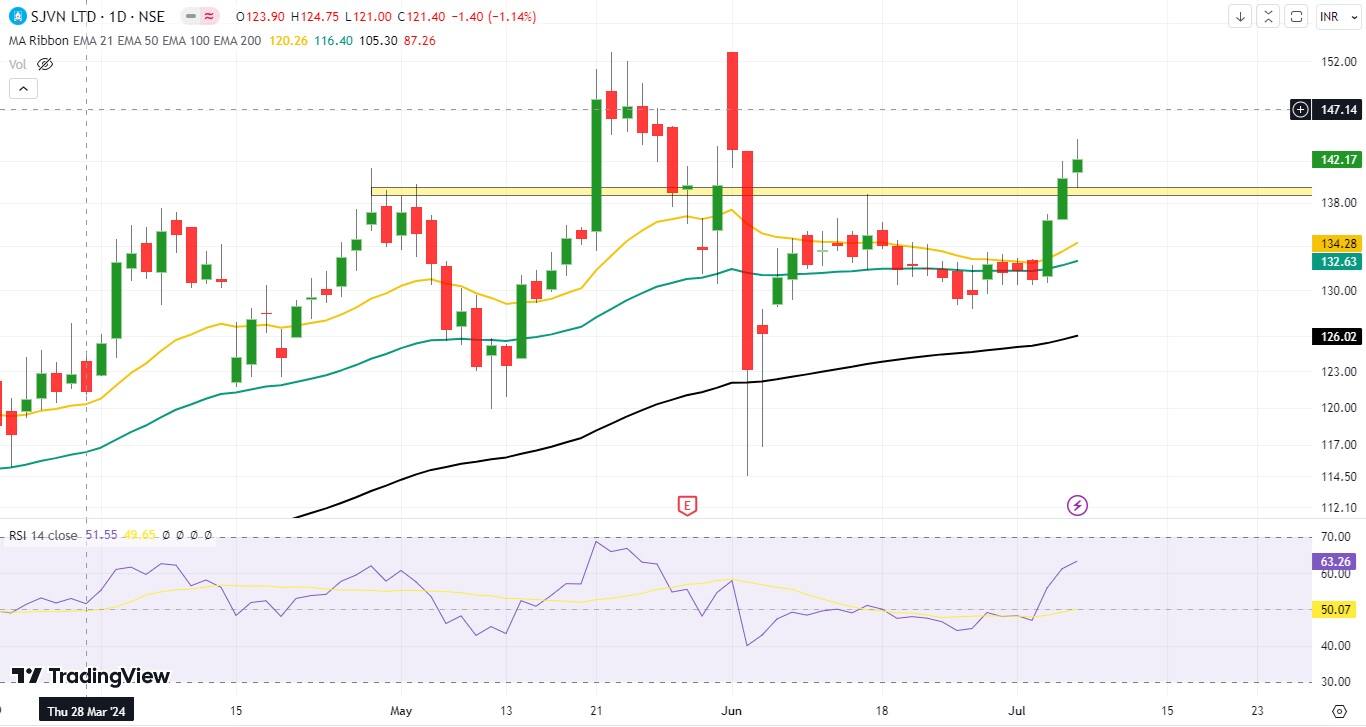
SJVN recently experienced a breakout on the daily chart, indicating a potential bullish trend. Before this breakout, the stock had been consolidating for 18 days, precisely on the 50-day DEMA on the daily scale. This consolidation phase created a solid foundation for the subsequent breakout. The stock closed above the 18-day high of Rs 139 and is currently positioned near Rs 142. Additionally, the daily RSI has reversed from 40 and is now near 60, which is a positive indicator for SJVN. Based on this analysis, we recommend taking a long position on SJVN within the price range of Rs 140-142.
Strategy: Buy
Target: Rs 155
Stop-Loss: Rs 134
Disclaimer: The views and investment tips expressed by investment experts on Moneycontrol.com are their own and not those of the website or its management. Moneycontrol.com advises users to check with certified experts before taking any investment decisions.
Discover the latest Business News, Sensex, and Nifty updates. Obtain Personal Finance insights, tax queries, and expert opinions on Moneycontrol or download the Moneycontrol App to stay updated!
Find the best of Al News in one place, specially curated for you every weekend.
Stay on top of the latest tech trends and biggest startup news.


