


On the weekly chart, prices have given a breakout of Inside Bar Candlestick pattern while maintaining Higher High, Higher Low formation.
Prices on daily timeframe are protecting the Gap prudently which was created on October 18, and have sustained above prior week high.
RSI (relative strength index) on the daily timeframe is rising while forming Higher High, Higher Low with the price trend. This reflects the rising momentum with the price.
The index has its immediate support placed at the level of 17,328 (Gap support) followed by 16,800 (key support). On the other hand, the resistance is placed at the level of 17,770 (multiple touch point) followed by 17,920 (swing high).
Looking at the overall chart pattern, we feel that the trend of the Nifty may remain sideways between 17,770 – 16,800. The index can only witness a trending phase if 17,770 is surpassed on the upside or 16,800 is breached on downside.
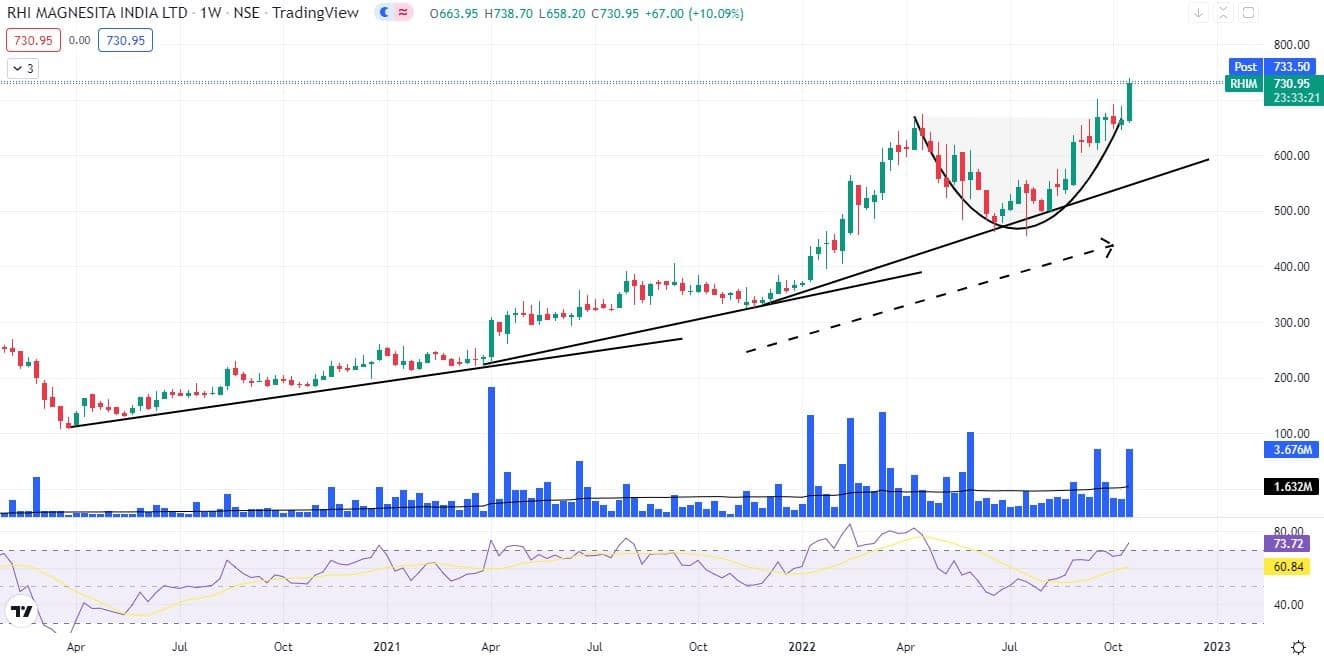
Here are three buy calls for next 2-3 weeks:RHI Magnesita India: Buy | LTP: Rs 731 | Stop-Loss: Rs 646 | Target: Rs 880 | Return: 20 percentLooking at the broader picture of RHIM, we can spot that the overall trend is on the upside. While the steepness of the trend line is rising this tells that the underlying trend is accelerating for an up move.
In the latest week prices have given a breakout from the Rounding bottom pattern hinting towards the continuation of the prior uptrend.
While volumes are rising with the price trend shows that the demand is pushing prices higher.
Prices are continuously hovering around the upper Bollinger band which manifests in the rising volatility of the prices for the continuation of the uptrend.
RSI plotted on the weekly timeframe has shown a positive reversal reflecting the rising momentum in the prices.
Going ahead we expect the prices to go higher till the level of Rs 880 where stop-loss must be Rs 646 strictly on the closing basis.
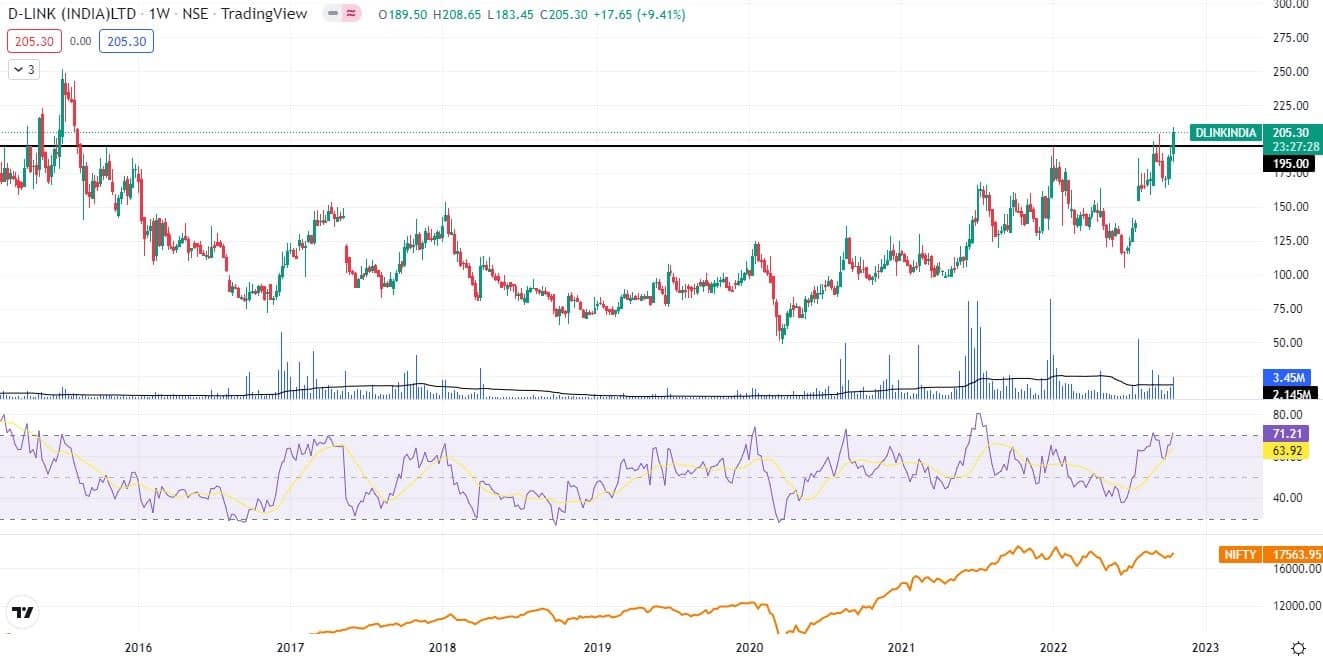
Looking at the broader picture of D-Link, we can observe that the stock is coming out of 6 years price range, this shows that the prices are attempting to move higher.
The range breakout was preceded by an unfilled Gap, which can be considered as the breakaway gap.
Post-January 2022, the correction that D-Link witnessed was listless as the stock did not get into Lower Low, Lower High formation, pointing towards its strong relative strength against benchmark index Nifty.
The stock has sustained well above the 36-week moving average, confirming the uptrend. The EMA (exponential moving average) has acted as a strong variable support for the price swings.
RSI is sustaining above 50 mark on both daily as well as on the weekly timeframe reflecting the strong momentum built up in the stock.
Going ahead we expect the prices to go higher till the level of Rs 250 where the stop-loss must be Rs 175 on the closing basis.
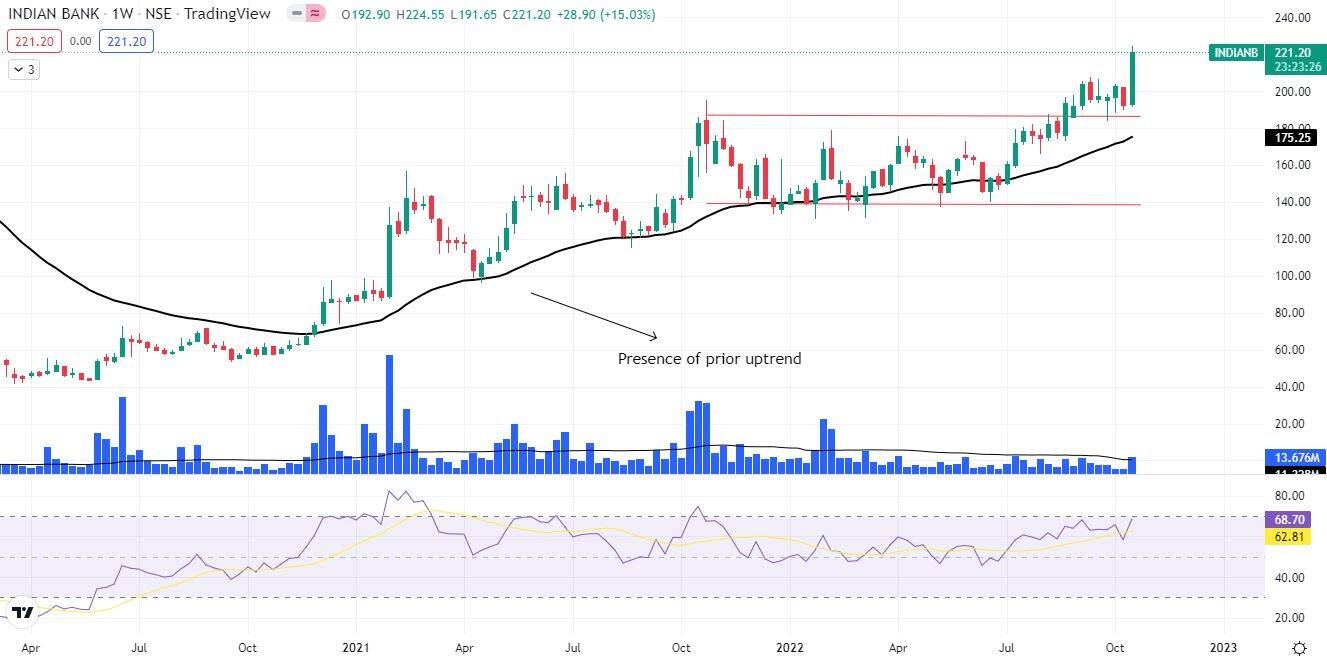
Indian Bank has formed a new 52-week high this week, which shows that the stock already is in strong momentum.
The stock now has started to climb post the breakout of Rectangle pattern in August 2022. This indicates the continuation of prior uptrend.
On the Indicator Front, this counter is above all its crucial moving averages of 50, 100, 200 days EMA which confirms the intact uptrend.
RSI on the weekly timeframe is showing range shift reflecting rising momentum in the prices.
Going ahead we expect the prices to go higher till the level of Rs 270 where the stop-loss must be Rs 195 on the closing basis.

Discover the latest Business News, Sensex, and Nifty updates. Obtain Personal Finance insights, tax queries, and expert opinions on Moneycontrol or download the Moneycontrol App to stay updated!
Find the best of Al News in one place, specially curated for you every weekend.
Stay on top of the latest tech trends and biggest startup news.


