


Since April 5, Nifty50 has been trading in a lower high, lower low formation. Whenever the Nifty levels retraced near the 21–day exponential moving average, which is placed at 15,880 levels, there was a strong resistance and the index drifted lower.
If we closely observe the pattern in the past three months, there have been three occasions when the prices witnessed a massive gap down opening and post that we saw partial retracement gap filling, after which the index again resumed its downward journey.
On June 29, the benchmark index witnessed a gap down opening of almost 150 points and formed an intraday low of 15,688 in its first 15 minutes candle and post that index never looked back and traded in a small steps higher bottom formation and closed at 15,800 levels with a loss of half percent.
Momentum oscillator RSI (relative strength index - 14) on the daily chart has shown an immediate bounce from 30 levels and is currently at 45 but the initial trend on the weekly RSI indicates a sell-on rally market as it is still reading in a lower bottom formation.
We feel that the current trend in Nifty is bearish to rangebound between 16,000 and 15,500. If the Nifty breaches below 15,500 levels, prices may drag till 15,200 levels. Our bearish view will be negated if Nifty closed above 16,050 levels.
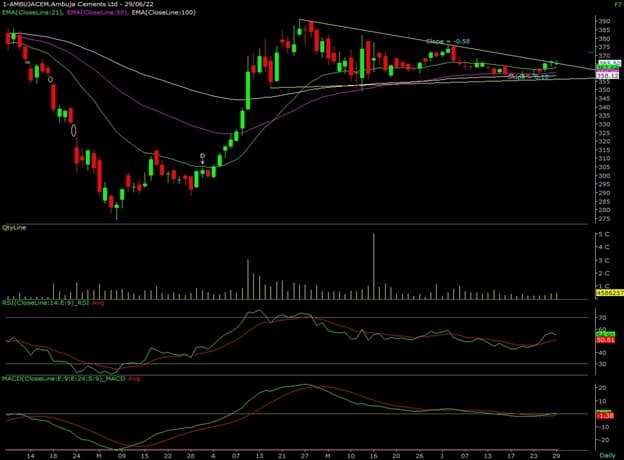
Here are two buy calls for next 2-3 weeks:Ambuja Cements: Buy | LTP: Rs 365.50 | Stop-Loss: Rs 354 | Target: Rs 383.50 | Return: 5 percentIn the past more than two months, Ambuja Cements is trading within a very narrow range and has formed a symmetrical triangle formation on the daily time frame.
The stock is continuously outperforming the benchmark index on the relative basis, where index is forming a lower low and the counter is trading completely sideways without disturbing its prior move.
The prices are trading above its 50-day exponential moving average (DEMA) on the daily as well as on the weekly chart and the levels for the daily is placed at Rs 360 & Rs 353 on the weekly.
Based on the above technical set up, we are expecting an outperformance in the stock as the overall cement sector is showing a bottom reversal formation.
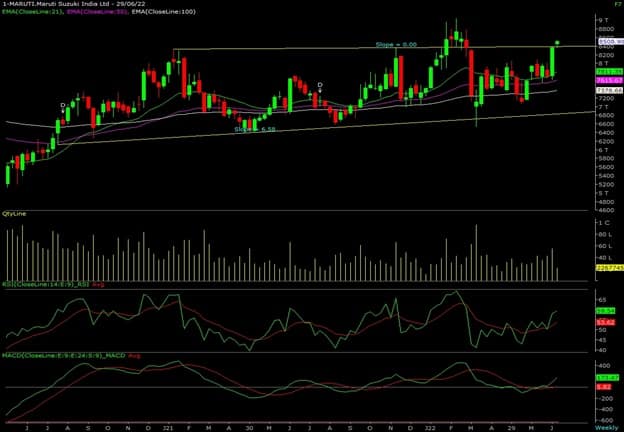
Maruti on the daily chart has given a rectangle pattern breakout and post that prices are continuously showing strength on the higher side with positive up lift.
The prices have made one attempt to break out of consolidation box during February 2022 but it failed and again drifted lower towards the lower levels of the pattern. In this current prices have again made a successful attempt of the breakout and prices are trading above its trend line resistance.
The counter is strongly settled above its 21 & 50–DEMA which is placed at Rs 8,024 and Rs 7,860 levels respectively. Recently the RSI has also witnessed a range breakout above 60 levels with positive crossover on the daily time frame.

Discover the latest Business News, Sensex, and Nifty updates. Obtain Personal Finance insights, tax queries, and expert opinions on Moneycontrol or download the Moneycontrol App to stay updated!
Find the best of Al News in one place, specially curated for you every weekend.
Stay on top of the latest tech trends and biggest startup news.


