


After sharp rise on last Friday, the Nifty witnessed profit booking on Monday on the back of weak global cues, falling 89 points to 17,765.
The short-term trend of the Nifty remains positive as the index trades above its five-day EMA (exponential moving average). FIIs long to short ratio in the Index Future is placed at an oversold levels of 0.23 and therefore there is a higher probability of short covering by them from hereon.
The formation of long lower shadows in the last few daily candles around 200-day EMA (currently placed at 17,560) indicates strong base for the Nifty around that level which is unlikely to be broken on the downside soon. Therefore, on the downside, 17,500 could now be considered as an immediate support for the Nifty and one should remain bullish with stop-loss of 17,500 level.
On the upside, 17,980-18,050 could act as an immediate resistance for Nifty. We may see upside momentum once Nifty manages to surpass downward sloping trendline resistance of 18,050 convincingly. Technical setup of global equity market is bullish, which augers well for the Indian markets as domestic event like union budget is behind us.
NSE Midcap and Smallcap indices have started to form near term bottom reversal at the key lower supports. The upside momentum is expected to pick up in the broader markets soon.
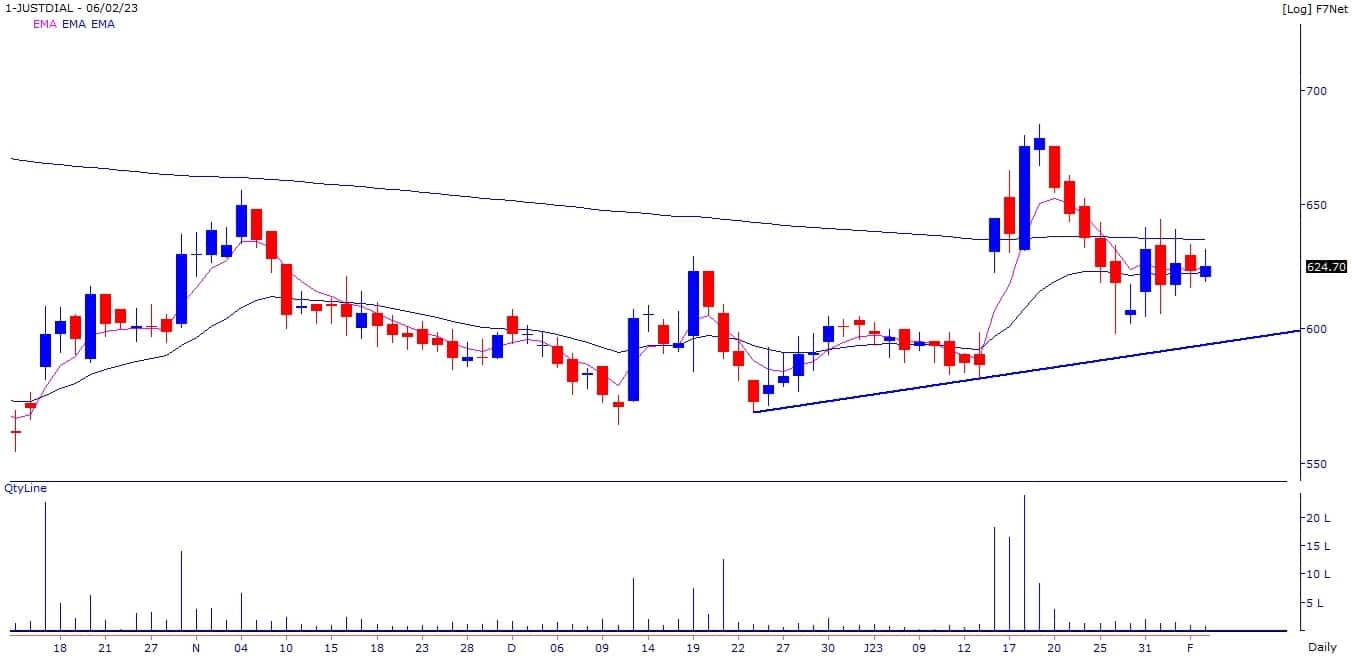
Here are three buy calls for the next 3-4 weeks:Just Dial: Buy | LTP: Rs 624.7 | Stop-Loss: Rs 595 | Target: Rs 668-690 | Return: 10 percentAccumulation was seen in the stock since January 16 where volumes are sharply higher on up days as compared to down days. Short term trend of the stock is positive as stock price is trading above its 5 and 20-day EMA.
Momentum Oscillators - RSI (relative strength index - 11) and MFI (money flow index - 10) is sloping upwards and placed above 50 on the weekly chart, indicating relative strength in the stock.
The stock price is likely to gather momentum in the upside once it manages to close above recent resistance of Rs 642 odd levels.
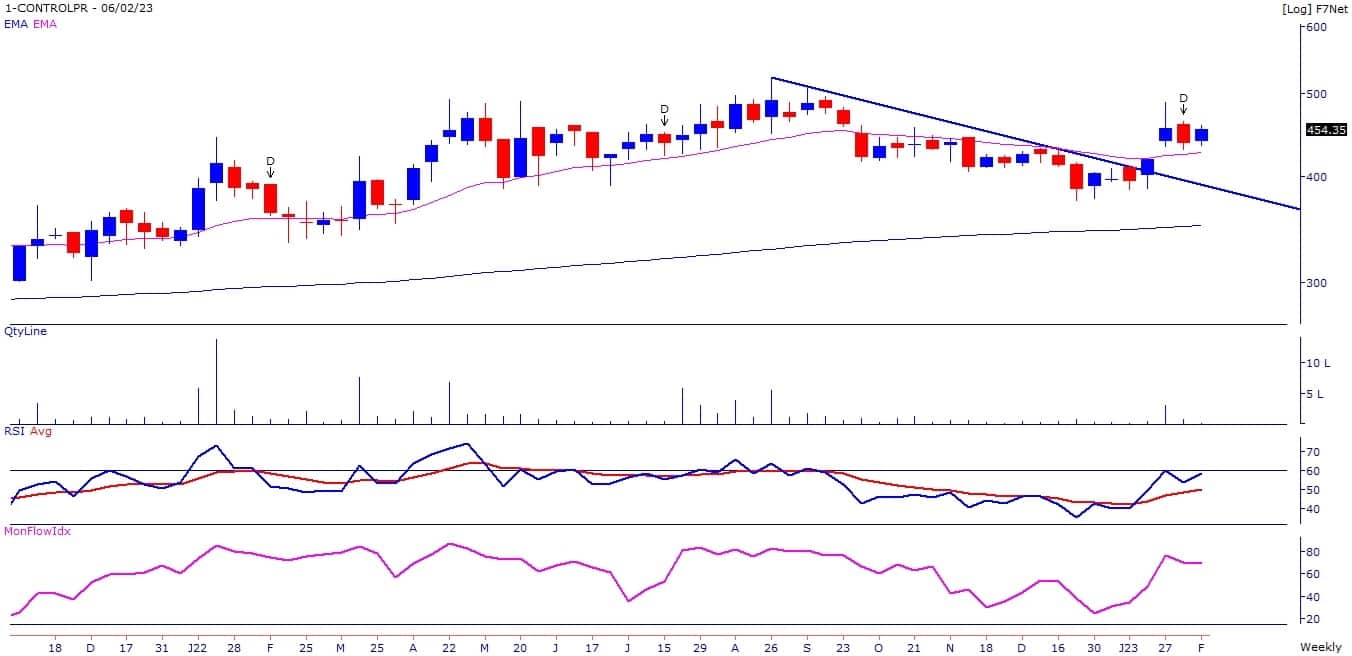
the stock price has broken out on the weekly chart from the downward sloping trendline, adjoining the weekly highs of August 26, 2022 and September 9, 2022.
Primary trend of the stock is positive as stock price is trading above its 100 and 200-day EMA. Momentum Oscillators - RSI (11) and MFI (10) is sloping upwards and placed above 50 on the weekly chart, indicating strength in the stock.
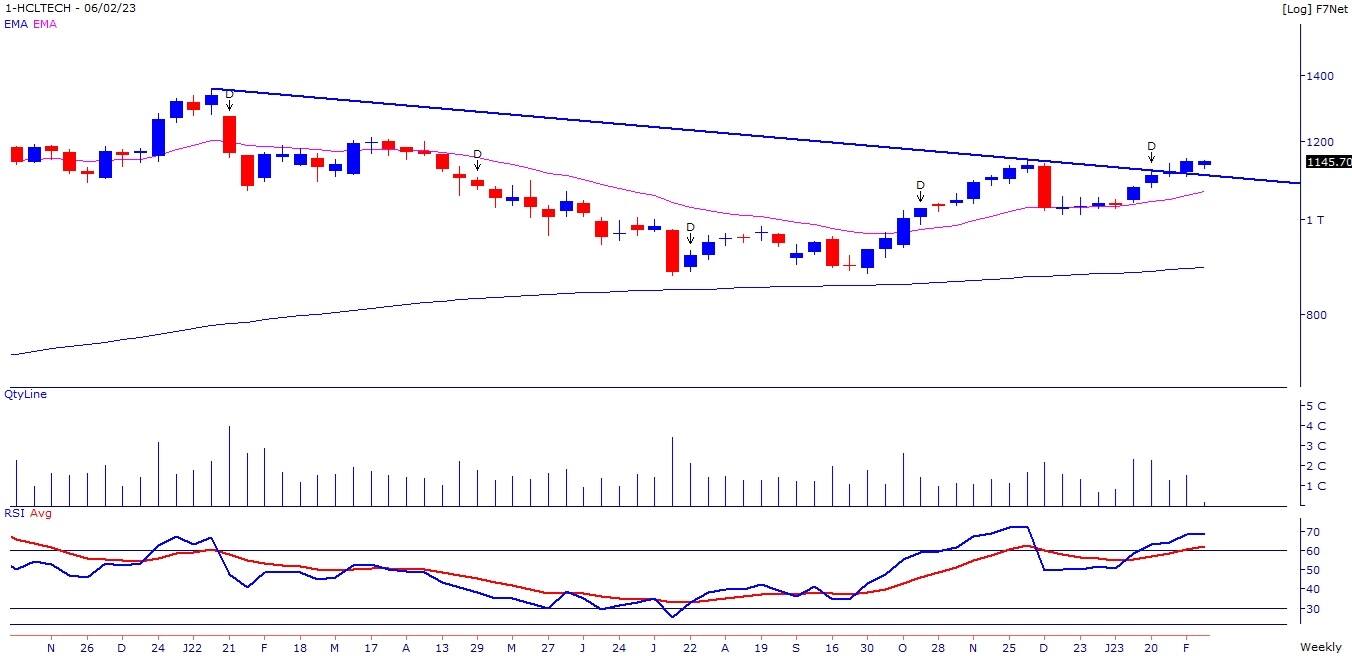
The stock price has broken out on the weekly chart from the downward sloping trendline, adjoining the weekly highs of January 14, 2022 and December 2, 2022.
In the month of December, stock price has formed strong base around 200-day EMA. Plus DI (directional indicator) is trading above minus DI while ADX (average directional index) line is placed above 20, indicating momentum in the current uptrend.

Discover the latest Business News, Sensex, and Nifty updates. Obtain Personal Finance insights, tax queries, and expert opinions on Moneycontrol or download the Moneycontrol App to stay updated!
Find the best of Al News in one place, specially curated for you every weekend.
Stay on top of the latest tech trends and biggest startup news.


