


The Nifty had a disappointing week for the bulls as they failed to push prices to new highs despite multiple attempts. The index ended the week on June 23 with a loss of 0.85 percent to close just above 18,650 level.
From a technical standpoint, there is a clear hurdle formed around 18,880 levels, accompanied by a bearish gap seen on the daily chart after a long time. The bullish momentum has slowed down in the short term, and prices have closed just above a crucial support level.
Also, prices ended slightly above the 20EMA (exponential moving average 18,641), which has previously acted as a strong barrier against any corrections. This level coincides with a trigger point of "bearish double top" pattern observed on the hourly chart.
In our opinion, for the bulls to regain control, the upward movement should start from the current levels. However, if the levels of 18,600-18,650 are breached, then we might witness further price correction towards 18,500-18,450 levels. On the other hand, the bearish gap around 18,750 will now act as immediate resistance, followed by the all-time high level at 18,888.
Having said that, traders should note that the higher time frame charts continue to look intriguing and suggesting that any future price or time-wise correction should be seen as a buying opportunity for those who missed the upward trend in the past few months.
Here are three buy calls for short term:
Dr Reddy's Laboratories: Buy | LTP: Rs 4,994 | Stop-Loss: Rs 4,820 | Target: Rs 5,300 | Return: 6 percent
Dr Reddy's has seen strong buying traction in the last trading session, which led to a V-shaped recovery along with a breakout on a closing basis, signifying positive development in the counter.
On a technical aspect, the stock has seen a ‘Pennant’ formation on the daily time frame, adding to the bullish quotient. The stock looks well verse to continue its upwards journey in the comparable period.
Hence, we recommend buying Dr Reddy's in the range of Rs 4,980-5,000, with a stop-loss of Rs 4,820 and target of Rs 5,300.

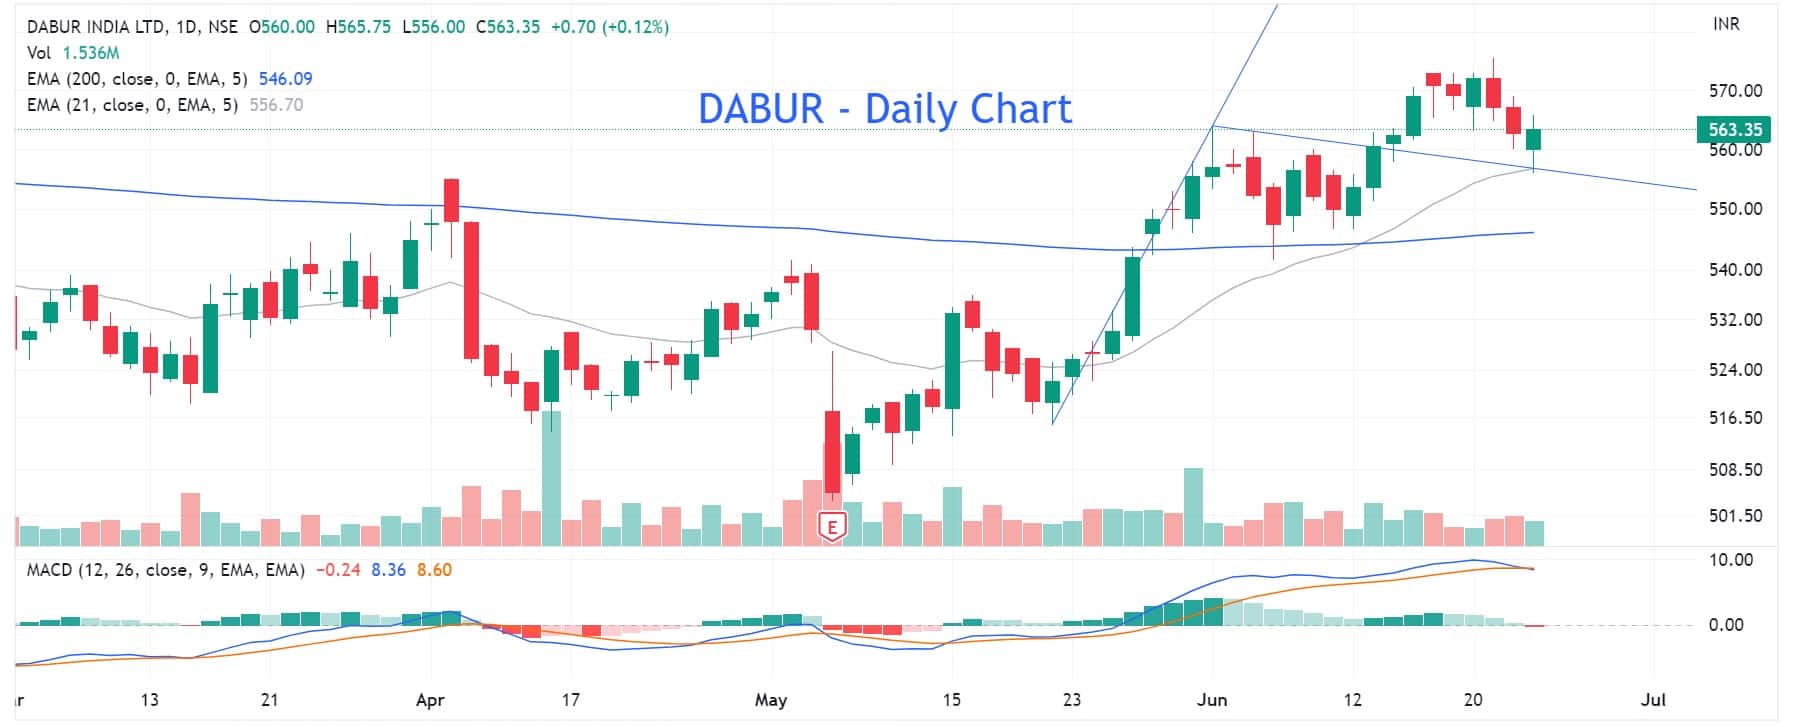
Dabur India: Buy | LTP: Rs 563.35 | Stop-Loss: Rs 540 | Target: Rs 595 | Return: 5.6 percent
Dabur witnessed a strong breakout in the previous trading week and surpassed the 200 SMA (day simple moving average). Post the breakout the stock underwent a correction to re-test the neckline, which coincides with the 21 DEMA on the daily chart, suggesting a re-entry point for the bullish formation.
The primary technical indicators align with the trend suggesting a continuation of the movement in a comparable period.
Hence, we recommend buying Dabur at around Rs 560, with a stop-loss of Rs 540 and target of Rs 595.

Discover the latest Business News, Sensex, and Nifty updates. Obtain Personal Finance insights, tax queries, and expert opinions on Moneycontrol or download the Moneycontrol App to stay updated!
Find the best of Al News in one place, specially curated for you every weekend.
Stay on top of the latest tech trends and biggest startup news.


