


Bulls retained their reign on Dalal Street for the third week in a row, continuing with a higher-high formation, and charging the benchmark Nifty 50 to a historic high of 22,420. The index found support in the 10-week exponential moving average to end with 0.75 percent gains at a new closing high of 22,378 for the week ended March 2.
Experts expect the momentum to sustain in the coming weeks, too, with immediate resistance at 22,500-22,600, followed by the medium-term target of 23,000, provided it holds the upward sloping resistance trendline (adjoining previous record high levels), while the support is placed at 22,200 and 22,000 levels.
Intermittent correction can't be ruled out, experts warned, given the divergence in the momentum indicator RSI (relative strength index) as the price makes higher highs and indicator makes lower highs.
"Any moderate market dip should be viewed as a buying opportunity. A close below the 22,000 level in the upcoming week could signal weakening bullish sentiment, potentially prompting a retest of the 21,800 support level," Jigar S Patel, senior manager for equity research at Anand Rathi, said.
He said the levels to watch out for in the current week would be 22,500 - 22,600 on the higher side, and 22,000 - 21,800 on the lower side. Therefore, he advised traders to monitor the key support and resistance levels closely and remain flexible in their trading strategies.
Rohit Srivastava, founder of Strike Money Analytics and Indiacharts, feels the optimism comes from the new all-time high in the Nifty. "The trendline of the highs gives us a resistance near 22,360 above which the Nifty needs to be able to sustain for a few days before we can qualify it as a sustainable breakout and not a false breakout," he said.
Other than that multiple divergences in indicators like the RSI (relative strength index) make it look like a topping process in the market, he feels.
Moneycontrol collated a list of top 10 stock ideas from experts with 2-4 weeks perspective. The closing price of March 2 is considered for the stock return calculation.
Expert: Shrikant Chouhan, head equity research at Kotak Securities
BPCL: Buy | LTP: Rs 625 | Stop-Loss: Rs 605 | Target: Rs 670 | Return: 7 percent
After the downward trend from the levels of around Rs 680, the bearish trend took a pause. The stock was in a rangebound formation for quite some time, which had emerged as a strong base for reversal in the counter.
Recently the breakout from the symmetrical triangle chart formation on daily scale hints at strong upside movement in the coming trading sessions.

Hindalco Industries: Buy | LTP: Rs 523 | Stop-Loss: Rs 500 | Target: Rs 560 | Return: 7 percent
The counter is in the accumulation zone where it is trading in a rangebound mode for the past few sessions. The texture of the chart formation and technical indicator RSI (relative strength index) is indicating that the counter is very likely to breakout from rectangle formation for a new leg of the up move in the near term.

Bharti Airtel: Buy | LTP: Rs 1,131 | Stop-Loss: Rs 1,085 | Target: Rs 1,210 | Return: 7 percent
On the weekly scale, after the robust up move, the stock is trading in a sideways movement forming a Flag chart pattern. The stock is representing a bullish continuation chart structure which indicates at a new leg of up move is likely to resume from the current levels in the coming horizon.

Expert: Nagaraj Shetti, senior technical analyst at HDFC Securities
Piramal Enterprises: Buy | LTP: Rs 935 | Stop-Loss: Rs 875 | Target: Rs 1,035 | Return: 11 percent
The weekly timeframe chart of Piramal Enterprises indicates a sustainable upside bounce in the previous week and buy on dips opportunity in last week as well. The stock price is currently placed at the edge of breaking above the key moving average hurdles like weekly 10/20-week EMA (exponential moving average) around Rs 920-930 levels respectively.
The medium-term weekly chart pattern is signaling a possible upside breakout of broader range movement. This is positive indication. The volume has started to expand during upside breakout in the stock price in last week and the daily RSI shows positive indication. The overall chart pattern of PEL indicates long trading opportunity.
Buying can be initiated in PEL at CMP (Rs 935), add more on dips down to Rs 900, wait for the upside target of Rs 1,035 in the next 3-5 weeks. Place a stop-loss of Rs 875.

AGI Greenpac: Buy | LTP: Rs 881 | Stop-Loss: Rs 820 | Target: Rs 990 | Return: 12 percent
After showing a rangebound action in the last one month, the stock price AGI has witnessed a sharp upside breakout in last week. The stock price has managed to surpass above the hurdle of down sloping trend line around Rs 825 levels and is currently trading higher. The larger degree higher tops and bottoms is intact as per weekly timeframe chart and the stock price seems to have formed a new higher bottom at Rs 757 in the previous week.
Volume has started to expand during upside breakout in the stock price and weekly RSI shows positive indication. The overall chart pattern of AGI Greenpac indicates long trading opportunity.
One may look to buy AGI Greenpac at CMP (Rs 881), add more on dips down to Rs 850 and wait for the upside target of Rs 990 in the next 3-5 weeks. Place a stop-loss of Rs 820.

Expert: Om Mehra, technical analyst at SAMCO Securities
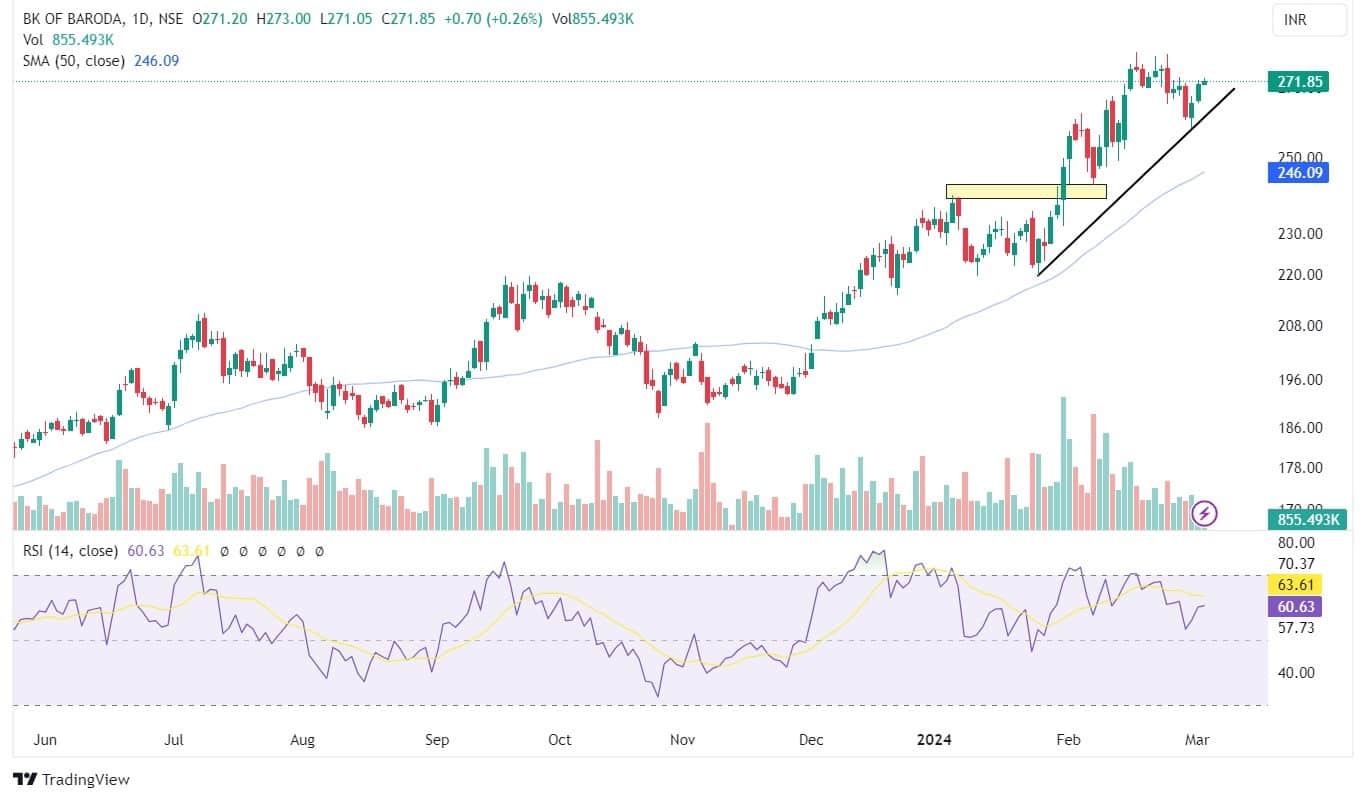
Bank of Baroda: Buy | LTP: Rs 271.8 | Stop-Loss: Rs 259 | Target: Rs 290 | Return: 7 percent
The stock reveals a strong recovery after a notable consolidation, forming a sturdy base in support of a rising trendline. The stock is currently trading above the 20-day SMA (simple moving average), indicating positive momentum.
The daily chart reveals that volume is ticking up with price rise. Moreover, the RSI is gradually inching higher indicating bullishness in stock.
Hence, based on the above technical structure, one can initiate a long position at CMP Rs 271.8 for a target price of Rs 290. The stop-loss can be kept at Rs 259.
NMDC: Buy | LTP: Rs 234.70 | Stop-Loss: Rs 219 | Target: Rs 260 | Return: 11 percent
The stock shifted from an accumulation phase, accentuated by a surge in volume, signalling a robust bullish setup. Significantly, the delivery volume in the last couple of days grown significantly.
The stock actively holds above 50 simple moving averages (SMA) confirming its upward trajectory. The RSI holds firmly the 50 level.
Hence, based on the above technical structure, one can initiate a long position at CMP Rs 234.7, for a target price of Rs 260. The stop-loss can be kept at Rs 219.

Expert: Riyank Arora, technical analyst at Mehta Equities
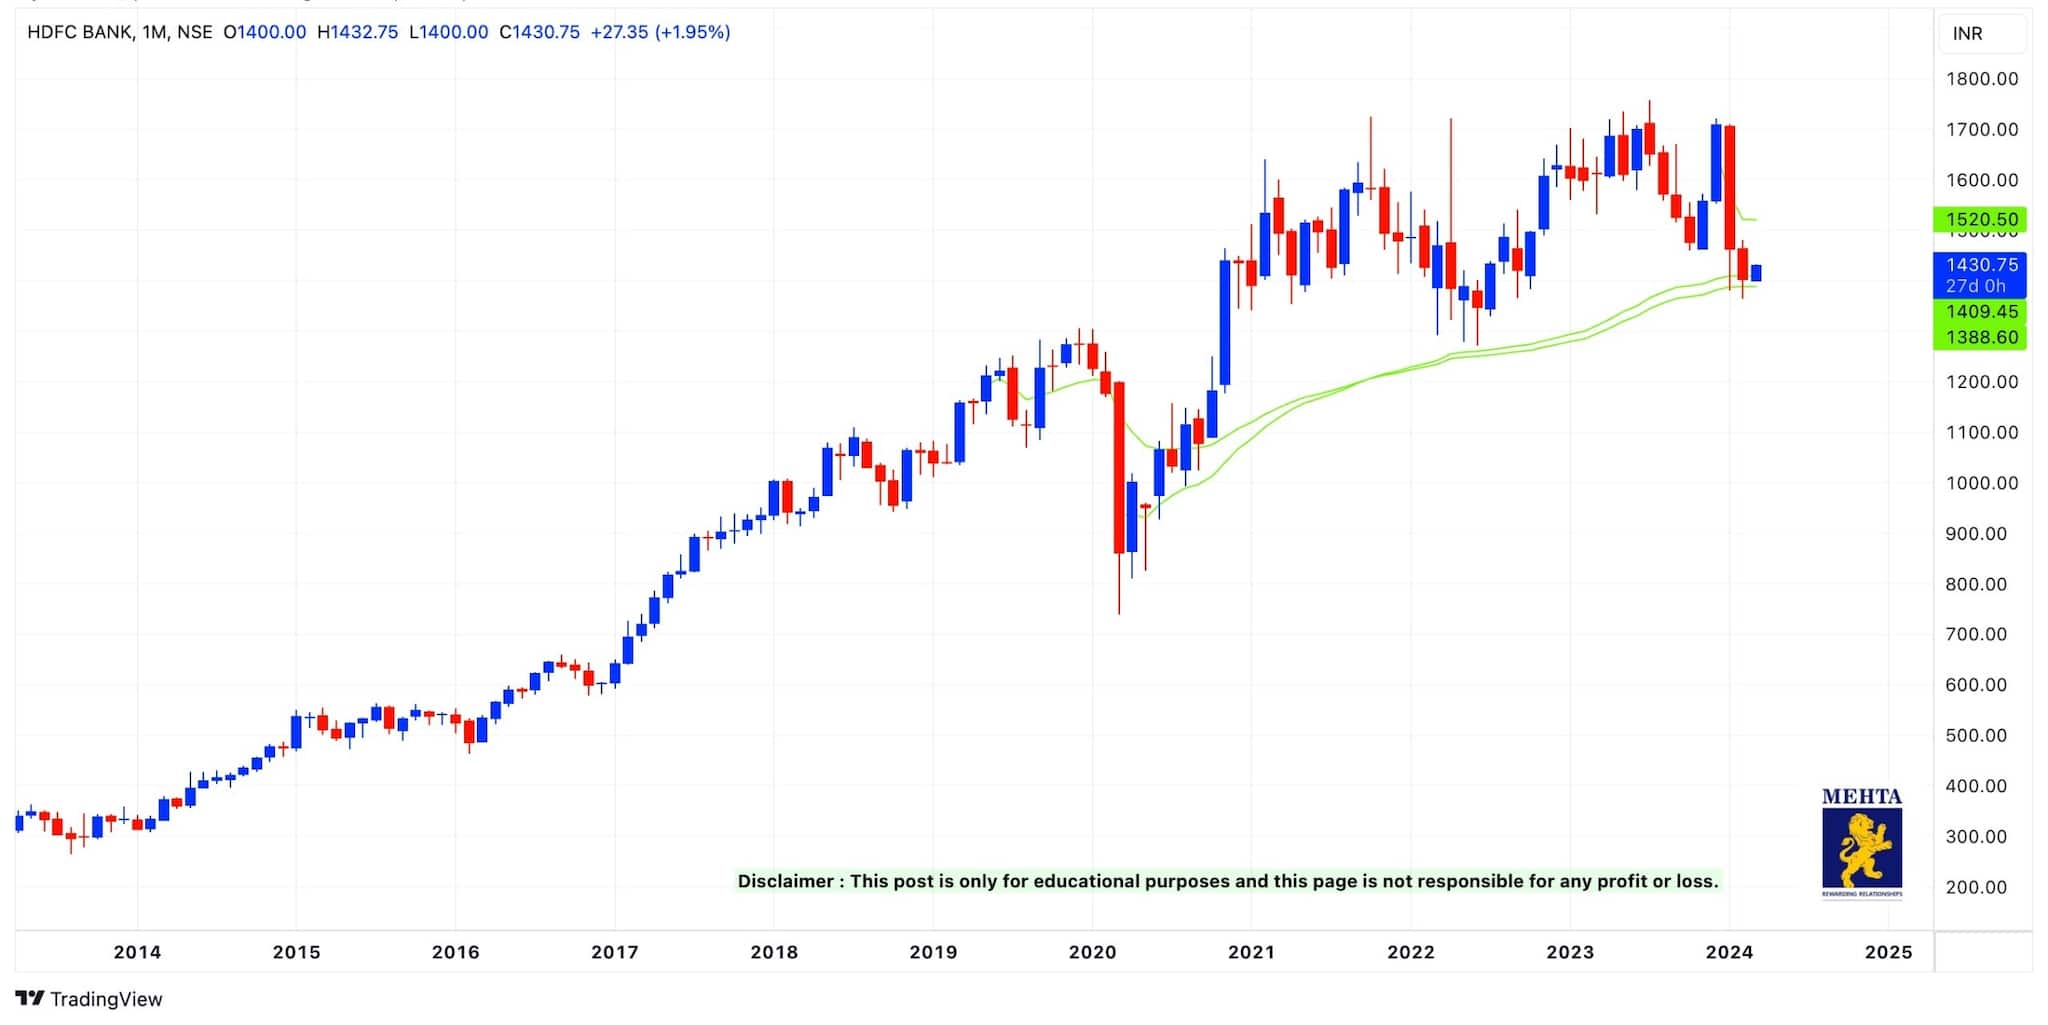
HDFC Bank: Buy | LTP: Rs 1,430.75 | Stop-Loss: Rs 1,350 | Target: Rs 1,520 | Return: 6 percent
The stock has successfully tested its long-term anchor VWAP (volume-weighted average price) support zone. On its daily charts, the stock has continuously tried to find support at Rs 1,380 levels, whereas the Rs 1,460-1,470 zone saw some selling pressure.
With the long-term charts being positive and the price being near anchor VWAP support zones, it is expected that the stock should gradually move above Rs 1,480 and head towards Rs 1,520 mark in the next 3-4 weeks.
Apollo Hospitals Enterprises: Buy | LTP: Rs 6,133 | Stop-Loss: Rs 5,925 | Target: Rs 6,300 and Rs 6,500 | Return: 6 percent
On daily charts, the stock has been moving in an uptrend and successfully touched its trendline in Friday's session. It saw a long wick rejection below the trendline, indicating good buying at lower levels in the stock.
Going forward, Rs 5,940 is going to be a major support for Apollo Hospitals, so a strict stop-loss at Rs 5,925 should be kept for potential upside targets of Rs 6,300 and Rs 6,500 in the next 2-3 weeks.
Expert: Jigar S Patel, senior manager - equity research at Anand Rathi
Kotak Mahindra Bank: Buy | LTP: Rs 1,724 | Stop-Loss: Rs 1,665 | Target: Rs 1,820 | Return: 5.6 percent
Following a peak close to Rs 1,926 level, Kotak Mahindra Bank underwent a substantial decline of around 10 percent in its value. However, in the past month, the bank has established a prolonged bottom around the 1.13 harmonic ratio. Interestingly, a bullish AB=CD pattern has also emerged near the aforementioned ratio, providing further bullish confirmation.
Additionally, on the indicator front, there is a bullish divergence observed on the daily stochastic (please refer to the chart), indicating a positive outlook for the stock. Consequently, one may consider buying in the range of Rs 1,705-1,730 with an upside target of Rs 1,820 and a stop-loss set at Rs 1,665.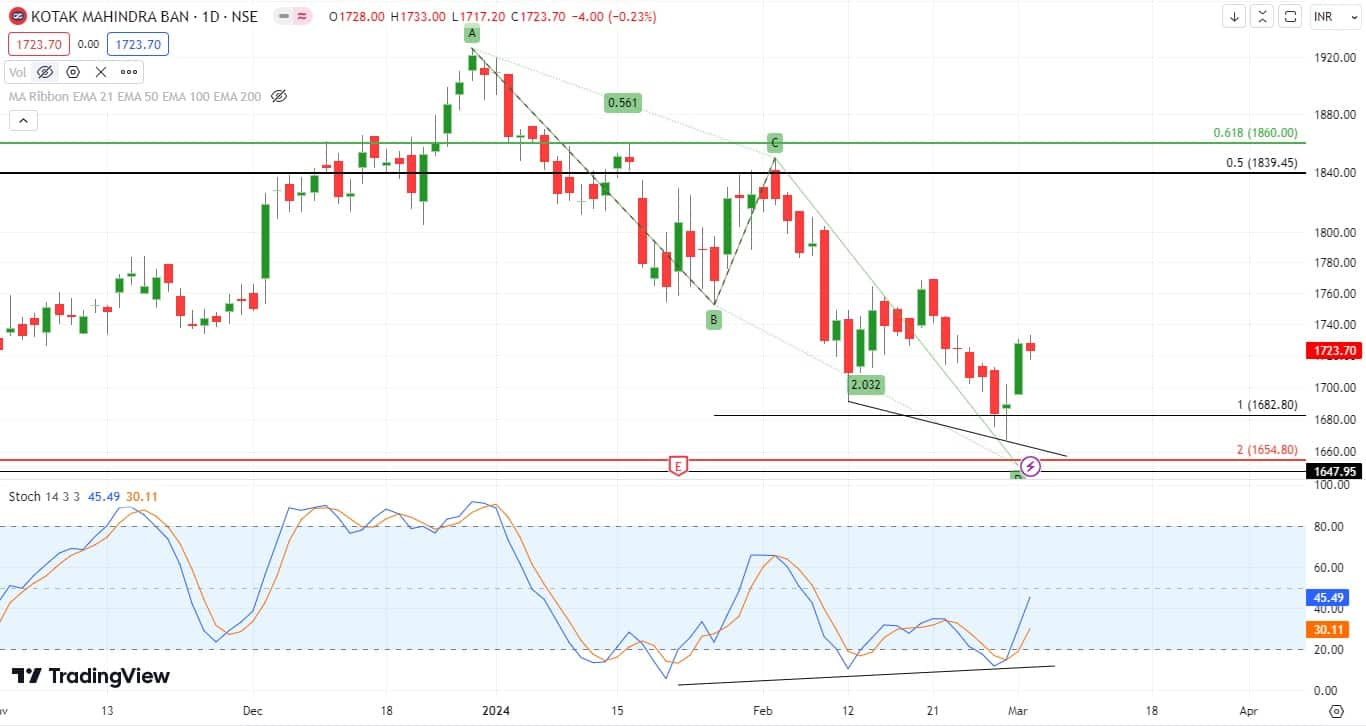
Disclaimer: The views and investment tips expressed by investment experts on Moneycontrol.com are their own and not those of the website or its management. Moneycontrol.com advises users to check with certified experts before taking any investment decisions.
Discover the latest Business News, Sensex, and Nifty updates. Obtain Personal Finance insights, tax queries, and expert opinions on Moneycontrol or download the Moneycontrol App to stay updated!
Find the best of Al News in one place, specially curated for you every weekend.
Stay on top of the latest tech trends and biggest startup news.


