


Bulls took full control over Dalal Street since later part of the last week and pushed the benchmark indices to uncharted territory on June 30 as we have seen buying across sectors with strong lifting from banking and financial services and technology stocks.
The Nifty50 has seen a breakout of upward sloping resistance trendline adjoining previous record high levels (October 2021 and December 2022) in the opening itself on Friday and remained above the same throughout session. The index jumped 2.8 percent to end at record closing high of 19,189 and formed robust bullish candlestick pattern on the weekly charts, with maintaining higher highs for 14th straight session.
Even the momentum indicator RSI (relative strength index) gave bullish crossover on all timeframes, which is a positive sign. Hence, the index is likely to march towards 19,300-19,500 levels in coming days, as long as it holds 19,000 mark, which is an immediate support, then 18,800 levels, experts said.
"Price-wise, we can clearly see a configuration of ‘V’ pattern which has been broken out in the upward direction. The theoretical target of this is much higher but with the short to medium term view, we continue to remain upbeat on the market," Sameet Chavan, Head Research, Technical and Derivatives at Angel One said.
As far as levels are concerned, he feels the Nifty can be heading towards 19,350 – 19,500 in the forthcoming week. However, one needs to be very selective going ahead because the low hanging fruit is gone for the momentum traders, he advised.
In between, "we may see bout of profit booking, but the directional bias remains strongly bullish till the time 18,600 is not violated. Before this, 19,000 followed by 18,800 are to be seen as key supports," Sameet said.
Looking ahead, Arvinder Singh Nanda, Senior Vice President of Master Capital Services also feels the Nifty prices seem poised to continue their upward trajectory towards the levels of 19,400 and 19,500. In the event of any correctional fall, approximately around the 19,000 mark, it may present an opportunity to initiate fresh long positions, he said.
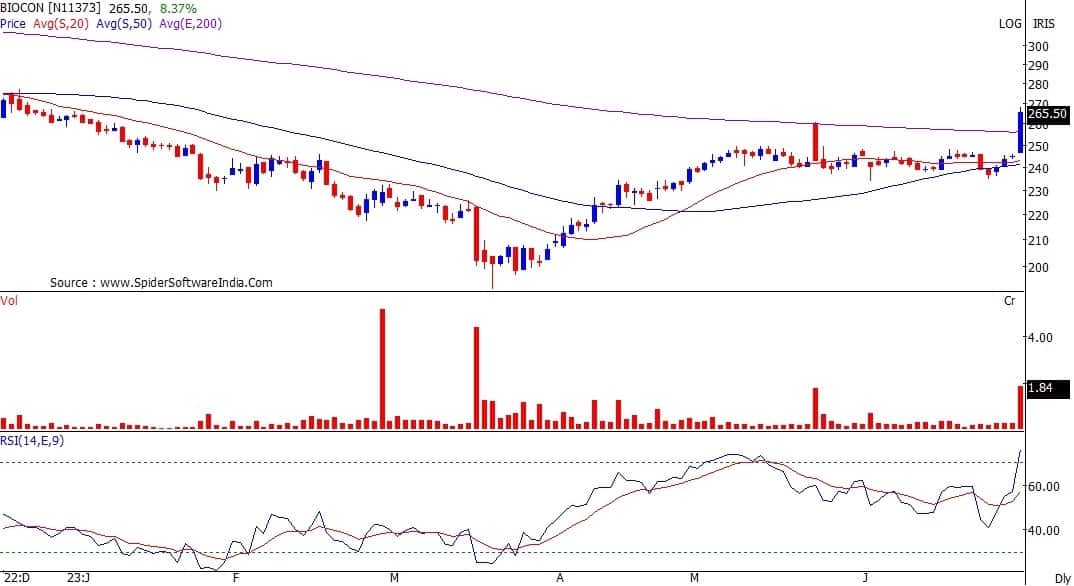
Here’s a look at the top 10 trading ideas by experts for the next three-four weeks. Returns are based on June 28 closing prices:Expert: Subash Gangadharan, Senior Technical & Derivative Analyst at HDFC SecuritiesBiocon: Buy | LTP: Rs 265.50 | Stop-Loss: Rs 238 | Target: Rs 320 | Return: 20.5 percentAfter correcting from an intermediate high of Rs 295 tested in November 2022, Biocon found support around Rs 191 levels in March 2023. These are strong supports as they also roughly coincide with previous intermediate lows.
The stock has since then been climbing higher and making higher bottoms in the process. This week, the stock also broke out of its recent trading range on the back of above average volumes, indicating it is set to move higher in the coming weeks.
Technical indicators are giving positive signals as the stock is trading above the 20 and 50-day SMA (small moving average). Momentum readings like the 14-week RSI (relative strength index) too are in rising mode and not overbought, which implies potential for further upsides.
With the intermediate technical setup too looking attractive, we expect the stock to move up towards its previous intermediate highs in the coming weeks. Buy between Rs 263-267 levels, with a stop-loss at Rs 238 and target at Rs 320.
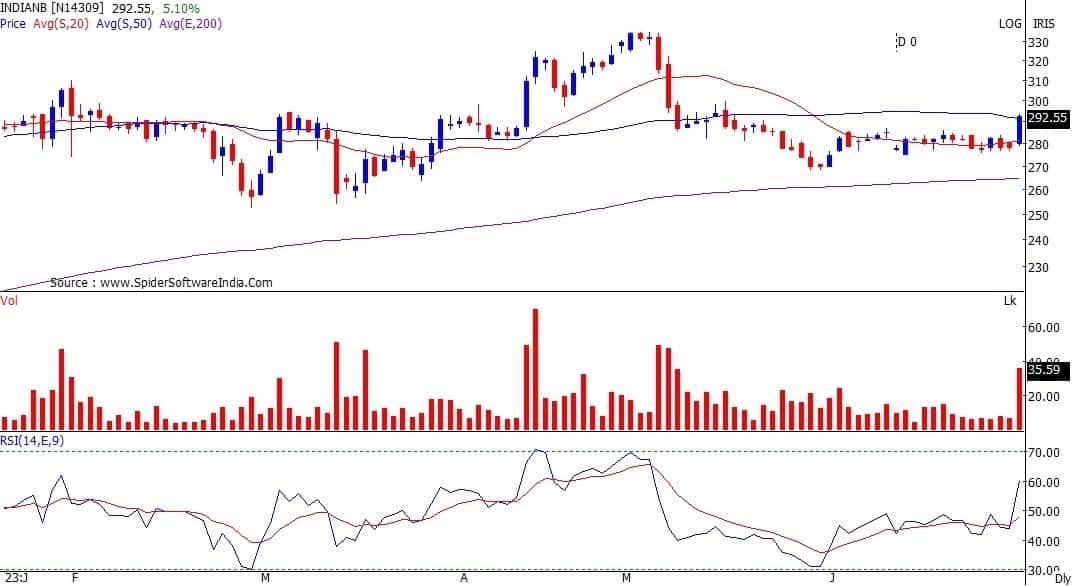
Indian Bank has shown relative strength last week. While the Nifty has gained 2.8 percent last week, Indian bank has gained a healthy 5.42 percent. In the process, the stock has closed above its recent trading range on the back of above average volumes, which augurs well for the uptrend to continue.
Technical indicators are giving positive signals as the stock is trading above the 20 and 50-day SMA. Momentum readings like the 14-week RSI too are in rising mode and not overbought, which implies potential for further upsides.
With the intermediate technical setup too looking attractive, we expect the stock to move up towards its previous intermediate highs in the coming weeks. Buy between Rs 290-294 levels, with a stop-loss at Rs 276 and target at Rs 320.
After touching a low of Rs 91.8 in March 2023, Indiabulls Housing Finance has gradually climbed higher and made higher tops and higher bottoms. In the process, there has also been a moving average crossover as the 20-day SMA has moved above the 50-day SMA.
This positive signal combined with the fact that the stock also closed on Friday above the 200-day EMA on the back of above average volumes, augurs well for the uptrend to continue. Intermediate momentum readings like the 14-week RSI too are in rising mode and not overbought.
With the intermediate technical setup too looking positive, we believe the stock has the potential to move higher in the coming weeks. Recommend a buy between Rs 121-125 levels, with a stop-loss at Rs 113 and target at Rs 140.

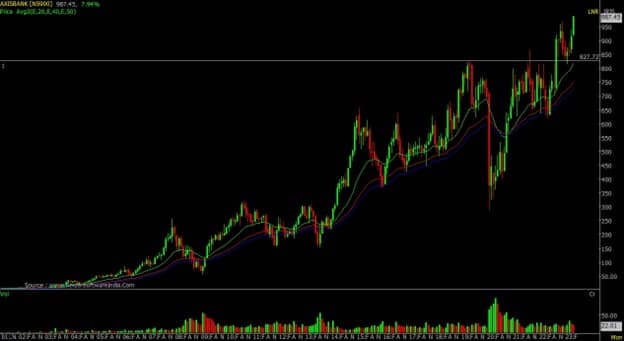
The stock is in a long-term breakout. In the medium term, the stock corrected to retest the breakout level, which stood at Rs 820. However, it soon reversed back and set a new all-time high, which other banks are missing.
The stock is doing well and moving towards Rs 1,050 and Rs 1,150 levels in the coming few weeks or months. The strategy should be to buy 50 percent at current levels and the rest at Rs 965. For this, keep the stop-loss at Rs 940.
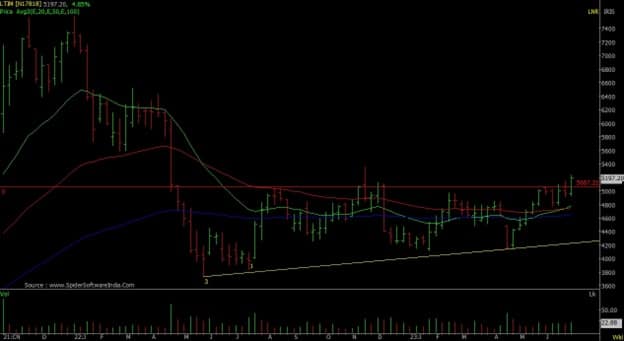
The stock has formed an ascending triangle after falling from the high of Rs 7,588. It is a base-building structure and a rejection of Rs 5,050 on monthly and quarterly closes above it will result in a rally towards Rs 5,800 with key resistance at Rs 5,500.
In the short term, the strategy should be to buy at Rs 5,200 and place a stop-loss at Rs 5,050.
By closing above Rs 850 level, it has completed the corrective pattern on the long-term chart, which will pull the stock towards Rs 1,025, to the minimum level. At the maximum level, it seems possible to get Rs 1,200.
However, to get a better reward for the risk, traders should buy the stock in two tranches. The first tranche should be bought at the current price and the second tranche at Rs 800. Place stop-loss at Rs 770 for the given target.
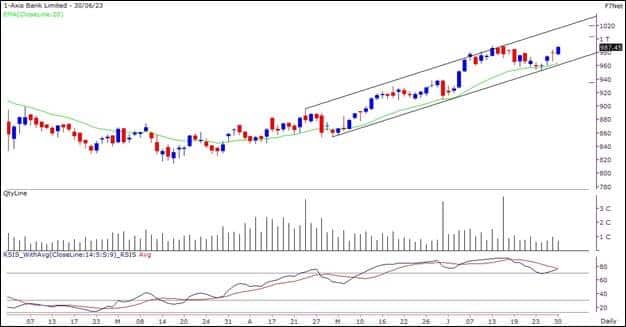
This stock has been forming a ‘Higher Top, Higher Bottom’ structure and is trading in a rising channel. The 20-DEMA has been acting as a support in corrections, and the stock seems to have resumed its upmove from its support zone.
Hence, positional traders can look to buy the stock in the range of Rs 990-980. The stop-loss for long positions should be placed below Rs 955 while the targets could be expected around Rs 1,020 and Rs 1,045.
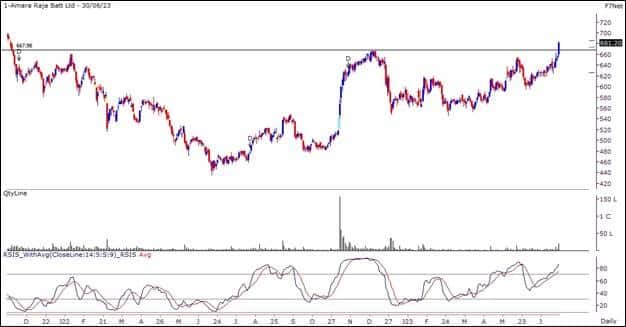
The stock has witnessed a gradual upmove in last few weeks and has now given a breakout above its previous swing high resistance in Friday’s session. The breakout has been supported with higher than daily average volumes and the RSI (relative strength index) oscillator is hinting at a positive momentum.
Hence, traders can buy this stock on in the range of Rs 682-675 for potential near term target of Rs 720 and Rs 740. The stop-loss on long positions should be placed below Rs 648
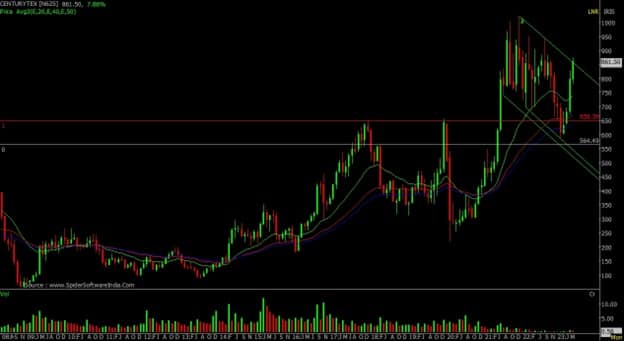
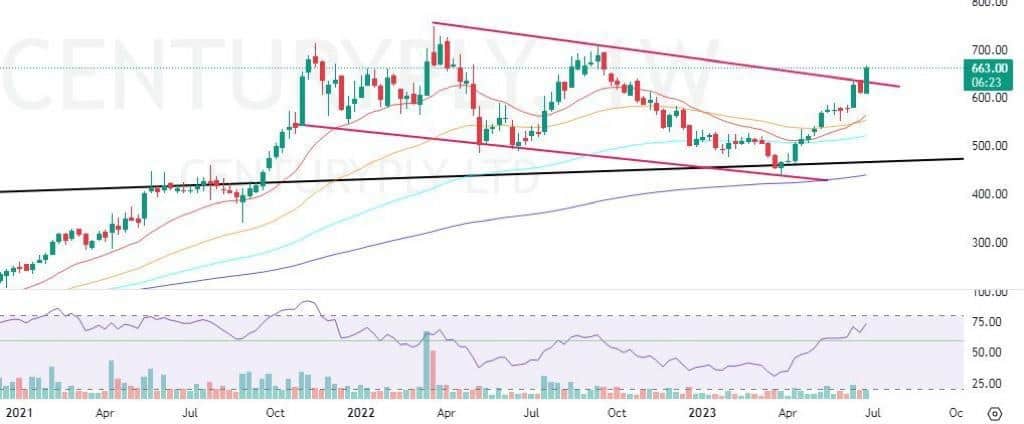
The stock has seen breaking out of a downwards sloping parallel channel pattern on the weekly timeframe with a bullish candlestick above the highs of last nine months which indicates bullish strength.
On the indicator front, the supertrend indicator is indicating a bullish continuation trend which can be used as a confluence towards the bullish view. The Ichimoku Cloud is also suggesting a bullish move as the price is trading above the conversion line, base line and cloud.
Momentum oscillator RSI (14) is at around 72 on the daily time frame indicating strength by sustaining above 50.
Observation of the above factors indicates that a bullish move in Century Plyboards is possible for target upto Rs 705. One can initiate a buy trade in between the range of Rs 656-661, with a stop-loss of Rs 630 on daily closing basis.
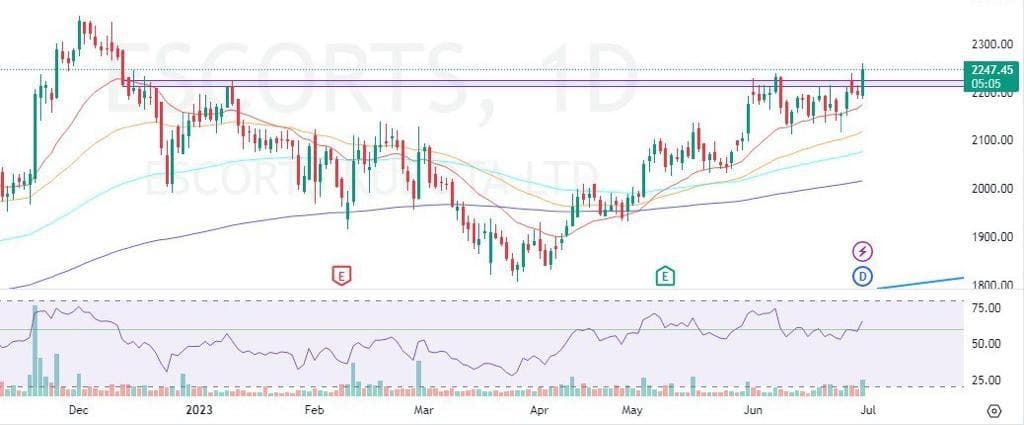
Escorts has seen breaking out of a big Inverted Head and Shoulder pattern on the daily timeframe with a bullish candlestick and above average volumes, adding to it, the stock is also trading above important EMAs of 20/50/100/200 which indicates strength.
On the indicator front the momentum oscillator RSI (14) is at around 65 on the daily time frame indicating strength by sustaining above 50 and the Ichimoku Cloud is also suggesting a bullish move as the price is trading above the conversion line, base line and cloud on the daily timeframe.
Observation of the above factors indicates that a bullish move in Escorts is possible for target upto Rs 2,310. One can initiate a buy trade in the range of Rs 2,243-2,248, with a stop-loss of Rs 2,200 on daily closing basis.
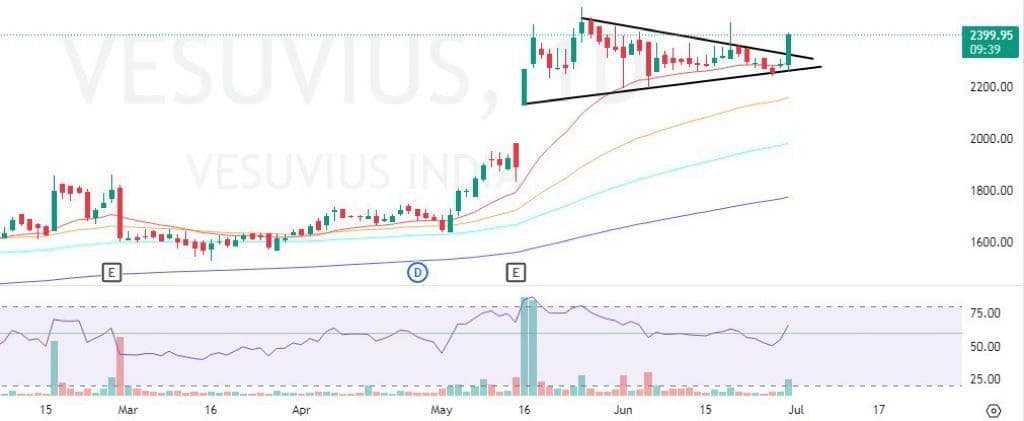
Vesuvius has seen breaking out of a Symmetrical triangle pattern on the daily timeframe with a bullish candlestick and above average volumes, adding to it the RSI indicator is showing a bullish divergence which can be used as a confluence towards the bullish view.
The supertrend indicator is also indicating a bullish continuation which supports the bullish view. Momentum oscillator RSI (14) is at around 65 on the daily time frame indicating strength by sustaining above 50. The Ichimoku Cloud is also suggesting a bullish move as the price is trading above the conversion line, base line and cloud.
Observation of the above factors indicates that a bullish move in Vesuvius is possible for target upto Rs 2,550. One can initiate a buy trade in between the range of Rs 2,394-2,399 with a stop-loss of Rs 2,320 on daily closing basis.
Discover the latest Business News, Sensex, and Nifty updates. Obtain Personal Finance insights, tax queries, and expert opinions on Moneycontrol or download the Moneycontrol App to stay updated!
Find the best of Al News in one place, specially curated for you every weekend.
Stay on top of the latest tech trends and biggest startup news.


