


Central Statistical Organisation will soon release Provisional Estimates of Annual GDP (Gross Domestic Product) for FY 2024-25 and Quarterly Estimates for Q4 of 2024-25. In this article, I draw attention to not the GDP growth projections but an interesting way of estimating economic growth: Core GDP. Before getting to core GDP, we need to understand a bit of history of GDP.
GDP, a brief background
The history of GDP, or National Income, starts in the mid-17th century with the rise of nation-states. A British scientist, William Petty, in order to compare powers of England with other nations, produced estimates of income (along with population, expenditure etc.) of England and Wales. In 1758, French doctor Francois Quesnay developed Tableau Economique to understand inter-sectoral flows. A century after Petty’s estimates, in 1776 Adam Smith published his classic 'Wealth of Nations', where he explained income of a nation also includes the manufacturing sector.
In the 20th century, action again shifted to measuring economic activity. Russia developed input-output tables for planning purposes. World War I followed by the Great Depression led to massive physical and economic destruction. The two events created government demand for economic data to understand the nature of slump. In 1932, Colin Clarke who collected multiple economic data, estimated national income for UK.
In 1934, Simon Kuznets followed Clarke to estimate national income for the US which showed the economy had halved between 1929 and 1932. US President Franklin D. Roosevelt used Kuznets’ data to announce fiscal policy measures to boost the economy. Kuznets is now called as the father of ‘National Income Accounts’ and was awarded Nobel Prize in economics in 1971.
In 1936, John Maynard Keynes’s 'General Theory of Employment, Interest and Money' rewrote economic history. Keynes differentiated between micro and macro analysis of economics. In 1941, Keynes wrote ‘An Analysis of the Sources of War Finance and an Estimate of the National Income’ using national income estimates prepared by James Meade and Richard Stone. Both were awarded the Nobel Prize, in 1976 and 1984 respectively.
GDP is estimated by multiple approaches: production, expenditure and income. The United Nations prepared a System of National Accounts (SNA) in 1953 to enable countries to compile measures of economic activity in a standardized way.
Push towards GDP+
Gradually, GDP became the most important metric of economic progress. However, economists also questioned the hegemony of GDP and argued that material progress alone should not be the measure of economic progress. Amartya Sen and Mahbub-ul-Haq developed Human Development Index which apart from income also emphasized health and education as criteria for economic development and progress.
After the 2008 Global Financial Crisis, questions were again raised on GDP as a measure of economic progress. Then French President Nicholas Sarkozy established a commission under Amartya Sen and Joseph Stiglitz to review GDP as a measure of economic progress. The Commission suggested to move beyond GDP and argued well-being includes multiple things apart from income: health, education, social connections, environment etc.
Core GDP, a way to separate the signal from noise
Given this four-century history of GDP, Jason Furman, former Chief Economic Adviser to the Obama White House has recommended a new measure: Core GDP. Furman explains that the idea of core GDP is similar to core inflation. In core inflation, volatile items like food and fuel items are excluded from the headline inflation. The core inflation provides a more stable and reliable predictor of overall inflation and is being increasingly preferred by policymakers to gauge inflation trends.
In headline GDP, we include four major components: Consumption, private investment, government spending and net exports (exports- imports). Furman suggests that core GDP be derived by excluding government spending, net exports and inventories (part of investments). This is because in today’s highly volatile external world, net exports are never easy to understand. Government spending merely responds to the ongoing economic situation.
Core GDP in the Indian context
What does core GDP’s historical trend look like for India?
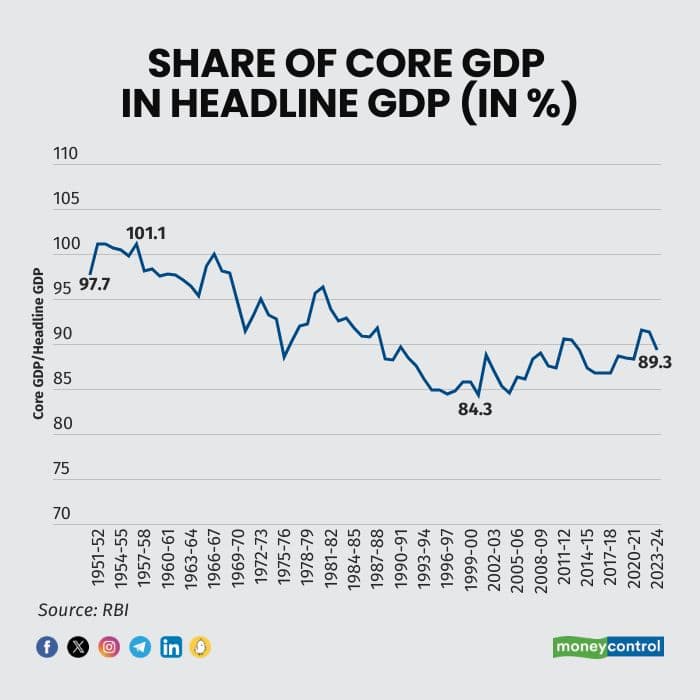
First, we can see share of core GDP as a percentage of headline GDP has declined from nearly 100 percent in 1950s to 85-90 percent since the 1980s. This reflects gradual opening of Indian economy after independence. It also implies that estimates of core GDP growth is not likely to differ much from estimates of headline GDP growth.
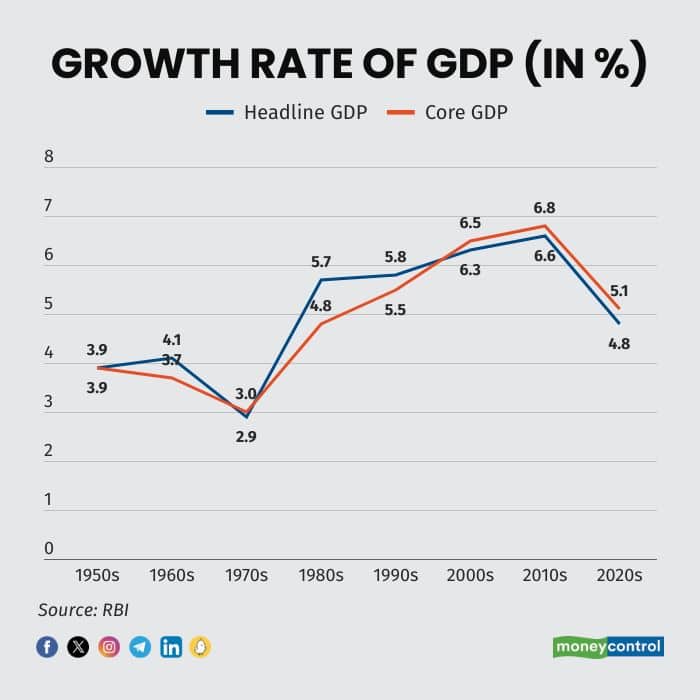
We can see this in the estimates of headline versus core GDP growth where both growth rates are nearly similar for long periods. The decadal average headline GDP is higher till 1990s (except 1970s) and since 2000s core GDP growth is higher than headline GDP growth. Core GDP has been higher in recent years due to economic reforms leading to higher growth in consumption and private investments compared to government spending.
To sum up, Furman’s idea of using core GDP as a measure instead of headline inflation adds to the long arc of history of GDP. Core GDP could mean very different estimates from headline estimates for highly open economies and those dependent on government expenditure. For Indian economy, estimating core GDP growth will not lead to a significant difference with headline GDP growth.
Discover the latest Business News, Sensex, and Nifty updates. Obtain Personal Finance insights, tax queries, and expert opinions on Moneycontrol or download the Moneycontrol App to stay updated!
Find the best of Al News in one place, specially curated for you every weekend.
Stay on top of the latest tech trends and biggest startup news.


