


After taking strong support at 16,800 levels in March 2023, the Nifty 50 turned up sharply and sustained near its lifetime highs indicating a strong positive undertone of the Index.
On the weekly charts, the index has been forming a Rising Wedge price pattern since March 2023.
On the Daily Time frame, the Index can be spotted forming Higher Highs and Higher Lows on a swing basis, confirming the uptrend's presence.
The momentum indicator RSI has sustained above 60 on all the time frames like daily, weekly and monthly indicating strong positive momentum of the Index.
The Index has strong support at 18200 followed by 18000. While on the higher side, the mark of 18887 (lifetime high) followed by 19055 (key resistance) is a crucial level to watch out for.
The overall trend looks positive for the Nifty Index, we expect the prices to move higher till 18887 followed by 19055 levels in the coming weeks.
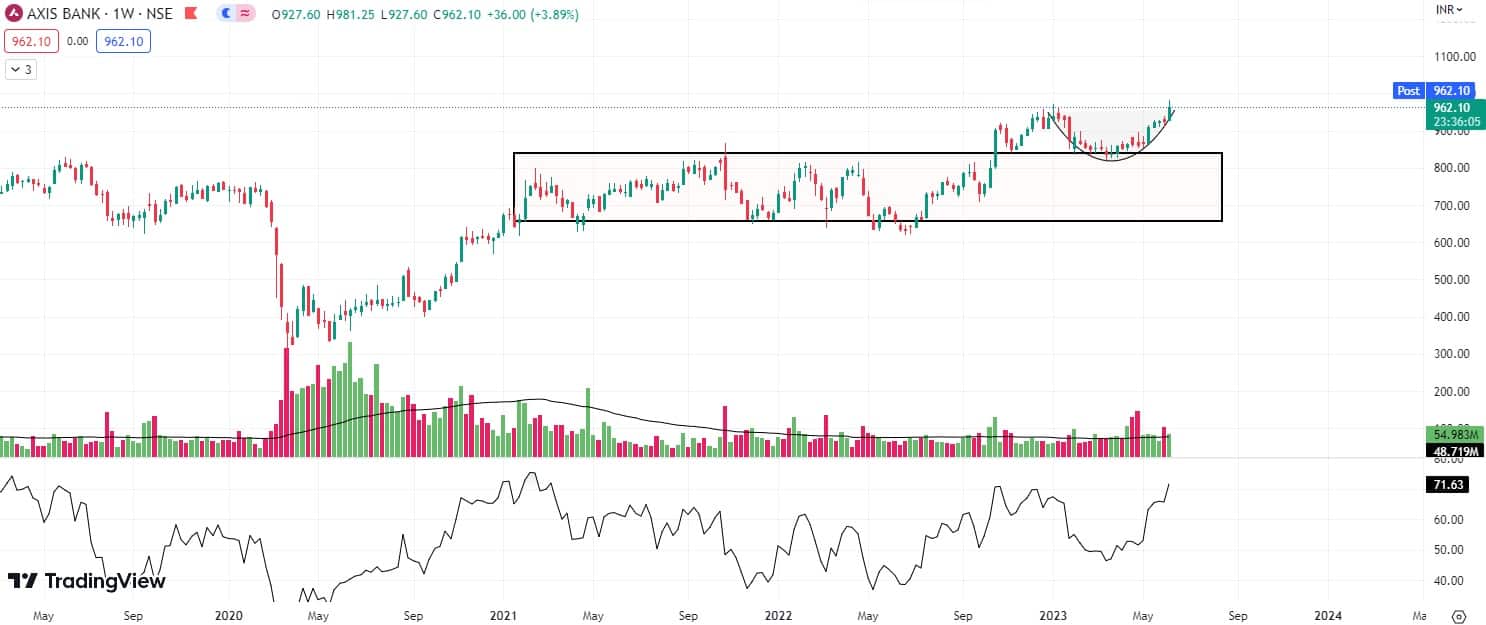
Here are three buy calls for the next 2-3 weeks:Axis Bank | CMP: 962.10 | Target: Rs 1,100 | Stop Loss: Rs 930 | Upside: 13%Based on the analysis, Axis Bank stock has displayed a shift in polarity around the 830 level, indicating a notable increase in bullish sentiment.
Additionally, the recent breakout of the Rounding Bottom pattern suggests the initiation of an upward trend.
Furthermore, the stock is currently trading above key Moving Averages, specifically the 50, 100, and 200 Days Exponential Moving Averages (EMA), confirming the presence of an uptrend.
The momentum indicator RSI has sustained well above the 50 mark on both the Daily and the weekly timeframe which shows the rising Momentum.
Looking ahead, we anticipate the prices to continue upward, potentially reaching the 1100 level. It is advisable to set a stop loss at 930, based on the closing prices
Based on the analysis, Grndwell stock has demonstrated a change in polarity at its bearish trend line, which has been respected by prices since January 2022.
This indicates a positive undertone in the prices. Furthermore, the breakout of the double-bottom pattern suggests the initiation of an upward trend.
Additionally, the stock experienced a Golden Cross over in mid-May 2023, confirming the beginning of an upward trend.
Moreover, the Momentum Indicator RSI is showing a rising trend and has consistently remained above the 50 mark, indicating increasing momentum in the prices.
Based on these factors, we anticipate the prices to continue upward, potentially reaching the 2385 level. It is recommended to set a strict stop loss in 2010, based on closing prices.

The Bharat Forge has sustained above three-month high after taking strong support at 50% Fibonacci retracement of the last advance from 595 – 919 levels indicating the start of an up move.
On the weekly charts, the stock has maintained a bullish structure of higher top higher bottom formation.
On the daily timeframe, the stock has given a Double Bottom price pattern breakout with volume confirmation showing the presence of a bullish undertone.
The momentum Indicator RSI on the Weekly timeframe is rising and sustaining above 55 levels reflecting the presence of positive momentum.
We expect the prices to move higher till the 890 level where the stop loss must be 784 strictly on the closing basis.


Discover the latest Business News, Sensex, and Nifty updates. Obtain Personal Finance insights, tax queries, and expert opinions on Moneycontrol or download the Moneycontrol App to stay updated!
Find the best of Al News in one place, specially curated for you every weekend.
Stay on top of the latest tech trends and biggest startup news.


