


The Nifty started the week on a flat note, but its continued with the momentum of the previous week to end this week negatively. It closed at 11,284 with a loss of 135 points on a weekly basis.
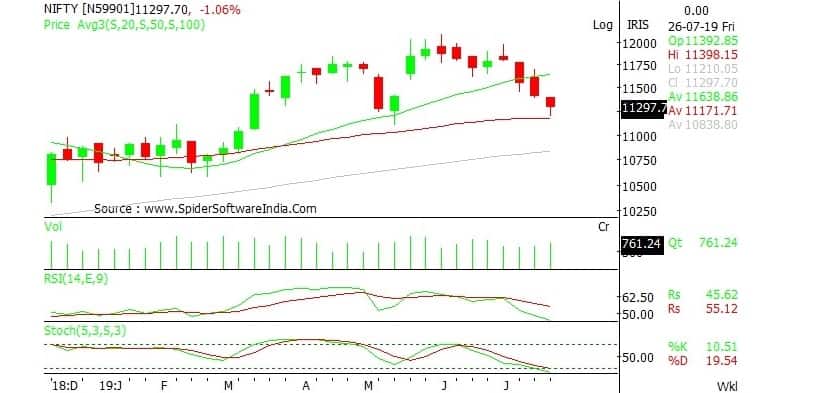
On the weekly chart the index has formed a bearish candle forming lower High-Low in comparison to the previous week and has closed below its previous week’s low, which indicated weakness at current levels. The index is moving in a Lower Top and Lower Bottom formation on the weekly chart, which indicated a negative bias.
The chart pattern suggests that if the Nifty breaks and sustains below 11,200 level, it would witness selling, which would lead the index towards 11,150-11,100 levels. However if index crosses above the 11,400 level, it would witness buying which would take the index towards between 11,450-11,500.
The Nifty's highest OI stands on Call side stands at 11400 at 18.17 lakh shares, followed by 11,300 at 16.47 lakh shares, and 11,500 at 14.47 lakh shares. An addition on the call side was observed in 11,300 CE at 4.88 lakh shares, 11400 CE at 4.88 lakh shares.
Nifty Highest OI Stands on the Put Side stands at 11,200 put options (PE) with 21.81 lakh shares, followed by 11000 PE with 11.84 lakh and 11,300 PE with 11.56 lakh shares. Addition on Put side was observed in 11,200 PE at 11.75 lakh shares , 11100 PE at 5.75 lakh shares.
The Nifty is trading below its 20, 50 and 100-day simple moving averages (SMAs), which is important as it indicates a negative bias for the short to the medium term. The Nifty continues to remain on a downtrend for the short to medium term, so selling on rallies continues to be our preferred strategy. For the week, we expect Nifty to trade in the range of 11,100-11,500 with a mixed bias.
The weekly strength indicator RSI and momentum oscillator Stochastic both are moving downwards and are below their respective reference lines indicating negative bias.
The Bank Nifty started the week with a downward gap and continued its previous week's negative momentum to end the week on a weak note. Bank Nifty closed at 29,325 with a loss of 445 points on a weekly basis.
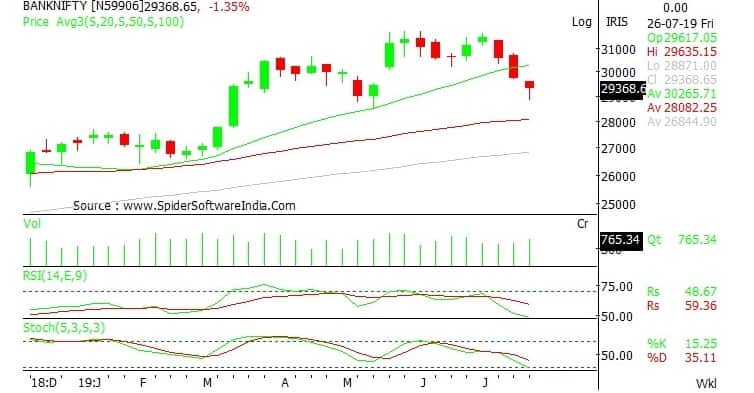
On the weekly chart, the index has formed a Bearish candle with a long lower shadow indicating buying at lower levels. The index is moving in a Lower Top and Lower Bottom formation on the daily chart, indicating negative bias.
The chart pattern suggests that if the Bank Nifty breaks and sustains below the 29,000 level, it would witness selling, which would lead the index towards 28,800-28,500 levels. However if index crosses above 29,500 level, it would witness buying which would take the index towards 29,800-30,000.
The highest OI seen on the Bank Nifty was 30,000 CE with 4.88 lakh shares, 29500 with 3.86 lakh shares. Addition on Call Side was observed in 30,000 CE with 1.86 lakh shares, 29,700 CE with 1.27 lakh shares, 29,600 CE with 0.99 lakh shares. Unwinding on Call Side was at 29000 CE with 0.21 lakh shares.
Highest OI on the put side was at 29,000 PE with 6.11 lakh shares, 28,800 PE with 3.75 lakh share. Addition on Put Side was observed in 29,000 PE with 3.59 lakh shares, 28,800 PE with 2.54 lakh shares.
The Bank Nifty is trading below its 20, 50 and 100-day simple moving averages, which is important as it indicates a negative bias for the short to the medium term. The Bank Nifty continues to remain on a downtrend for the short to medium term, so selling on rallies continues to be our preferred strategy. For the week, we expect the Bank Nifty to trade in the range of 30,000-28,800 with a mixed bias.
The weekly strength indicator RSI and momentum oscillator Stochastic both are moving downwards and are below their respective reference lines indicating negative bias.
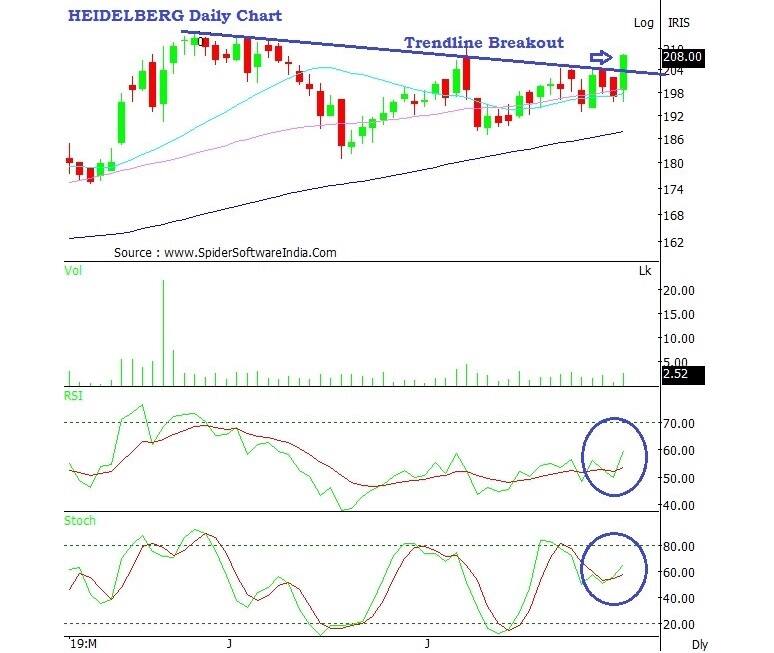
HeidelbergCement India | Buying Range: Rs 208-204 | Stoploss: Rs 195 | Target: Rs 216 221 | Upside: 5-7 percentOn the daily charts, the stock price has decisively broken out from its “Multiple resistance zone” levels of 204-205 on a closing basis and sustaining above the same. This breakout has been accompanied with an increase in volumes, which support a bullish sentiment going ahead. The weekly as well as daily strength indicator RSI and the momentum indicator Stochastic both have turned positive, which supports an upside momentum to continue in near term. The stock price is sustaining well above its 20, 50 and 100 day SMA, which supports bullish sentiments for the future.
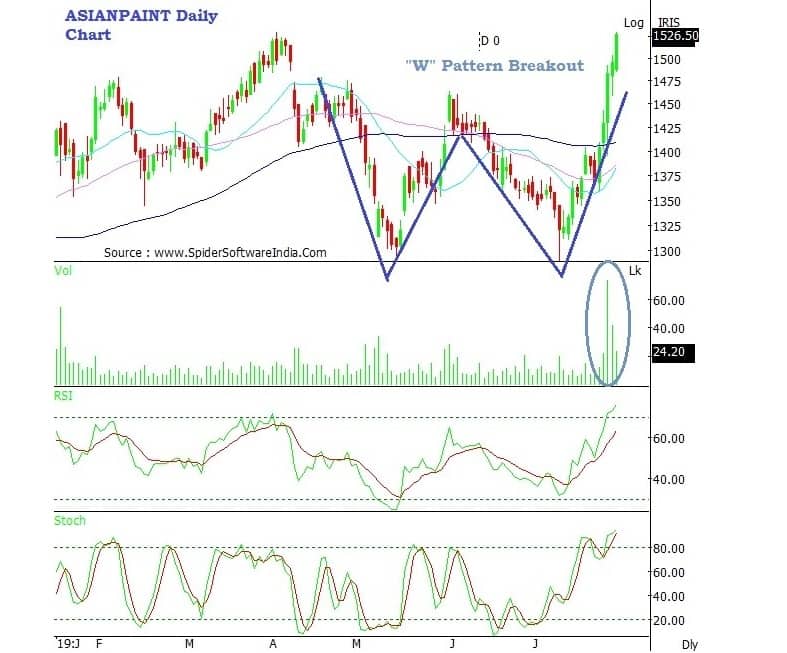
On the daily chart, the stock price has decisively broken out from its “Double Bottom” pattern at 1,470-1,480 level on a closing basis, and is sustaining above the same. This breakout has been accompanied with an increase in volumes, which support bullish sentiments ahead.
The daily as well as weekly strength indicator RSI and the momentum indicator Stochastic both are in positive territory, which supports upside momentum to continue in near term. Stock price is sustaining well above its 20, 50 and 100 day SMA, which supports bullish sentiments for the future.
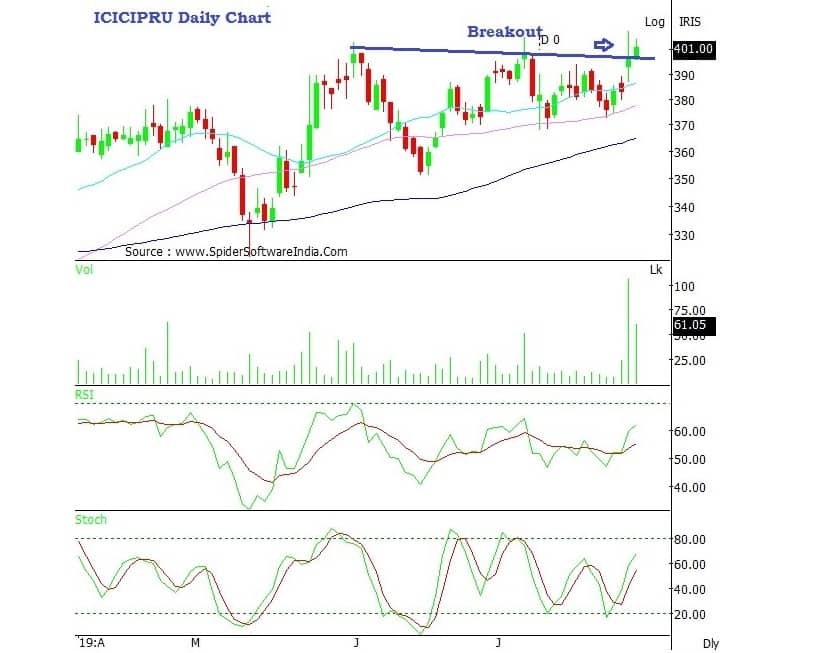
On the daily chart, the stock price has decisively broken out from its “Multiple resistance zone” levels of 398-396 on a closing basis and sustaining above the same. This breakout is accompanied with an increase in volumes, which supports bullish sentiments ahead. The daily strength indicator RSI and the momentum indicator Stochastic both have turned positive which supports upside momentum to continue in near term. The stock price is sustaining well above its 20, 50 and 100 day SMA, which supports bullish sentiments for the future.
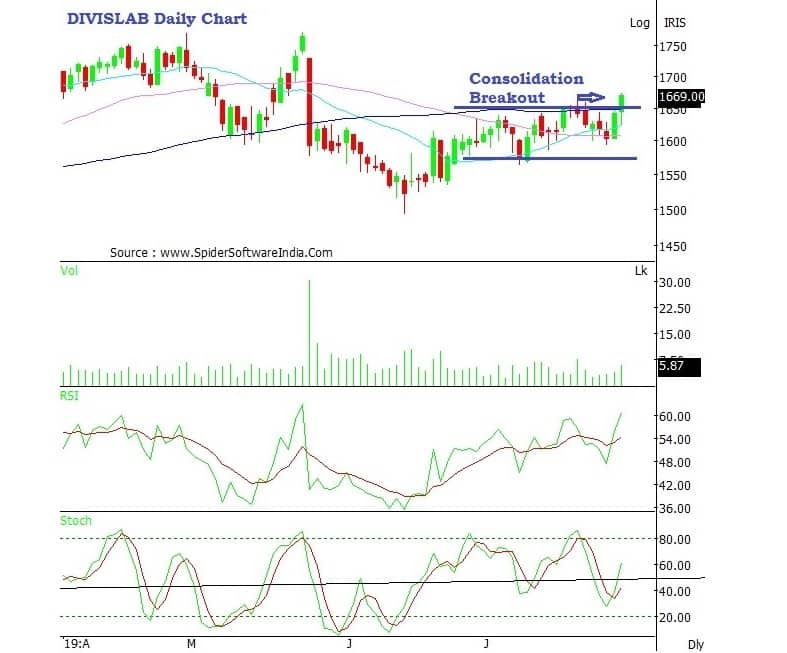
On the daily chart, the stock price has decisively broken out from its “Multiple resistance zone” levels of 1,660-1,655 on a closing basis and sustaining above the same. This breakout is accompanied with an increase in volumes, which support bullish sentiments ahead. The daily as well as weekly strength indicator RSI and the momentum indicator Stochastic both have turned positive which supports upside momentum to continue in near term. The stock's price is sustaining well above its 20, 50 and 100-day SMA, which supports bullish sentiments for the future.

Discover the latest Business News, Sensex, and Nifty updates. Obtain Personal Finance insights, tax queries, and expert opinions on Moneycontrol or download the Moneycontrol App to stay updated!
Find the best of Al News in one place, specially curated for you every weekend.
Stay on top of the latest tech trends and biggest startup news.


