

Nifty has been highly volatile over the past few weeks. The equity markets saw a euphoric rise before the Lok Sabha election result (May 23) in expectations of BJP coming back to power.
But, interestingly, on May 23, after the results were announced with a landslide victory by the Modi government, Nifty closed negative after hitting a record high. This clearly indicates that markets were discounting the event beforehand.
Even during such eventful times, technical analysis worked out extremely well. Below is the daily chart of Nifty that shows expanding triangle pattern, channels, RSI with moving average.
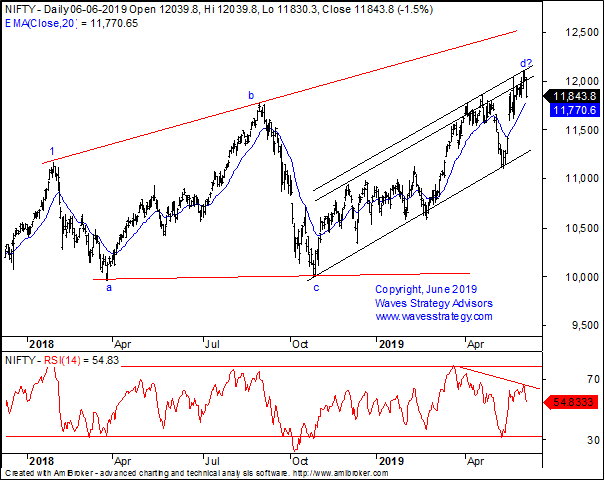
Nifty has been exhibiting expanding triangle Elliott wave pattern as it was taking out previous highs but only to reverse back lower again.
Even this time after touching the high of 12,103 on May 23, there was a sharp reversal on the downside.
Channels:
Channelling is a basic but very important method that can help traders or investor to see the maturity of the trend. The reversal on the downside has happened from the black channel resistance level.
Moving average:
The 20-day exponential moving average has been providing a good proxy for the trend. Prices are now very near to this average and a decisive break below this will be a sign of concern.
Expanding triangle pattern:
A triangle has 5 legs and is labeled as a-b-c-d-e. The Nifty looks to be completing its wave d on the upside and once the support level is breached it will further confirm that wave e is starting.
The momentum has also slowed down as we can see negative divergence on RSI with respect to prices. This means that prices have made new highs but RSI has made lower highs, which is again a sign of concern.
In a nutshell, one should use these simple but effective technical analysis tools to understand the maturity of trend and then form a trading strategy around it. It is time to stay cautious once the support levels are decisively taken out.
The author is Founder & CEO, Waves Strategy Advisors.Disclaimer: The views and investment tips expressed by investment expert on moneycontrol.com are his own and not that of the website or its management. Moneycontrol.com advises users to check with certified experts before taking any investment decisions.

Discover the latest Business News, Sensex, and Nifty updates. Obtain Personal Finance insights, tax queries, and expert opinions on Moneycontrol or download the Moneycontrol App to stay updated!
Find the best of Al News in one place, specially curated for you every weekend.
Stay on top of the latest tech trends and biggest startup news.


