


Equity benchmarks reversed most of the gains seen in the previous couple of sessions and closed 0.4 percent lower on July 17, but the market breadth was moderately weak. About 1,393 shares declined compared to 1,261 advancing shares on the NSE. The market needs a close above short-term moving averages for an upward journey; until then, consolidation may continue. Below are some short-term trading ideas to consider:
Jay Mehta, Technical Analyst at JM Financial Services
V-Guard Industries | CMP: Rs 404.15

V-Guard has formed a bullish reversal inverse head-and-shoulders pattern on the daily chart, with a breakout on Thursday backed by rising volume and a golden crossover of the 50-day and 200-day EMAs. Momentum indicators like RSI and MACD are in bullish zones with positive crossovers, supporting the upward trend. The breakout candle has broken through a tight consolidation range since July 4, characterized by indecisive spinning top candles.
Strategy: Buy
Target: Rs 430, Rs 450
Stop-Loss: Rs 380
Mahindra Holidays & Resorts India | CMP: Rs 363.7
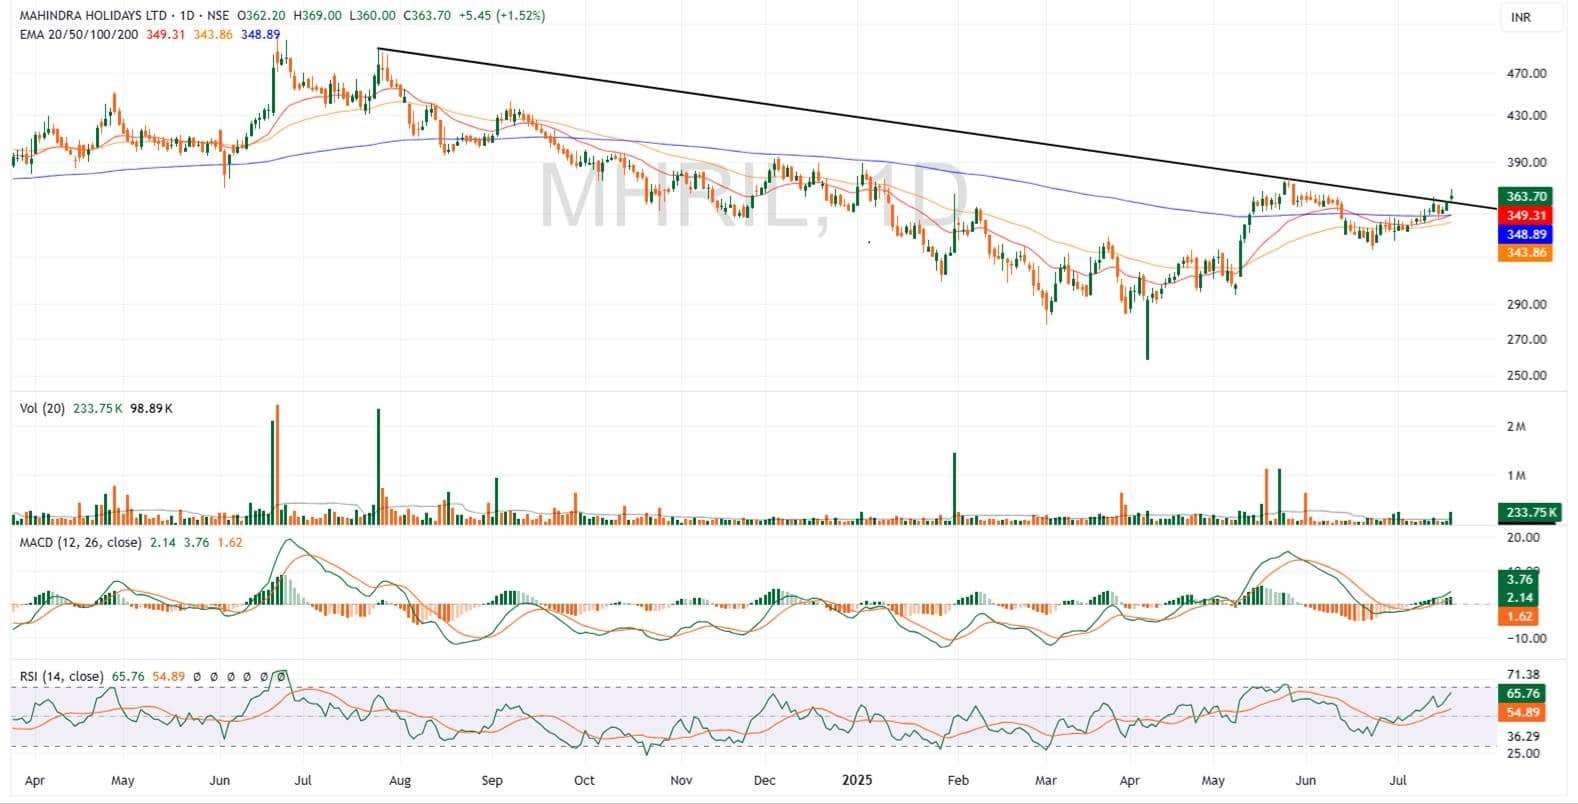
Mahindra Holidays broke above a resistance trendline established since July 2024, accompanied by a gap-up opening suggestive of a breakaway gap, potentially initiating a bullish trend. The price now trades above key EMAs, which will serve as dynamic support. Thursday's elevated volume reflects strong buying interest, corroborated by bullish momentum indicators. A move above Rs 377 could accelerate the upward trajectory.
Strategy: Buy
Target: Rs 390, Rs 400
Stop-Loss: Rs 341
Elgi Equipments | CMP: Rs 553.6
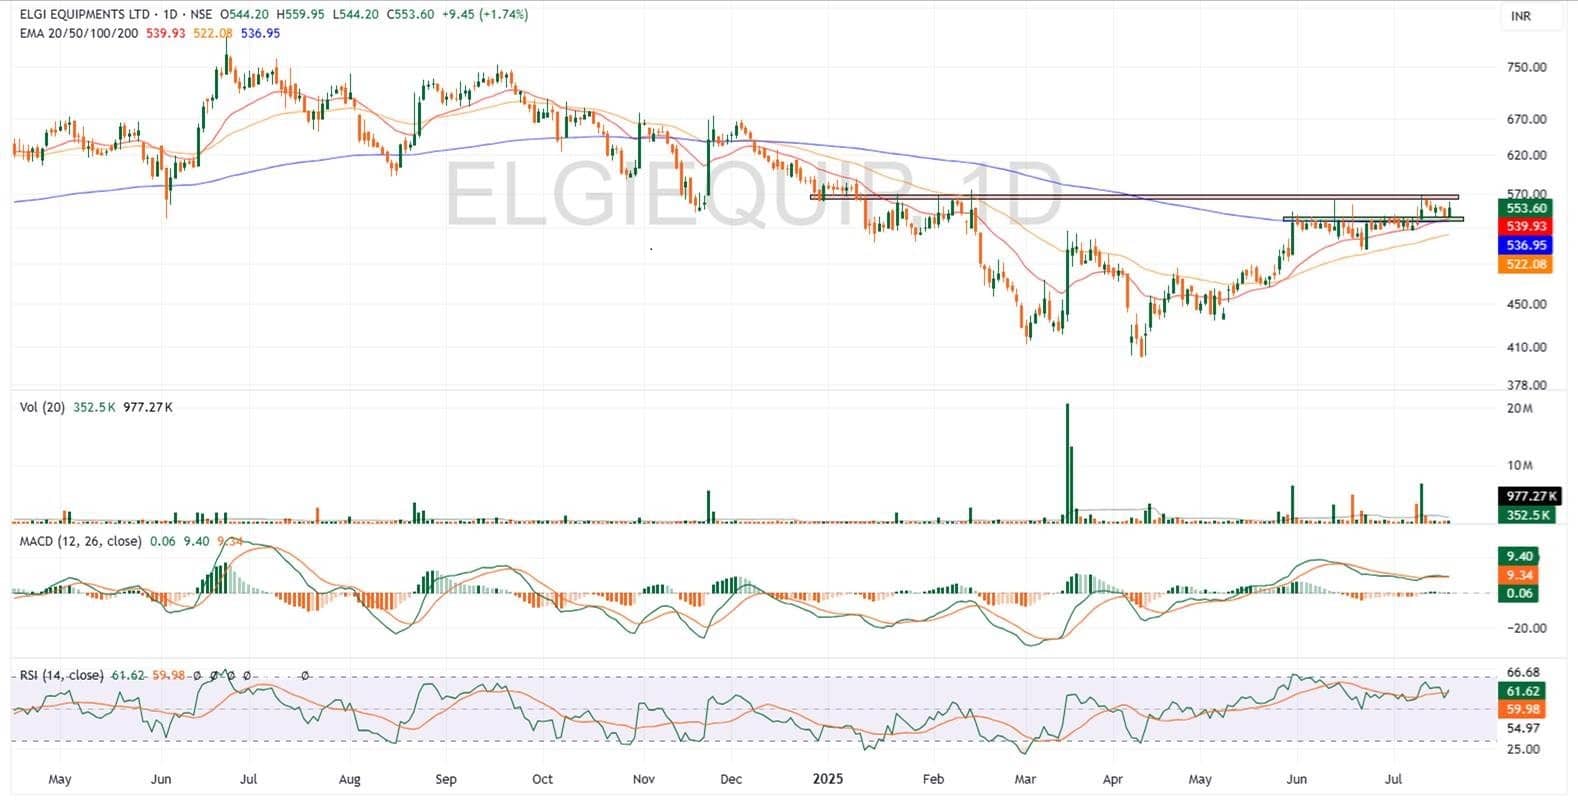
Elgi Equipments achieved a breakout from a tight consolidation range on July 9, which had been in place since June 2, 2025, and is currently retesting this zone. Thursday's price action found support at the confluence of the 200-day and 20-day EMAs. A breakout above the immediate resistance at Rs 568 could trigger an extension of a complex inverse head-and-shoulders pattern, targeting Rs 600, Rs 635, and Rs 655. Positive volume growth during the breakout, followed by reduced volume on the retest, alongside momentum indicators trading in bullish territory, supports the bullish outlook.
Strategy: Buy
Target: Rs 600, Rs 635, Rs 655
Stop-Loss: Rs 512
Mandar Bhojane, Senior Equity Research Analyst at Choice Broking
Prestige Estates Projects | CMP: Rs 1,783.2
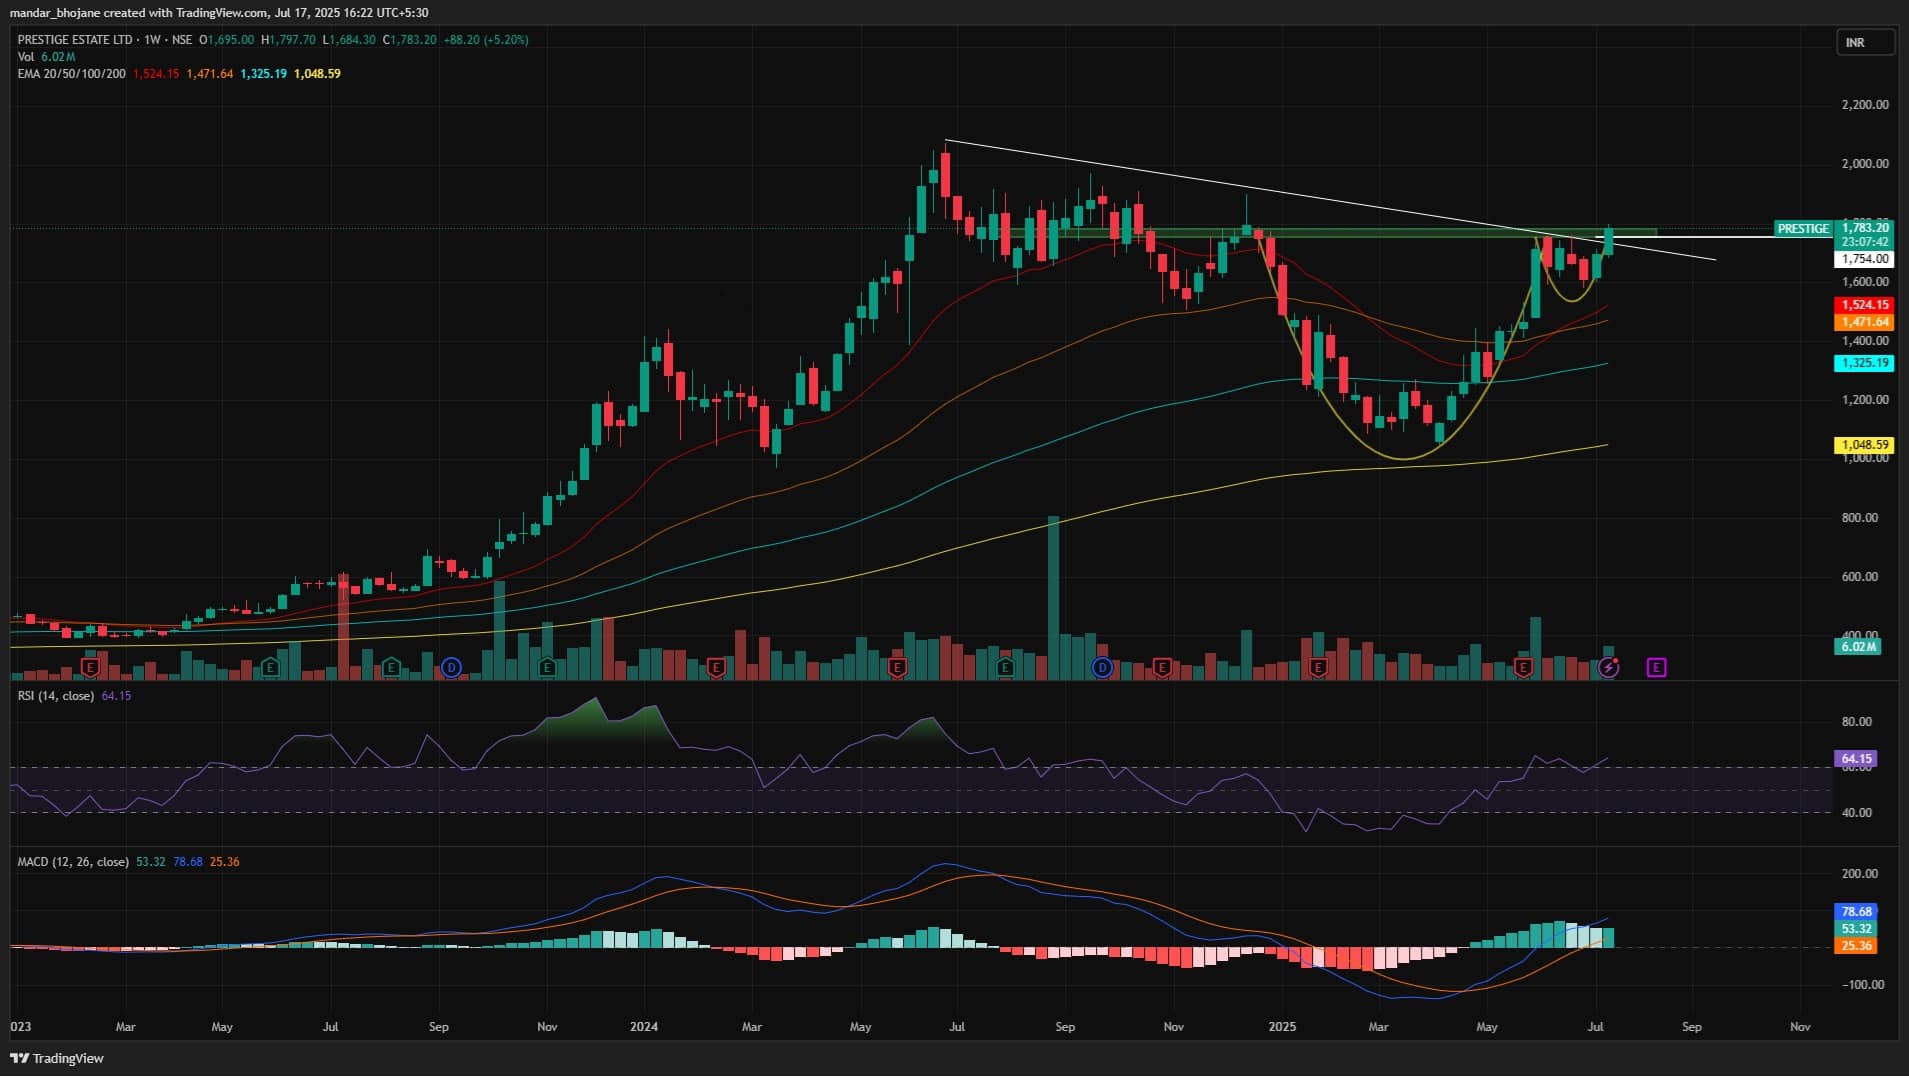
Prestige Estates is currently showcasing a strong bullish setup, supported by a confluence of patterns across multiple timeframes. The stock is on the verge of a breakout from a Cup and Handle formation on the weekly chart, while it has already broken out of a falling trendline on the daily chart. This structure suggests strong accumulation and decreasing selling pressure, as the price consolidates just below the breakout zone.
A decisive close above Rs 1,790, supported by higher volumes, would confirm the breakout and potentially trigger a sharp upmove. The stock is trading well above its 20, 50, 100, and 200-day EMAs, indicating strength across short-, medium-, and long-term trends. Momentum is also supportive — the RSI at 70 is trending upward, showing strong buying interest without overbought signals. Traders may consider a buy-on-dips strategy near Rs 1,720.
Strategy: Buy
Target: Rs 2,000
Stop-Loss: Rs 1,680
Zydus Wellness | CMP: Rs 2,102.1
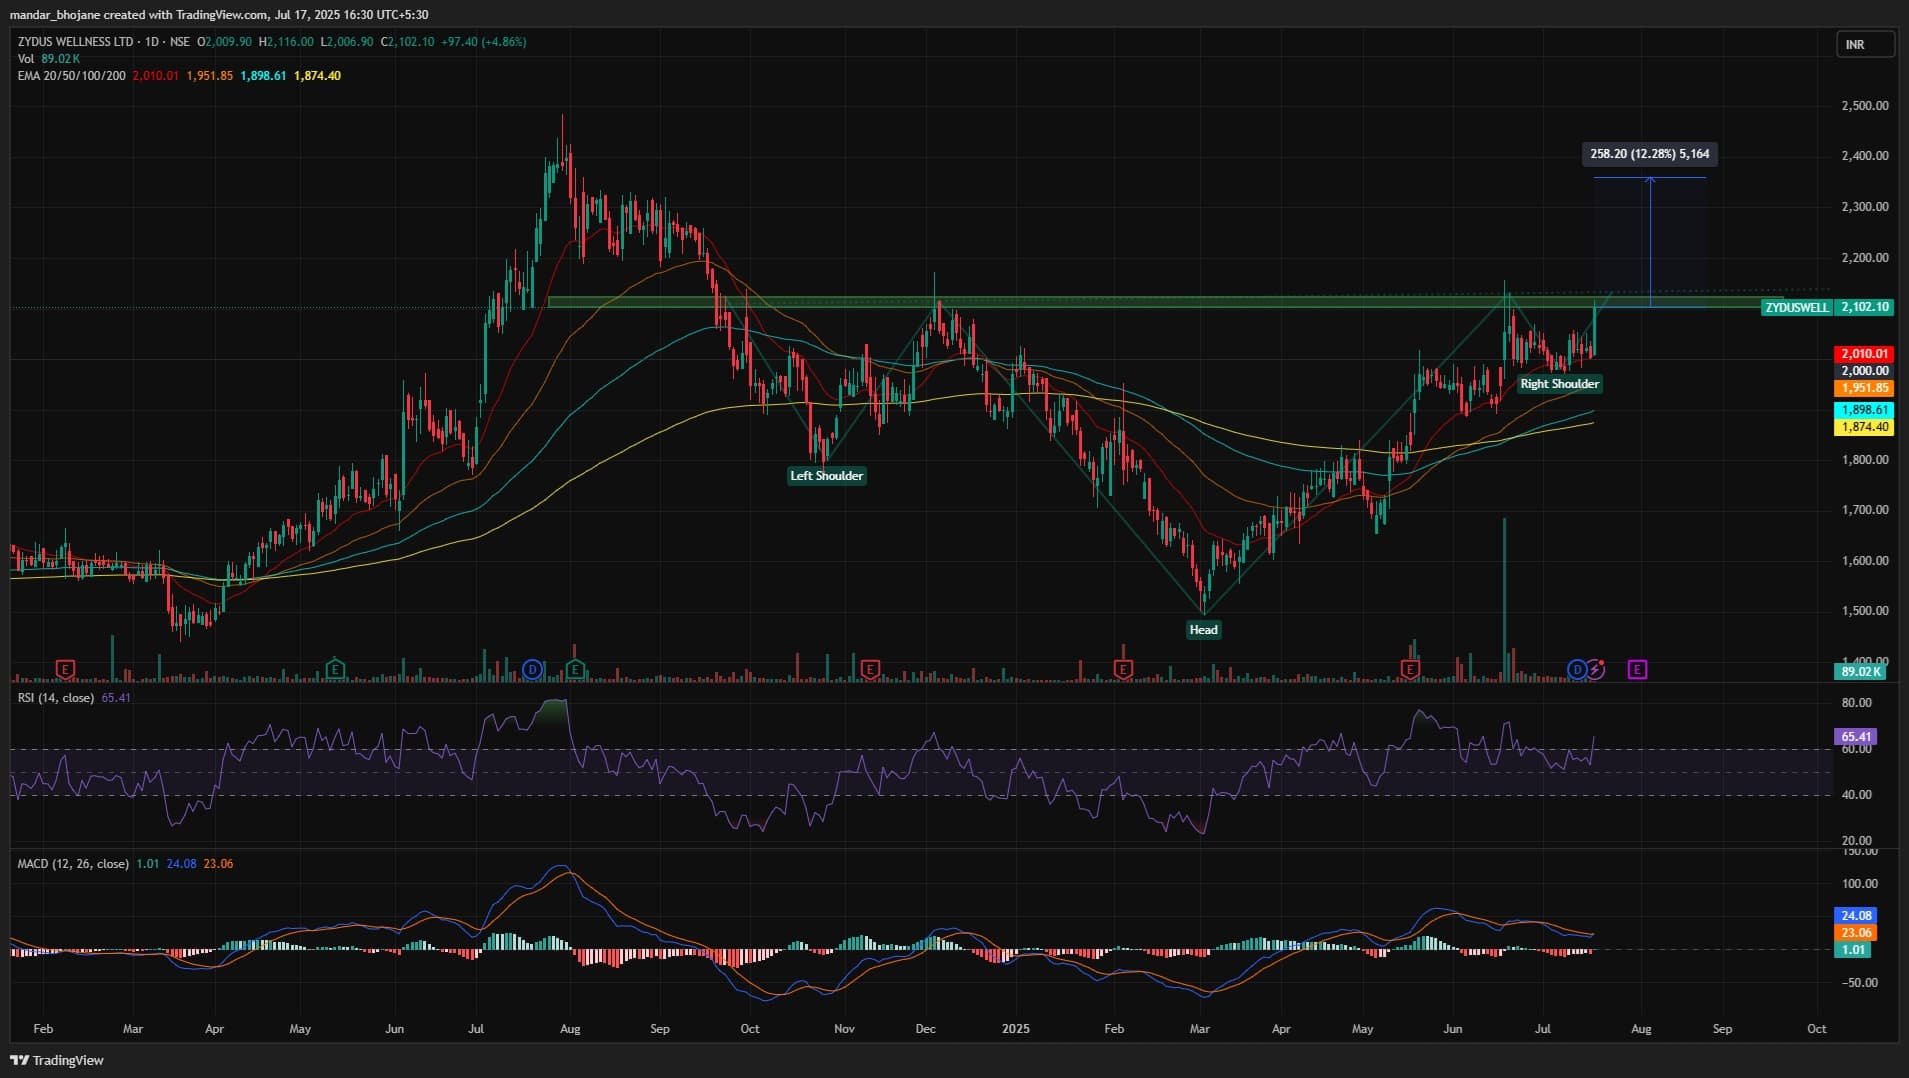
Zydus Wellness is consolidating near a key breakout zone, signaling underlying strength. On the daily chart, the stock is forming an Inverted Head and Shoulders pattern, a classic bullish reversal setup. Increasing volumes during the consolidation phase reflect growing investor interest and raise the probability of an upside breakout.
A decisive close above Rs 2,125 would confirm the pattern breakout and could trigger strong bullish momentum. The RSI stands at 65.4 and is trending upward, indicating healthy momentum with more room to the upside. On the downside, immediate support lies at Rs 2,050, which can be considered a potential buy-on-dips zone for positional traders.
Strategy: Buy
Target: Rs 2,360
Stop-Loss: Rs 1,975
Welspun Corp | CMP: Rs 931.9
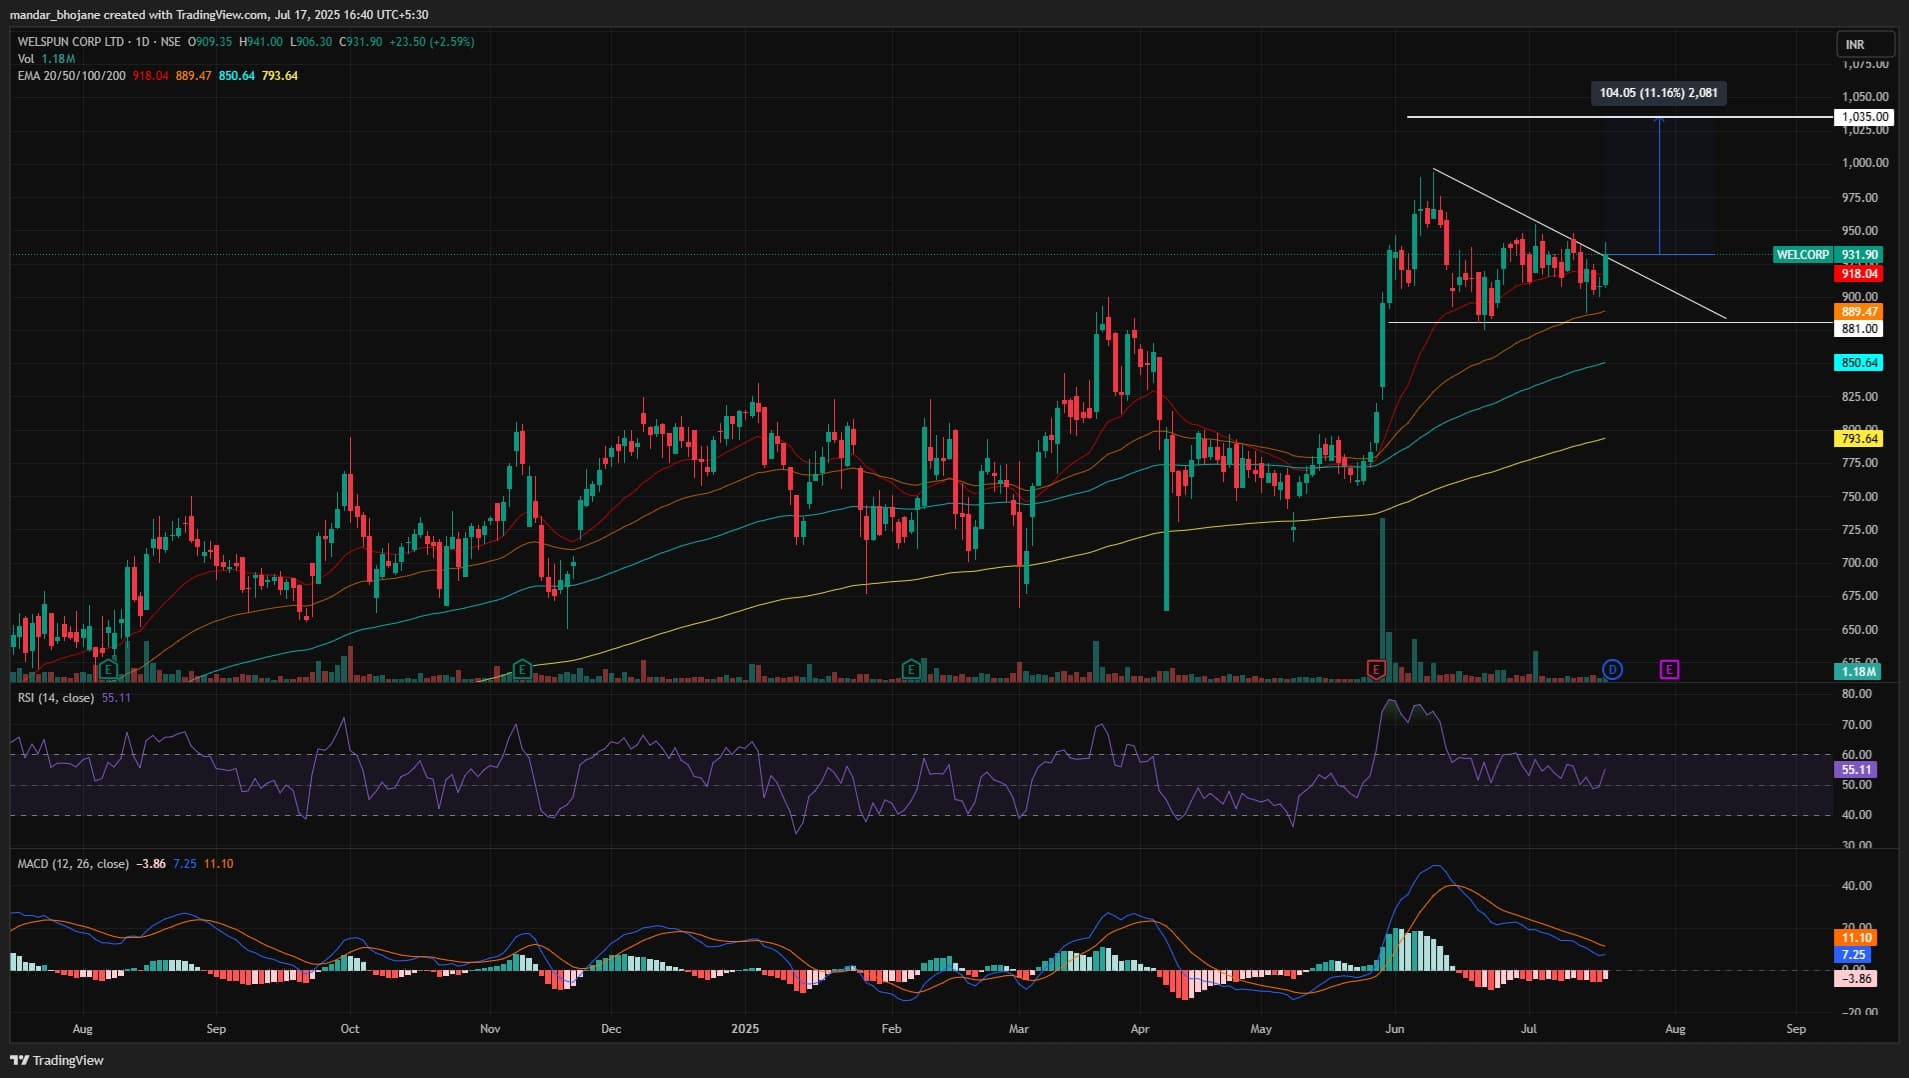
Welspun Corp is on the verge of a breakout from a Flag and Pole pattern on the daily chart. This setup, combined with rising volumes, indicates renewed buying interest and suggests a potential trend shift in favour of the bulls.
Technically, the RSI stands at 55.11 and is trending upward, also showing a bullish divergence, which reinforces the case for strengthening momentum. On the downside, Rs 905 acts as a strong support level and can be viewed as a key accumulation zone on dips.
If the stock sustains above current levels with continued volume participation, it may move towards the short-term target of Rs 1,035.
Strategy: Buy
Target: Rs 1,035
Stop-Loss: Rs 880
Om Mehra, Technical Research Analyst at Samco Securities
Godrej Consumer Products | CMP: Rs 1,278.2

Godrej Consumer Products has resumed its upward momentum after a brief pause in the uptrend. The recent breakout above the Rs 1,245–1,255 zone has been accompanied by a noticeable rise in volume, confirming strength behind the move.
The stock has witnessed a bullish crossover, with the 9-EMA now trading above both the 20-EMA and the 50-EMA, indicating strong alignment across short- to medium-term averages. The stock continues to hold above the 50-day simple moving average, currently placed at Rs 1,240, which now serves as immediate support.
The RSI stands at 63 and remains in the bullish zone, while the MACD continues to show a positive crossover with widening histogram bars, highlighting the ongoing momentum. The stock is currently forming a Cup with Handle pattern (bullish), and the price is holding firmly near the breakout zone. Improving volume participation validates the recent breakout and supports the bullish continuation.
Strategy: Buy
Target: Rs 1,360
Stop-Loss: Rs 1,230
Blue Star | CMP: Rs 1,882.6
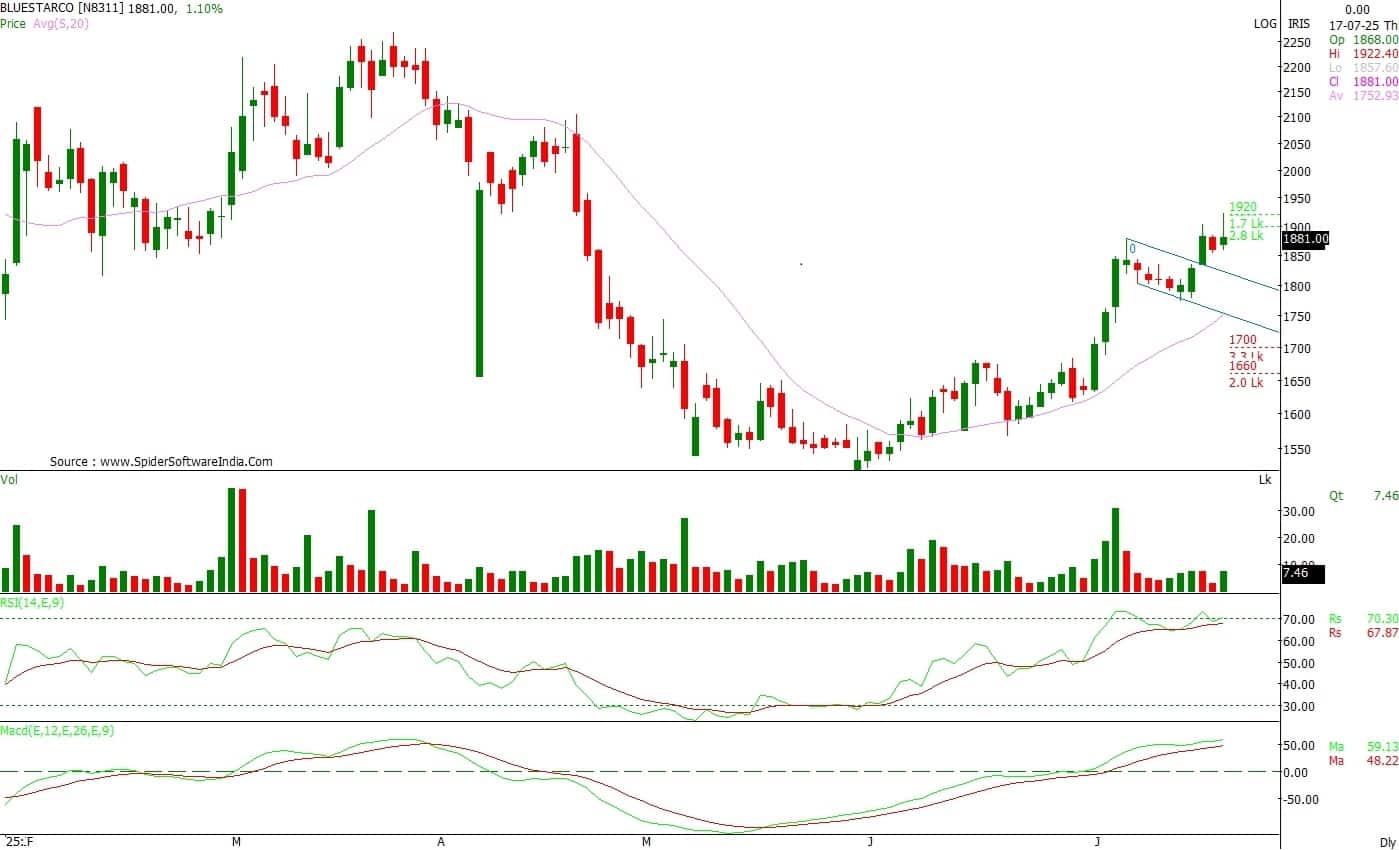
Blue Star has registered a decisive breakout from a classic Cup formation on the daily chart. The breakout above the neckline resistance at Rs 1,850 has occurred with a steady rise in volume, confirming participation and validating the pattern’s completion.
The stock is now holding above the 9, 20, and 50-day moving averages. Importantly, the close is just below the 200-SMA, and a follow-through above Rs 1,890 would further strengthen the trend confirmation.
The overall structure displays clean higher lows on the right side of the cup, with rising volume supporting the upward drift. The recent consolidation just below the neckline acted as the handle portion, which resolved positively.
The RSI stands elevated at 70, staying in the bullish zone without divergence. The MACD remains positively aligned above the signal line, indicating continued strength.
Strategy: Buy
Target: Rs 1,970
Stop-Loss: Rs 1,835
Gujarat State Petronet | CMP: Rs 335.8
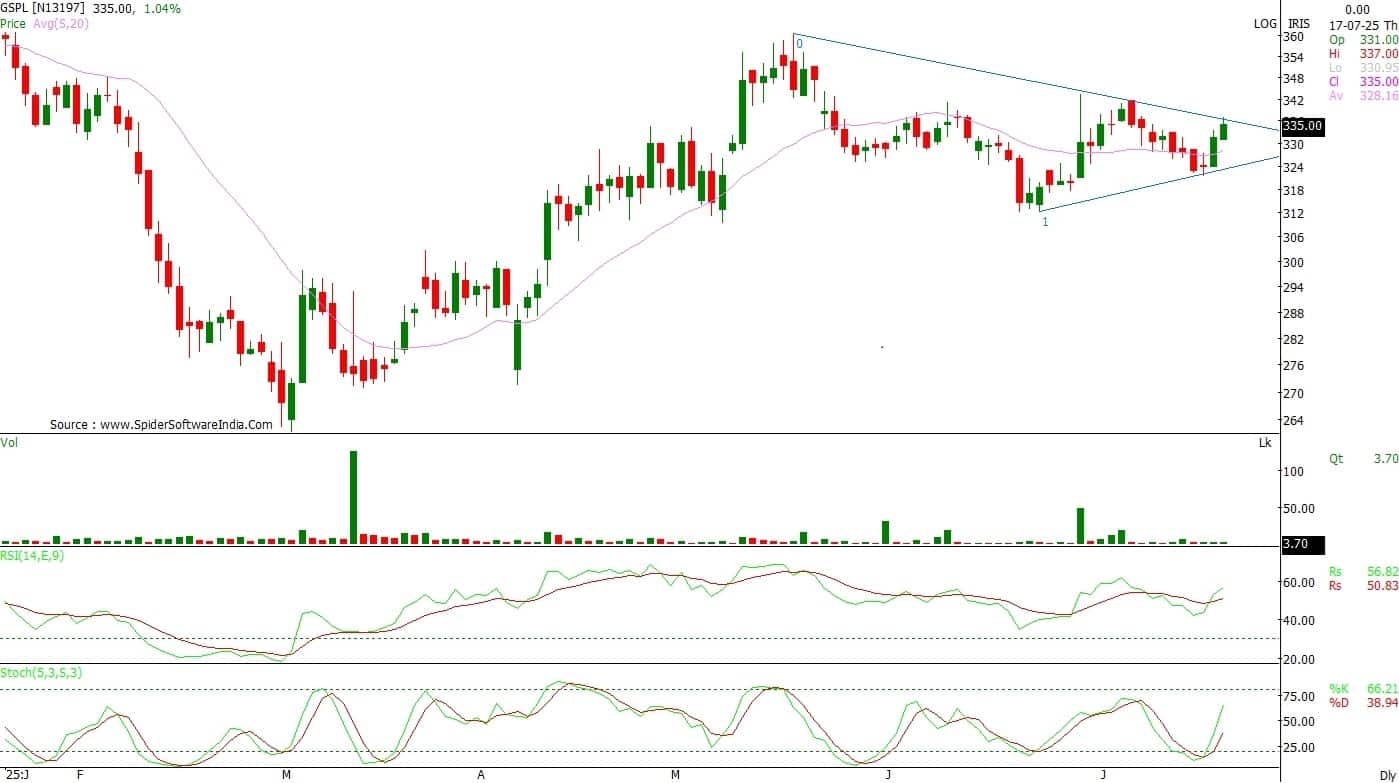
Gujarat State Petronet (GSPL) has broken out of a short-term contracting triangle on the daily chart. The pattern exhibits a series of higher highs and higher lows, and the breakout candle has closed firmly above the previous resistance, indicating an ongoing bullish trend.
The stock has managed to close above the 20-EMA and the 50-day simple moving averages. This move, following a narrow-range consolidation, suggests an improving short-term setup. However, the immediate zone of interest now lies around Rs 338–340, which may act as a minor hurdle.
The RSI has risen to 57 and is gradually trending higher, while the stochastic oscillator has crossed above 70, supported by a clean signal-line crossover. Both indicators are pointing to improving momentum. Volume has held steady in recent sessions.
Strategy: Buy
Target: Rs 355
Stop-Loss: Rs 324
Disclaimer: The views and investment tips expressed by investment experts on Moneycontrol.com are their own and not those of the website or its management. Moneycontrol.com advises users to check with certified experts before taking any investment decisions.Discover the latest Business News, Sensex, and Nifty updates. Obtain Personal Finance insights, tax queries, and expert opinions on Moneycontrol or download the Moneycontrol App to stay updated!
Find the best of Al News in one place, specially curated for you every weekend.
Stay on top of the latest tech trends and biggest startup news.


