


The benchmark indices recorded new all-time closing highs on July 1, with the Nifty 50 ending above 24,100 for the first time. About 1,714 shares advanced, while 668 shares declined on the NSE. The index needs to give a decisive close above 24,200 for a further northward journey towards 24,500, with support at 24,000. Here are some trading ideas for the near term:
Mehul Kothari, DVP – Technical Research at Anand RathiHikal | CMP: Rs 345.85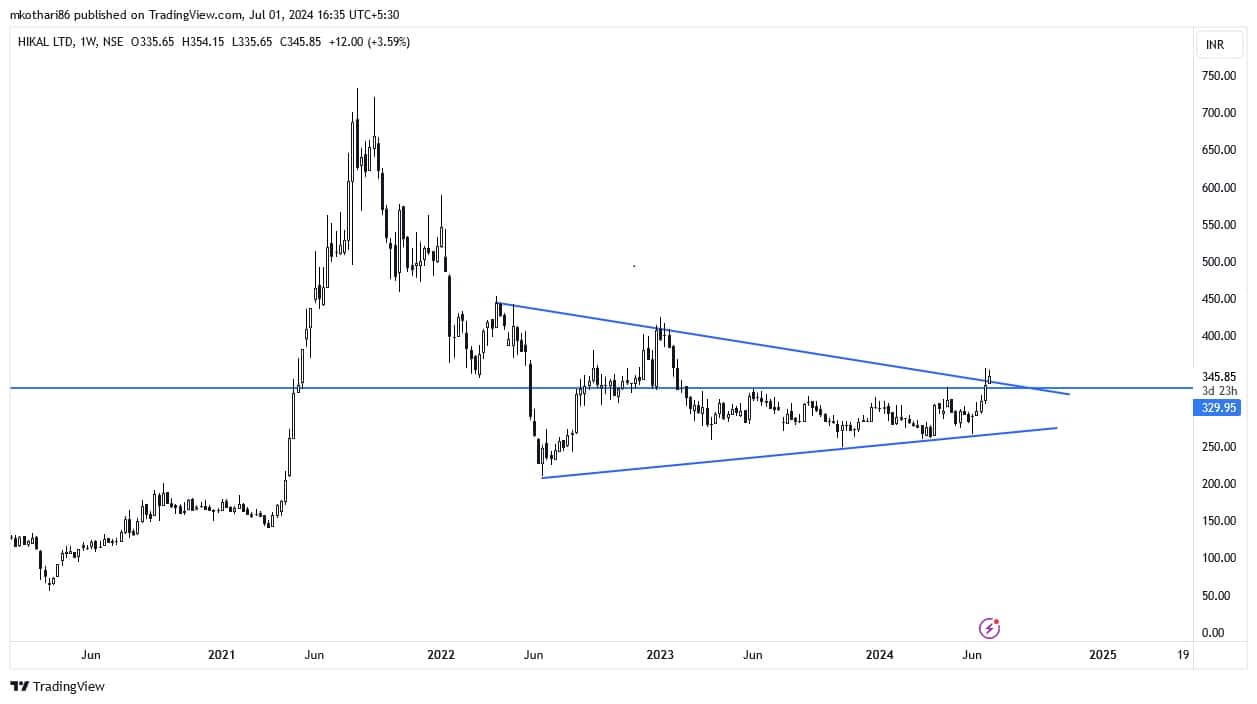
Since March 2023, Hikal has been consolidating in a broad range of Rs 330 – 260 without any clear direction. Recently, we witnessed a range breakout above Rs 330 in the stock, and that too with exceptional volumes. The long-term chart indicates multiple bottom formations on the downside along with a triangular breakout on the line chart. Thus, traders are advised to buy Hikal in the range of Rs 336 - 344 with a stop-loss of Rs 306 on a closing basis for an upside target of Rs 391 and Rs 408 in the coming 1 – 3 months.
Strategy: Buy
Target: Rs 408
Stop-Loss: Rs 306
Mphasis | CMP: Rs 2,494.9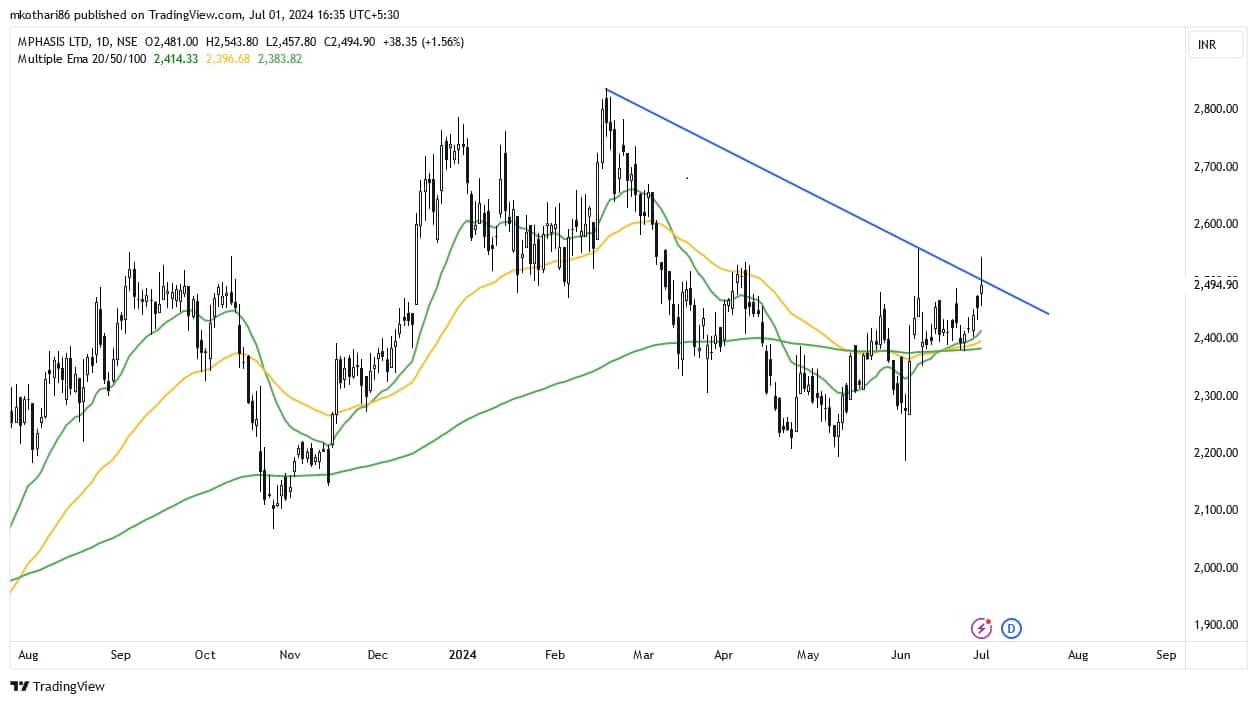
On the daily chart, Mphasis has confirmed a trendline breakout above the Rs 2,500 mark. Above Rs 2,560, the stock will confirm a breakout from a bullish inverse Head and Shoulder pattern. The breakout has occurred after the stock found support and consolidated at the placement of the 200 DEMA (Exponential Moving Average). The stock has managed to turn from the supports of the Ichimoku system on the weekly as well as monthly scale. Thus, traders are advised to buy Mphasis in the range of Rs 2,500 - Rs 2,540 with a stop-loss of Rs 2,300 on a closing basis for an upside target of Rs 2,850 and Rs 2,960 in the coming 1 – 3 months.
Strategy: Buy
Target: Rs 2,960
Stop-Loss: Rs 2,300
Pravesh Gour, Senior Technical Analyst at Swastika InvestmartVoltamp Transformers | CMP: Rs 11,975.95
Voltamp has recently broken out of a symmetrical triangle formation on the daily chart, accompanied by significant trading volume. This breakout suggests a positive outlook for the stock in the short to long term. Additionally, the stock is trading above its important moving averages, further reinforcing its bullish sentiment. Both the RSI (Relative Strength Index) and MACD (Moving Average Convergence Divergence) indicators are supportive of the current strength in the stock's momentum. In terms of price levels, the range of Rs 12,500 holds psychological significance as a key resistance level. If the stock manages to surpass this level, it could potentially rally towards Rs 13,900 or higher. On the downside, Rs 10,650 is a strong demand zone during any correction.
Strategy: Buy
Target: Rs 13,900
Stop-Loss: Rs 10,650
Indian Energy Exchange | CMP: Rs 189.34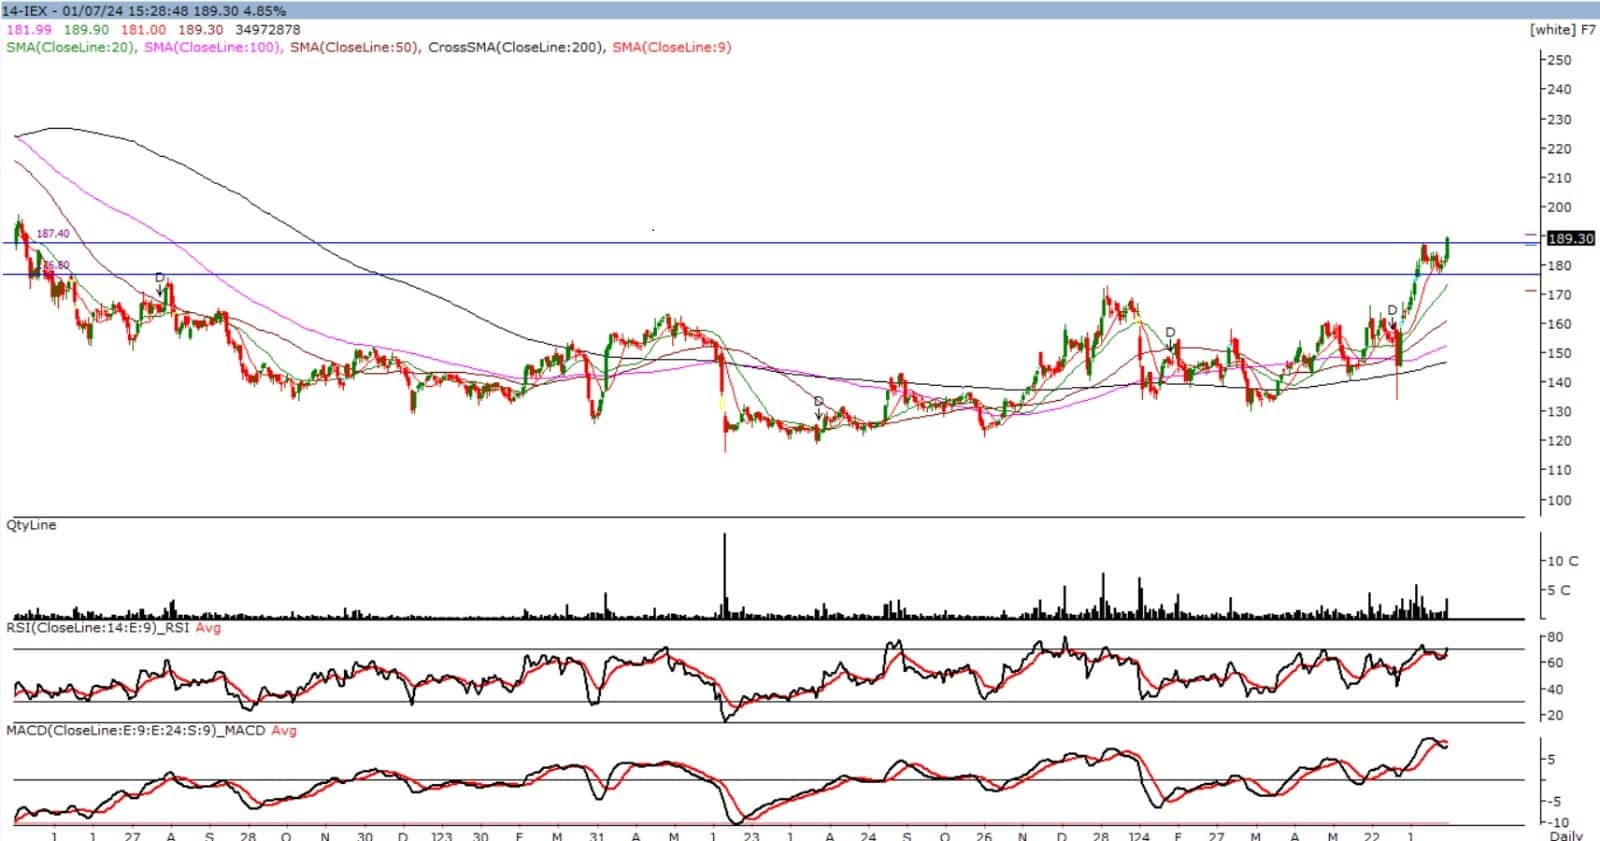
Indian Energy Exchange is in a classical move, as it has witnessed a breakout of a long consolidation formation on the daily chart, then retested its previous breakout at Rs 176 levels, and started a new leg of rally towards Rs 200. An investor can enter at the current price of Rs 189 with a stop-loss of Rs 176 and aim for a short-term target of Rs 200/208. MACD is supporting the current strength, whereas the momentum indicator RSI is also positively poised.
Strategy: Buy
Target: Rs 208
Stop-Loss: Rs 176
Glenmark Pharma | CMP: Rs 1,267.45
Glenmark's chart looks very lucrative as it surged to its all-time high levels, showing strong bullish momentum recently. Currently, the stock has given a multi-year resistance breakout on the monthly time frame. High rollovers in June indicated that the bullish rally may continue, opening a way towards Rs 1,350 and Rs 1,500 levels. On the downside, the first support is placed at Rs 1,195 with 20 DMA support.
Strategy: Buy
Target: Rs 1,368
Stop-Loss: Rs 1,195
Deepak Nitrite | CMP: Rs 2,616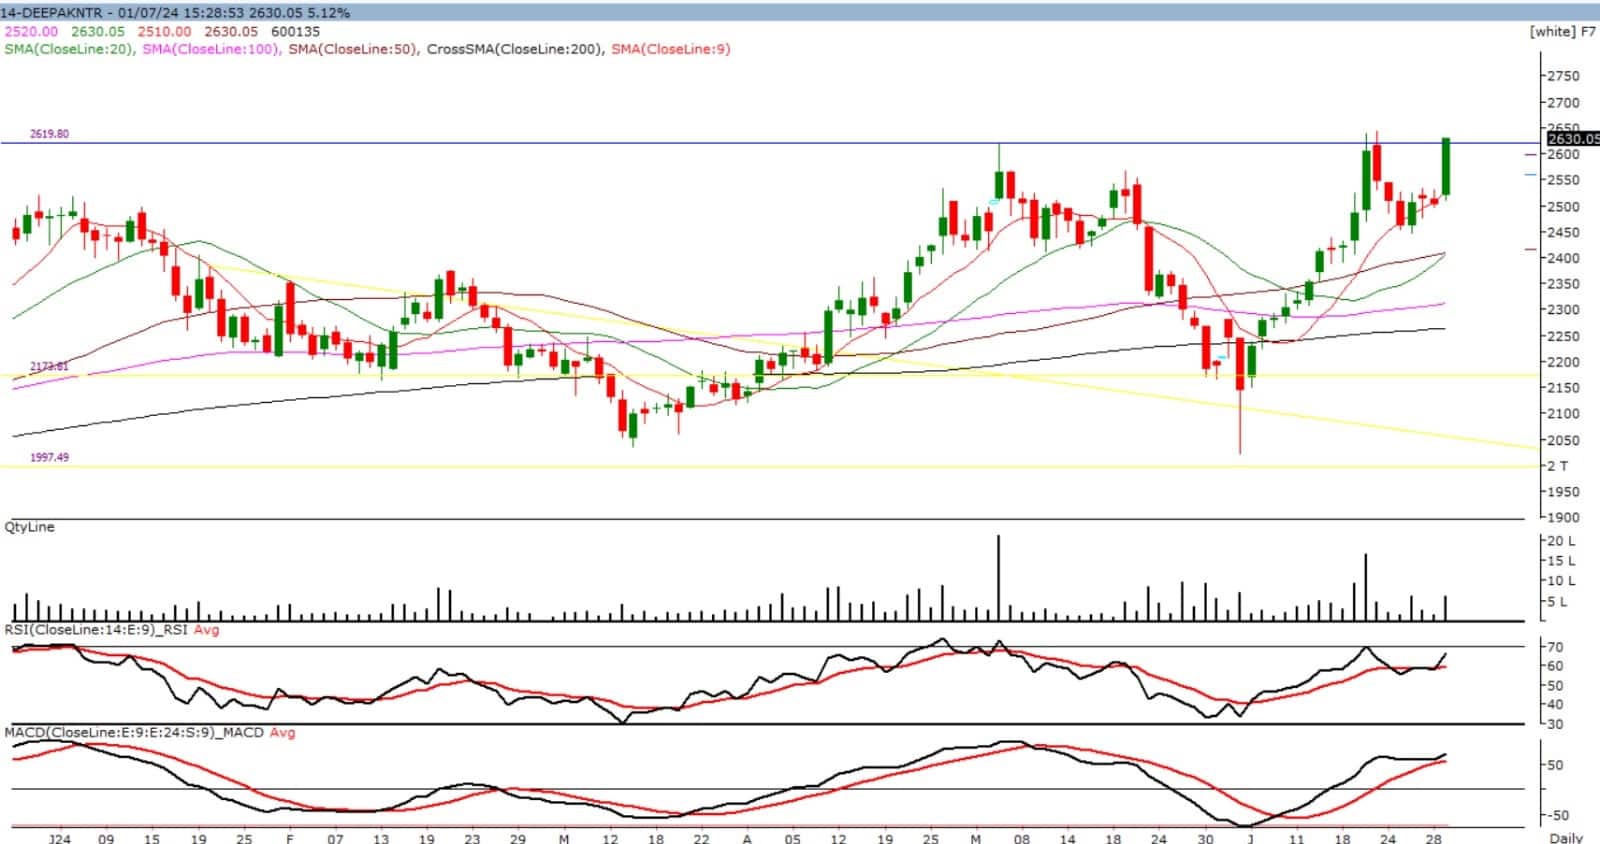
Deepak Nitrite has been showing some strength recently, consolidating near the neckline and important resistance level of Rs 2,650. If the strength continues and surpasses the Rs 2,650 level, a rally towards the Rs 2,800 level would be possible in the near term. Above Rs 2,800, the stock can surge towards its all-time high level of Rs 3,000. On the downside, the first base will be at the psychological support of Rs 2,500. A slip below this could lead towards the important support of Rs 2,410, where the 20 and 50 DMA are placed.
Strategy: Buy
Target: Rs 2,840
Stop-Loss: Rs 2,490
Jay Thakkar, Vice President & Head of Derivatives and Quant Research at ICICI SecuritiesGujarat Gas | CMP: Rs 646.95
Gujarat Gas has provided a breakout from a sideways consolidation, i.e., from a falling channel. It has retested the pattern as well, and it has again started to form higher tops and higher bottoms on the daily as well as hourly charts. The momentum indicator MACD has come back into buy mode, which is a bullish sign in the near term. Thus, overall, the technical outlook is quite bullish. The Nifty Oil and Gas index has also started to form higher tops and bottoms, indicating that the overall trend of the sector is bullish. The short-term support is pegged at Rs 626 and Rs 611, whereas the targets are Rs 680 and Rs 710
Strategy: Buy
Target: Rs 680, Rs 710
Stop-Loss: Rs 626
Tata Consultancy Services | CMP: Rs 3,978.2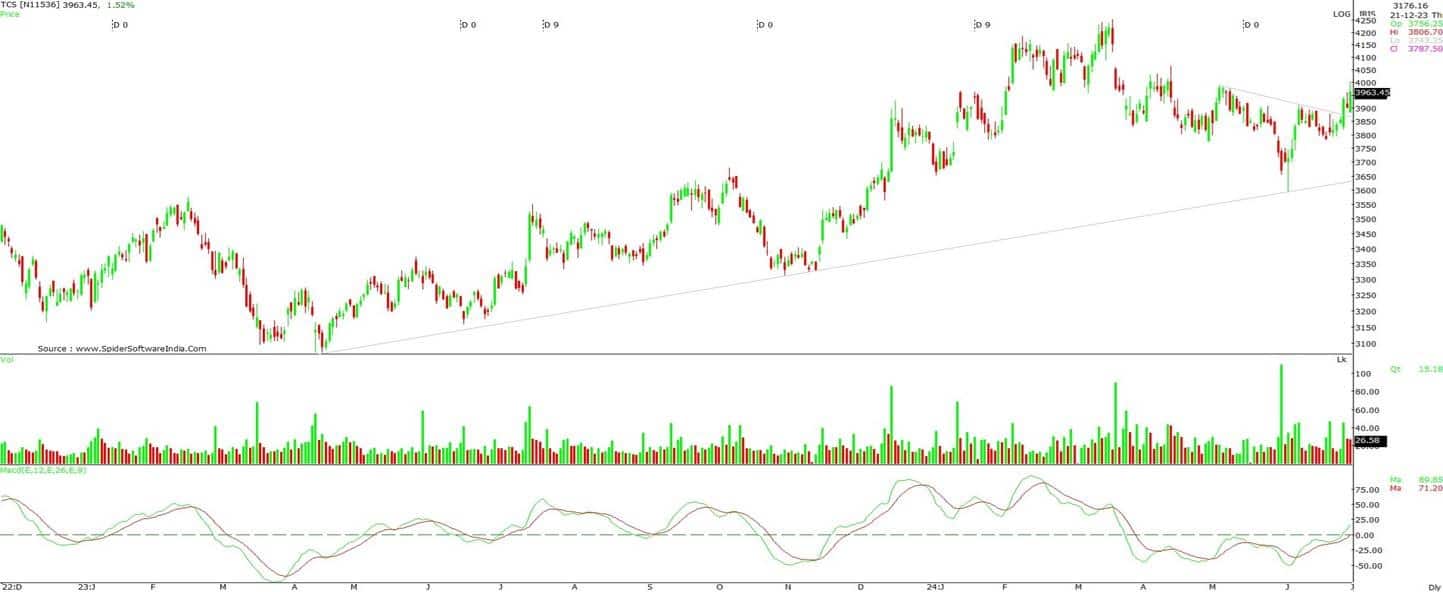
TCS has provided a breakout from the falling trendline with a bullish crossover on its momentum indicator on the daily charts. It had also taken good support at its uptrend line. It has started to form higher tops and bottoms, and the entire Nifty IT sector seems to have reversed from down to up, so the trend is positive in the short term. The immediate support is pegged at Rs 3,850, whereas the resistance is pegged at Rs 4,100. In this up move, it is likely to fill its bearish gap. From the derivatives point of view, it has seen good short covering from the lower levels and now it has seen some long additions, thus it can be the start of a fresh uptrend in the short term.
Strategy: Buy
Target: Rs 4,100
Stop-Loss: Below Rs 3,900
Chambal Fertilisers and Chemicals | CMP: Rs 523.15
Technically, Chambal Fertilisers has been forming higher tops and higher bottoms on the hourly, daily, and weekly charts. The momentum indicator MACD has also come back into buy mode on the hourly charts. It seems to have completed a wave 4 consolidation on the daily charts, and wave 5 up seems to have started. It has provided a bullish breakout from the sideways consolidation; hence Rs 495 is the immediate support for the long positions. On the upside, it is likely to hit its recent swing high of Rs 574 and inch towards Rs 590 levels positionally. From the derivatives point of view, it has also seen good long built-up, and post some long unwinding, it has again started to see long built-up, so the overall trend is bullish.
Strategy: Buy
Target: Rs 590
Stop-Loss: Rs 495
Disclaimer: The views and investment tips expressed by experts on Moneycontrol are their own and not those of the website or its management. Moneycontrol advises users to check with certified experts before taking any investment decisions.Discover the latest Business News, Sensex, and Nifty updates. Obtain Personal Finance insights, tax queries, and expert opinions on Moneycontrol or download the Moneycontrol App to stay updated!
Find the best of Al News in one place, specially curated for you every weekend.
Stay on top of the latest tech trends and biggest startup news.


