


The Nifty 50 tumbled 1.27 percent on March 6, erasing all its previous day’s gains and taking the total weekly loss to 2.9 percent, as intensified US-Israel-Iran war-driven West Asia tensions lifted oil prices to nearly $111 a barrel, signalling fears over economic and earnings growth. The spiking VIX, along with bearish technical and momentum indicators, has now put 24,300 — the previous week’s low — at major risk. In fact, experts feel the index is likely to break this support, and if that comes true and sustains below it, a correction towards 24,000-23,800 cannot be ruled out in the upcoming session. However, in case of an upside bounce, 24,700 is the level to watch.
Here are 15 data points we have collated to help you spot profitable trades:
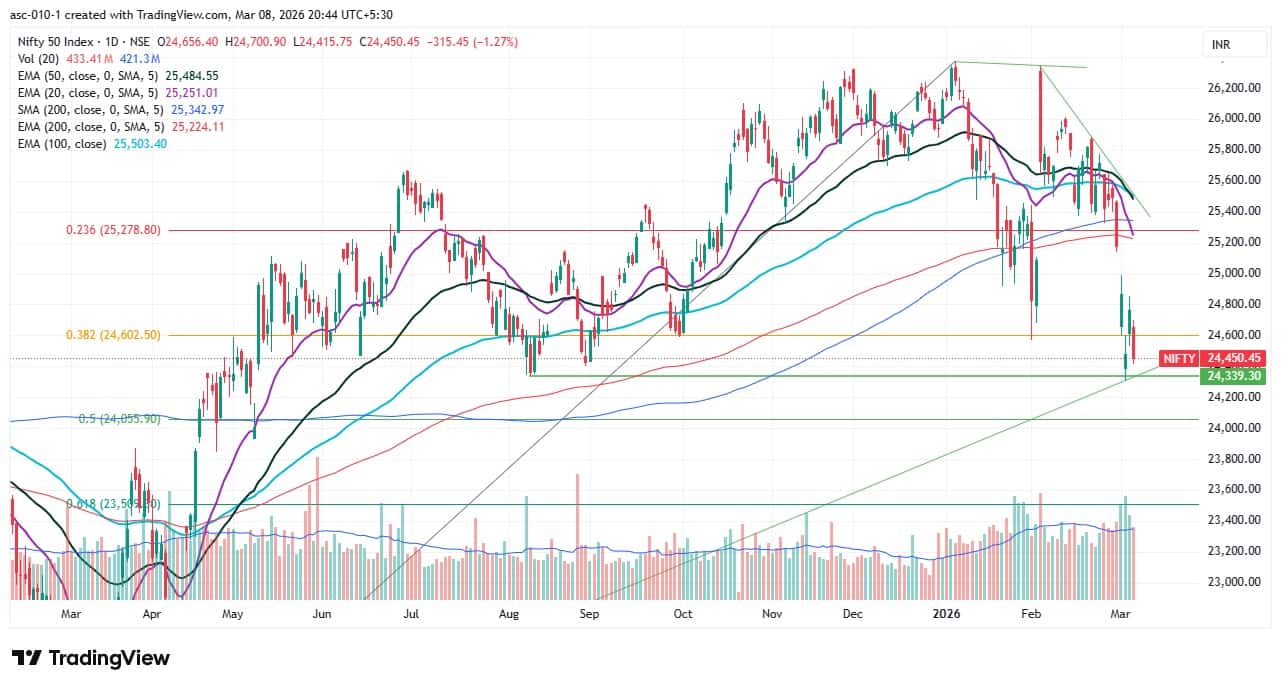
1) Key Levels For The Nifty 50 (24,450)
Resistance based on pivot points: 24,631, 24,699, and 24,807
Support based on pivot points: 24,413, 24,346, and 24,237
Special Formation: The Nifty 50 formed a long bearish candle on the daily charts with minor upper and lower shadows, along with a lower high–lower low formation, indicating a weakening trend amid mild volatility. The index also reached closer to the critical rising long support trendline (24,350 — adjoining lows of March 2020, April 2025, and last week). All the moving averages have now trended downward, while the MACD and signal line’s bearish gap widened with an expansion of the red histogram. The RSI slipped to 33.45, while the Stochastic RSI maintained a positive crossover in the oversold zone. All this indicates a weakening momentum with the risk of further downside if key supports are breached.
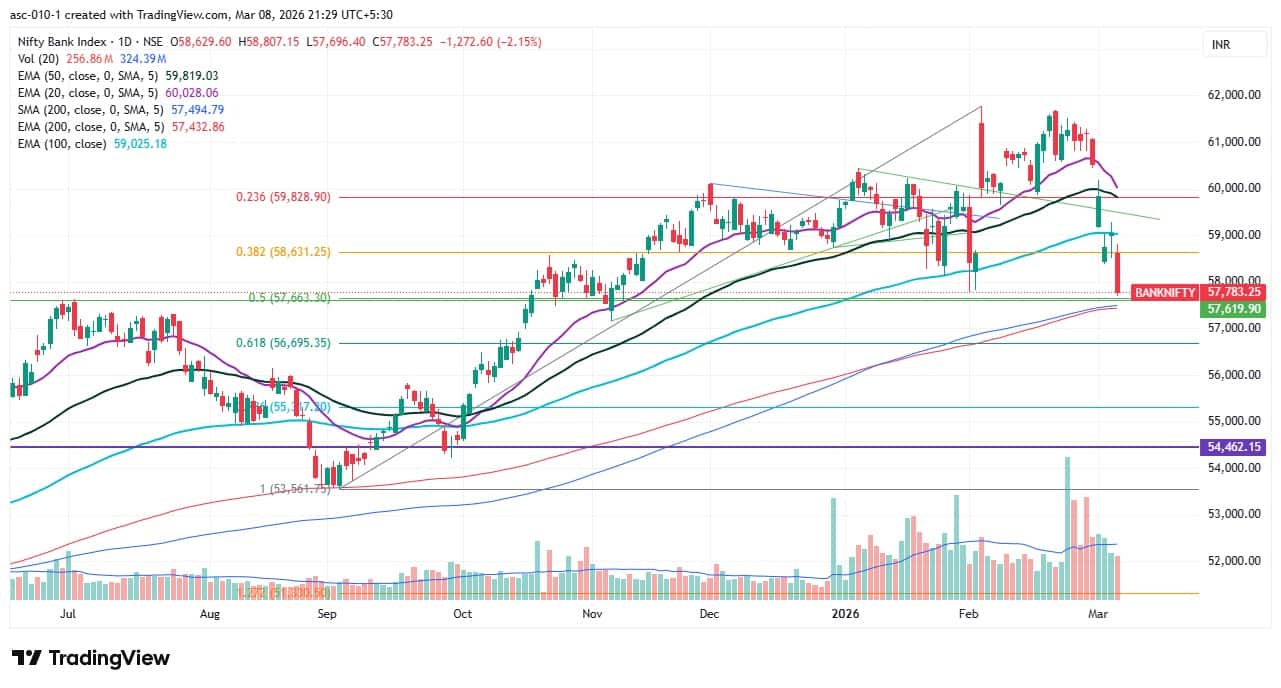
2) Key Levels For The Bank Nifty (57,783)
Resistance based on pivot points: 58,520, 58,782, and 59,206
Support based on pivot points: 57,671, 57,409, and 56,985
Resistance based on Fibonacci retracement: 58,656, 59,250
Support based on Fibonacci retracement: 57,663, 56,695
Special Formation: The Nifty Bank also formed a long red candle on the daily timeframe and fell decisively below the 100-day EMA, while reaching closer to the 200-day EMA, indicating bears are tightening their grip. All the short- and medium-term moving averages have trended downward, while the index is 120 points away from the 50 percent Fibonacci retracement level (from the September 2025 low to the February 2026 high). The RSI dropped to 31.91, while the MACD remained below the reference line and zero line with a widening red histogram bar. All this indicates persistent bearish momentum and the possibility of further downside if the index fails to hold near the 200-day EMA.
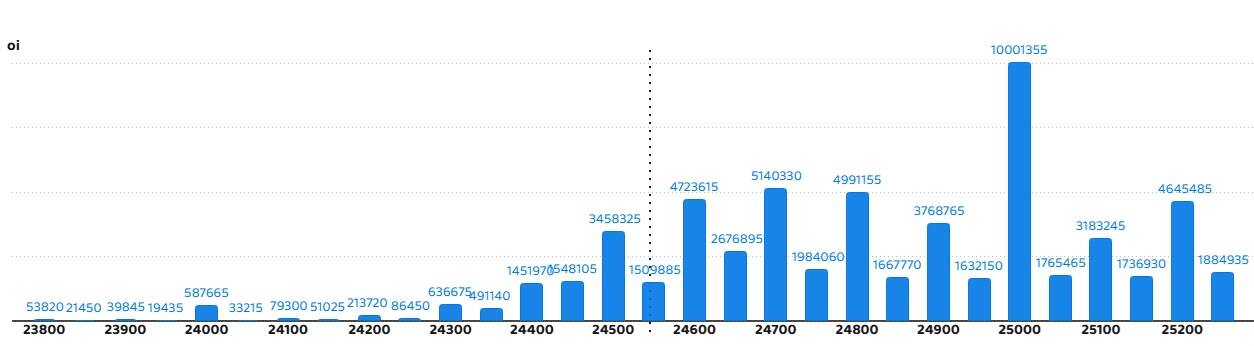
According to the weekly options data, the 25,000 strike holds the maximum Call open interest (with 1 crore contracts). This level can act as a key resistance level for the Nifty in the short term. It was followed by the 24,700 strike (51.4 lakh contracts) and 24,800 strike (49.91 lakh contracts).
Maximum Call writing was observed at the 25,000 strike, which saw an addition of 33.11 lakh contracts, followed by the 24,700 and 24,600 strikes, which added 27.54 lakh and 26.64 lakh contracts, respectively. The maximum Call unwinding was seen at the 24,150 strike, which shed 12,350 contracts, followed by the 24,100 and 24,050 strikes, which shed 7,150 and 4,485 contracts, respectively.
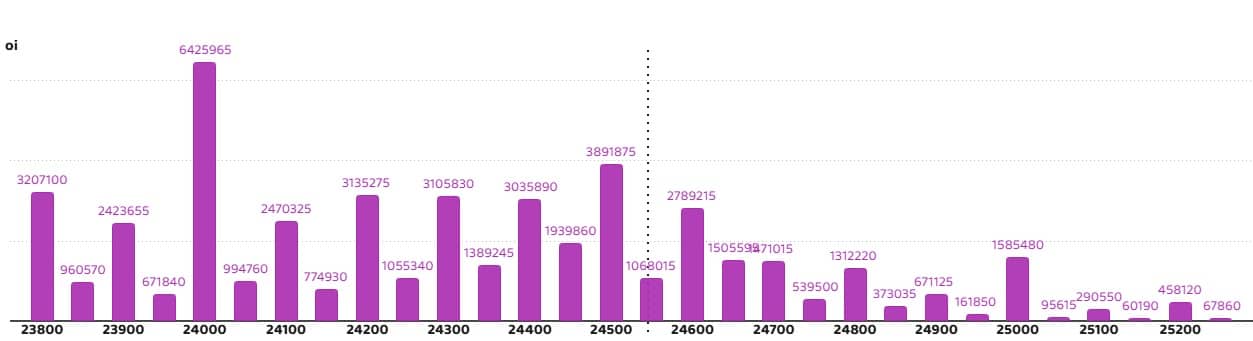
On the Put side, the maximum Put open interest was seen at the 24,000 strike (with 64.25 lakh contracts), which can act as a key support level for the Nifty in the short term. It was followed by the 24,500 strike (38.91 lakh contracts) and the 23,800 strike (32.07 lakh contracts).
The maximum Put writing was placed at the 24,450 strike, which saw an addition of 7.36 lakh contracts, followed by the 24,200 and 23,900 strikes, which added 5.51 lakh and 5.43 lakh contracts, respectively. The maximum Put unwinding was seen at the 24,600 strike, which shed 15.06 lakh contracts, followed by the 24,500 and 24,700 strikes, which shed 14.71 lakh and 13.28 lakh contracts, respectively.
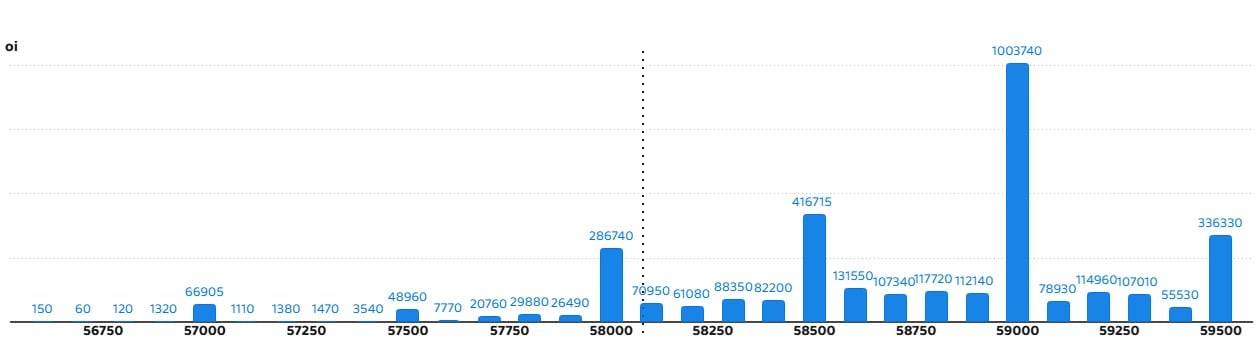
5) Bank Nifty Call Options Data
According to the monthly options data, the 59,000 strike holds the maximum Call open interest, with 10.03 lakh contracts. This can act as a key resistance level for the index in the short term. It was followed by the 58,500 strike (4.16 lakh contracts) and the 59,500 strike (3.36 lakh contracts).
Maximum Call writing was observed at the 59,000 strike (with the addition of 2.7 lakh contracts), followed by the 58,500 strike (2.64 lakh contracts) and 58,000 strike (1.43 lakh contracts). The maximum Call unwinding was seen at the 59,300 strike, which shed 21,390 contracts, followed by the 59,100 strike, which shed 3,240 contracts.
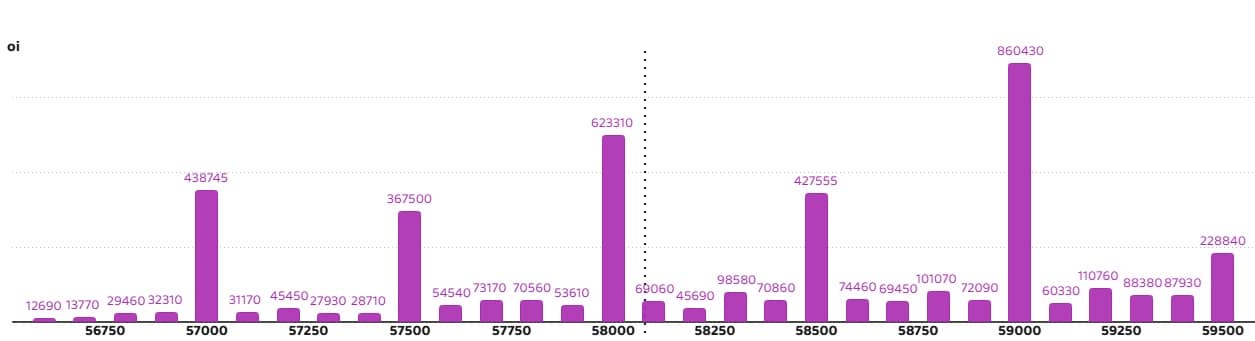
6) Bank Nifty Put Options Data
On the Put side, the maximum Put open interest was seen at the 59,000 strike (with 8.6 lakh contracts), which can act as a key level for the index. This was followed by the 58,000 strike (6.23 lakh contracts) and the 57,000 strike (4.38 lakh contracts).
The maximum Put writing was placed at the 57,500 strike (which added 66,930 contracts), followed by the 58,300 (52,050 contracts) and 58,100 (40,440 contracts). The maximum Put unwinding was seen at the 59,000 strike, which shed 70,620 contracts, followed by the 59,300 and 59,500 strikes, which shed 49,680 and 38,310 contracts, respectively.
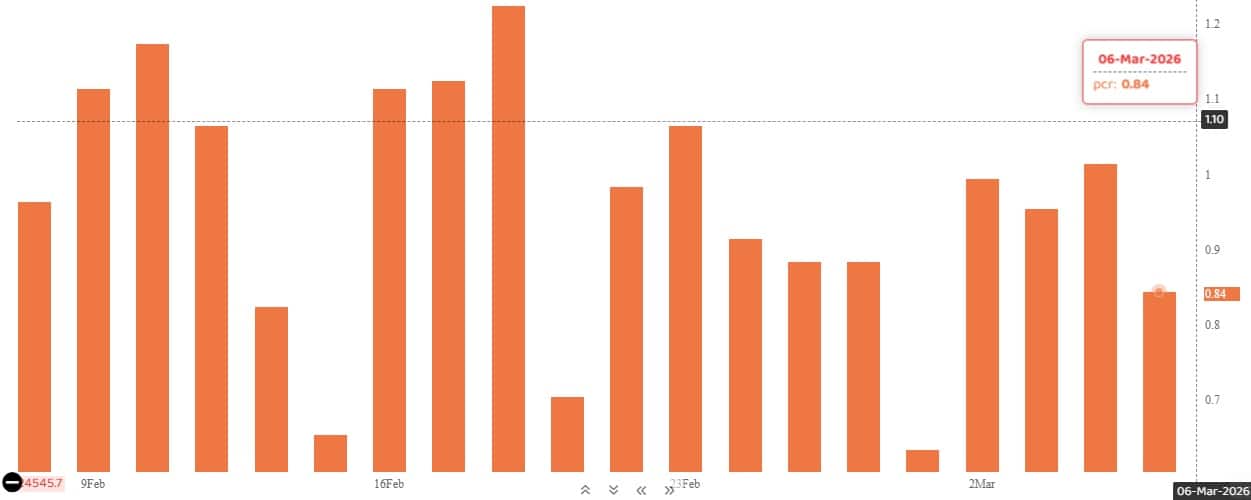
The Nifty Put-Call ratio (PCR), which indicates the mood of the market, fell to 0.84 on March 6, compared to a 1.01 in previous session.
The increasing PCR, or being higher than 0.7 or surpassing 1, means traders are selling more Put options than Call options, which generally indicates the firming up of a bullish sentiment in the market. If the ratio falls below 0.7 or moves towards 0.5, then it indicates selling in Calls is higher than selling in Puts, reflecting a bearish mood in the market.
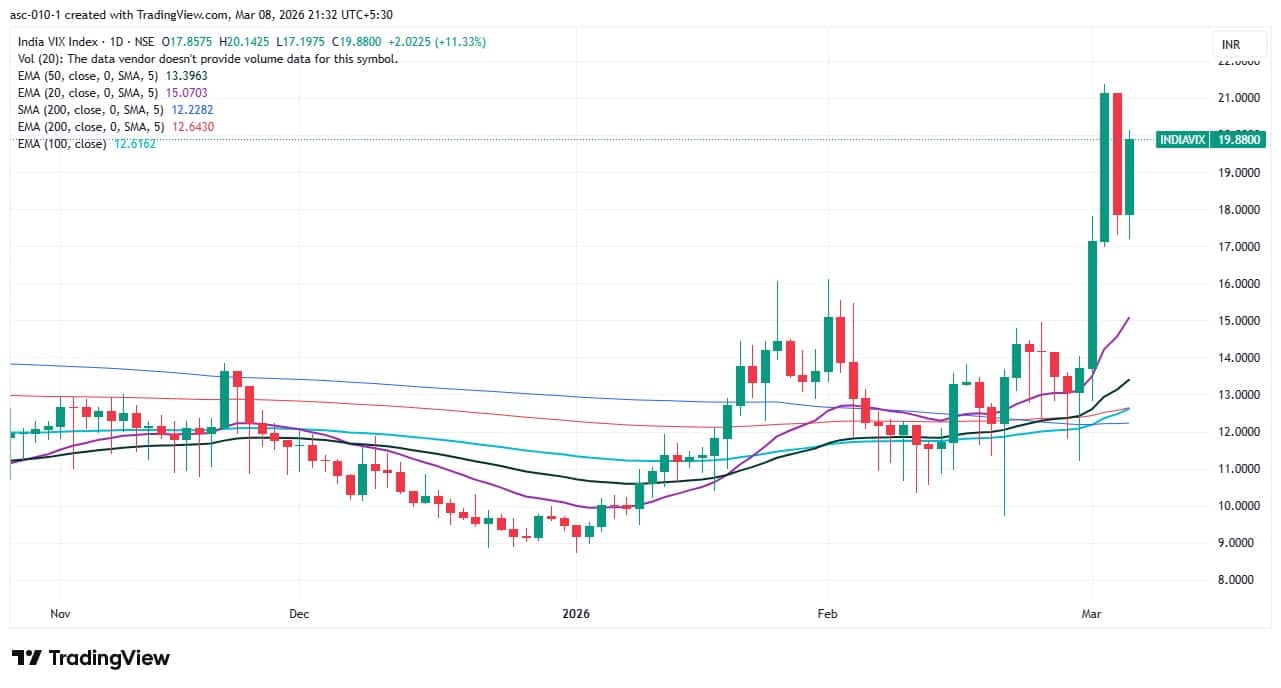
9) India VIX
The India VIX, which measures expected market volatility, soared 11.33 percent to 19.88 after a day of sharp fall and remained in an elevated zone, increasing the risk for bulls. Bulls may not be in a comfort zone unless the VIX starts quoting below the 12 zone.
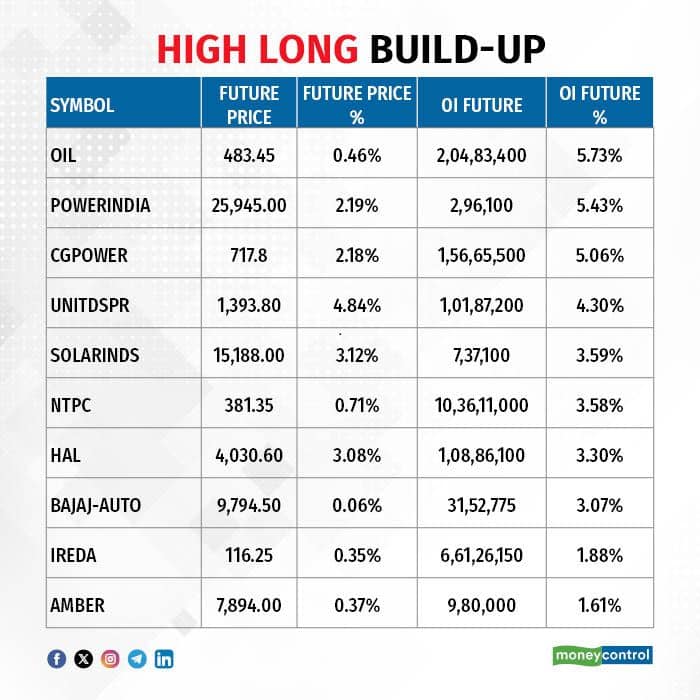
A long build-up was seen in 24 stocks. An increase in open interest (OI) and price indicates a build-up of long positions.
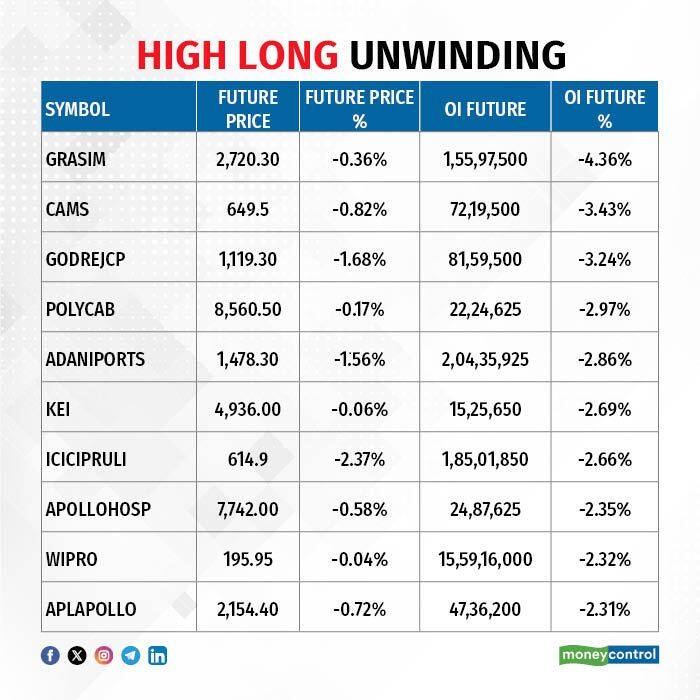
11) Long Unwinding (52 Stocks)
52 stocks saw a decline in open interest (OI) along with a fall in price, indicating long unwinding.
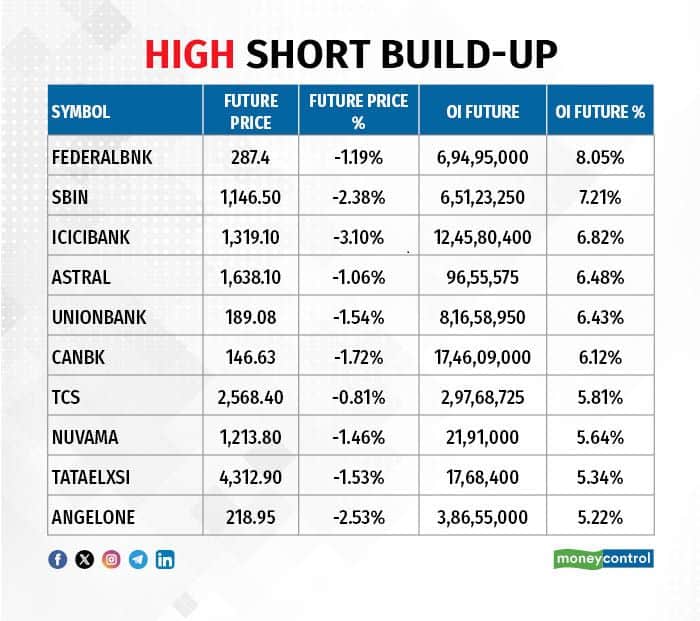
12) Short Build-up (104 Stocks)
104 stocks saw an increase in OI along with a fall in price, indicating a build-up of short positions.
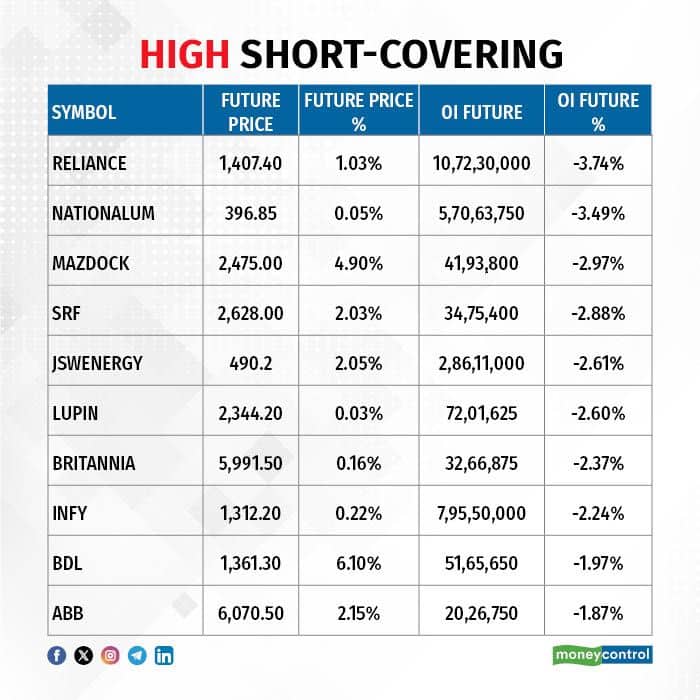
13) Short-Covering (29 Stocks)
29 stocks saw short-covering, meaning a decrease in OI, along with a price increase.
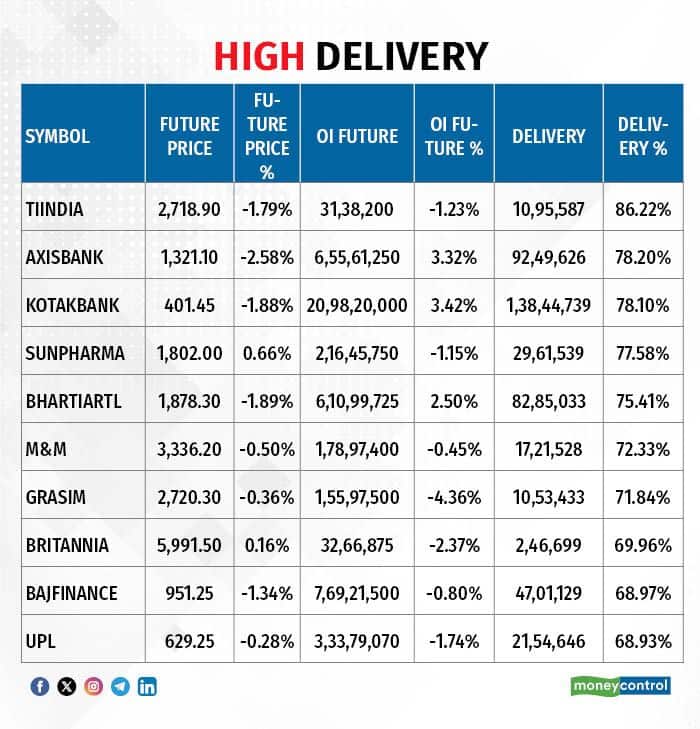
Here are the stocks that saw a high share of delivery trades. A high share of delivery reflects investing (as opposed to trading) interest in a stock.
Securities banned under the F&O segment include companies where derivative contracts cross 95 percent of the market-wide position limit.
Stocks added to F&O ban: Nil
Stocks retained in F&O ban: SAIL, Sammaan Capital
Stocks removed from F&O ban: Nil
Disclaimer: The views and investment tips expressed by experts on Moneycontrol are their own and not those of the website or its management. Moneycontrol advises users to check with certified experts before taking any investment decisions.Disclaimer: Moneycontrol is a part of the Network18 group. Network18 is controlled by Independent Media Trust, of which Reliance Industries is the sole beneficiary.Discover the latest Business News, Sensex, and Nifty updates. Obtain Personal Finance insights, tax queries, and expert opinions on Moneycontrol or download the Moneycontrol App to stay updated!
Find the best of Al News in one place, specially curated for you every weekend.
Stay on top of the latest tech trends and biggest startup news.


