


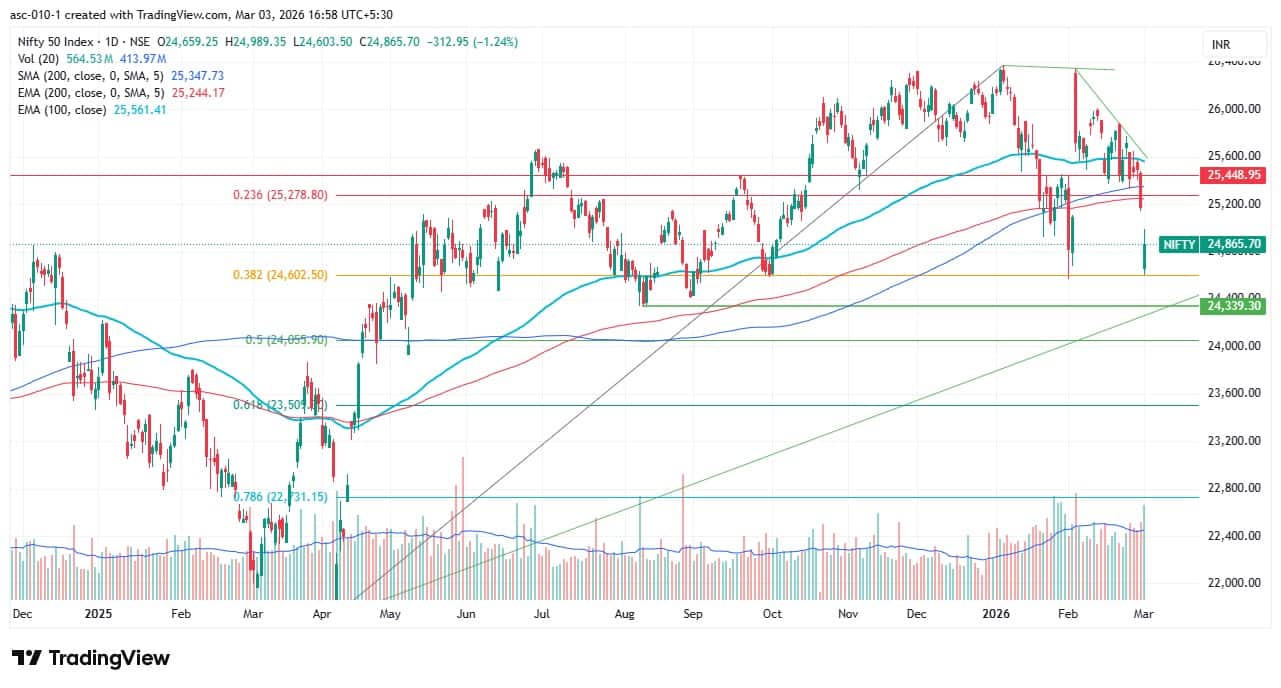
The Nifty 50 nosedived 1.24 percent on March 2 after a gap-down opening, extending its sharp downtrend for the second consecutive session as Middle East tensions intensified. However, there was over a one percent recovery from the day's low near 24,600. Given the complete dominance of bears, driven by subdued momentum, weak technical indicators, and a US-Iran war-led sell-off across global markets, the previous day's low (24,603) and the August low (24,338) are expected to be at major risk in the upcoming session. Below these levels, bears may target 24,000 — a psychological support and near the 50 percent Fibonacci retracement of the April 2025 low to the January 2026 high. However, on the higher side, 25,000 is likely to act as a key hurdle, according to experts.
Here are 15 data points we have collated to help you spot profitable trades:
1) Key Levels For The Nifty 50 (24,866)
Resistance based on pivot points: 24,967, 25,056, and 25,205
Support based on pivot points: 24,672, 24,581, and 24,434
Special Formation: The Nifty 50 formed a green candle on the daily charts due to buying interest at lower levels, but there was a bearish gap of 152 points after a big gap-down opening. The index traded well below the 200-day EMA and almost reached the Union Budget day's low intraday. The RSI dropped to 35.48, and the Stochastic RSI declined to 4.6, while the MACD sustained well below the zero line with a long red histogram. All this indicates continued bearish momentum despite the intraday recovery.
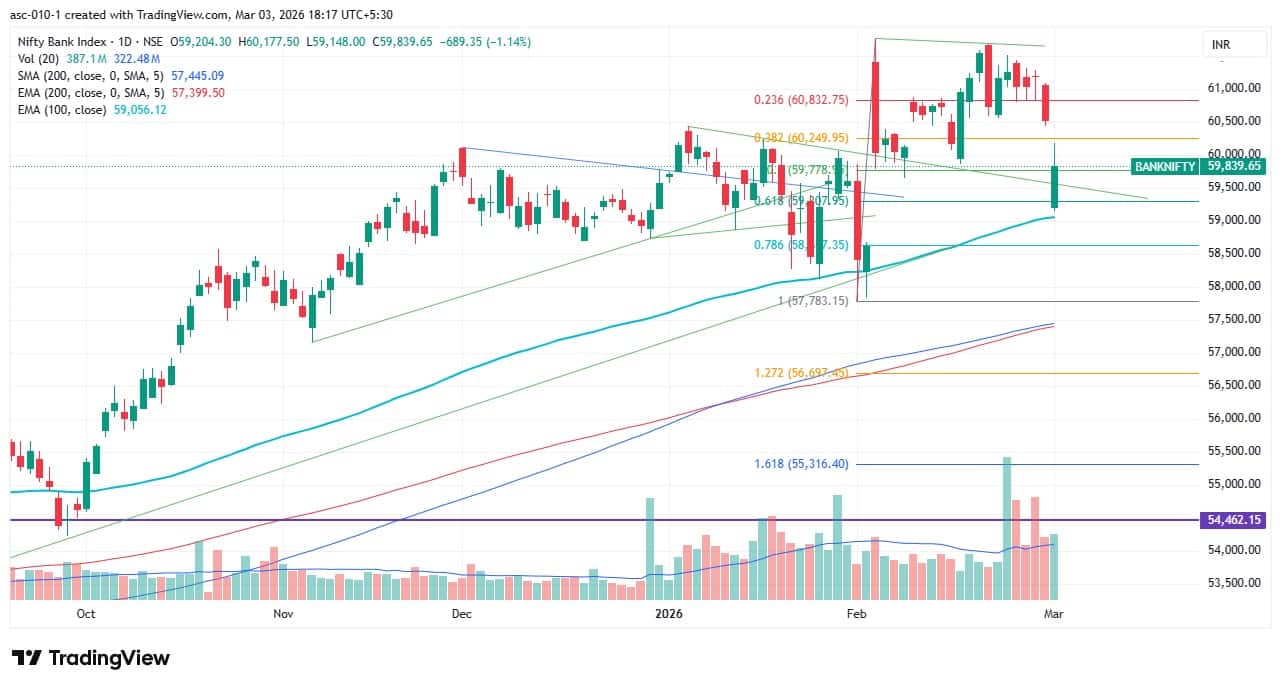
2) Key Levels For The Bank Nifty (59,840)
Resistance based on pivot points: 60,115, 60,358, and 60,751
Support based on pivot points: 59,328, 59,085, and 58,692
Resistance based on Fibonacci retracement: 60,151, 60,460
Support based on Fibonacci retracement: 59,308, 58,637
Special Formation: The Bank Nifty also mirrored the Nifty 50 and formed a bullish candle due to recovery from the day's low, but there was a bearish gap of 261 points after the gap-down opening. The index managed to close above the 50 percent Fibonacci retracement (of the February low to high), but momentum maintained a sell signal. The RSI slipped to 44.06, and the MACD sustained a downward bias with an expansion of the red histogram. The Stochastic RSI fell to 13.91. The index fell below the 50-day EMA but still held above the 100-day EMA (59,056), which is the next immediate support. All this indicates sustained weakness, with limited signs of reversal.
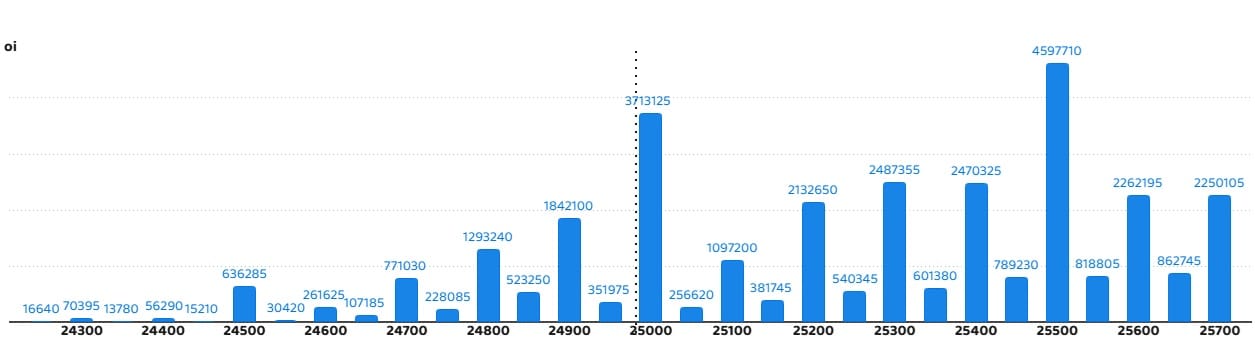
According to the weekly options data, the maximum Call open interest was seen at the 25,500 strike (with 45.97 lakh contracts). This level can act as a key resistance level for the Nifty in the short term. It was followed by the 25,000 strike (37.13 lakh contracts) and 25,300 strike (24.87 lakh contracts).
Maximum Call writing was observed at the 25,000 strike, which saw an addition of 34.54 lakh contracts, followed by the 25,500 and 24,900 strikes, which added 19.8 lakh and 17.86 lakh contracts, respectively. There was hardly any Call unwinding seen in the 24,300-25,700 strike band.
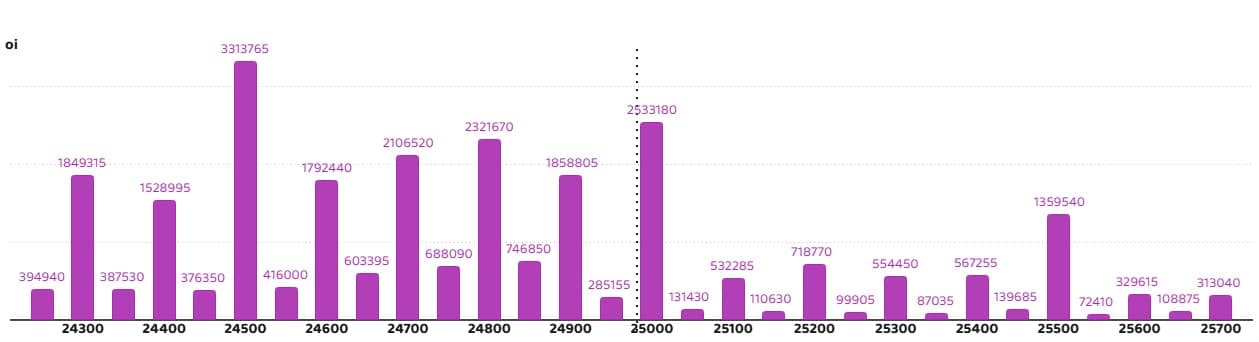
On the Put side, the 24,500 strike holds the maximum Put open interest (with 33.13 lakh contracts), which can act as a key support level for the Nifty in the short term. It was followed by the 25,000 strike (25.33 lakh contracts) and the 24,800 strike (23.21 lakh contracts).
The maximum Put writing was placed at the 24,500 strike, which saw an addition of 18.9 lakh contracts, followed by the 24,800 and 24,700 strikes, which added 14.76 lakh and 13.75 lakh contracts, respectively. The maximum Put unwinding was seen at the 25,200 strike, which shed 3.83 lakh contracts, followed by the 25,300 and 25,400 strikes, which shed 3.35 lakh and 3.15 lakh contracts, respectively.
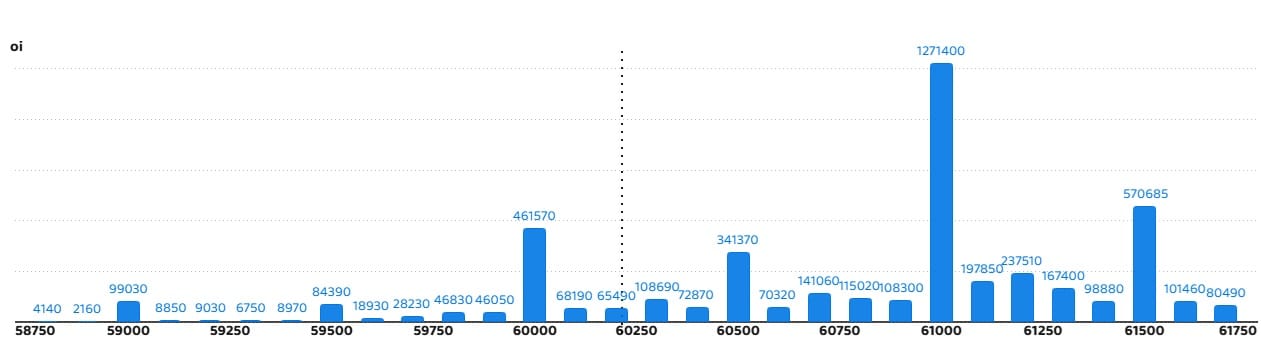
5) Bank Nifty Call Options Data
According to the monthly options data, the maximum Call open interest was seen at the 61,000 strike, with 12.71 lakh contracts. This can act as a key resistance level for the index in the short term. It was followed by the 61,500 strike (5.7 lakh contracts) and the 60,000 strike (4.61 lakh contracts).
Maximum Call writing was observed at the 60,000 strike (with the addition of 2.16 lakh contracts), followed by the 60,500 strike (1.33 lakh contracts) and 60,300 strike (94,770 contracts). The maximum Call unwinding was seen at the 61,000 strike, which shed 4.12 lakh contracts, followed by the 61,200 and 61,600 strikes, which shed 48,450 and 35,220 contracts, respectively.
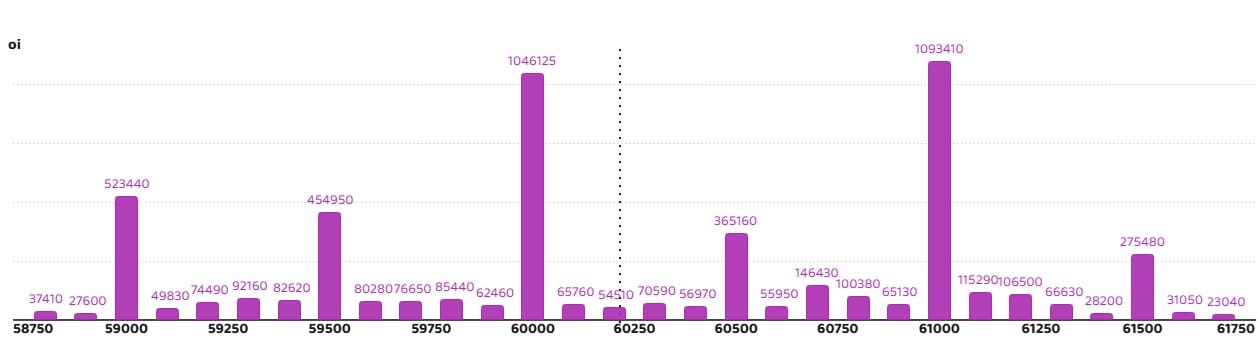
6) Bank Nifty Put Options Data
On the Put side, the 61,000 strike holds the maximum Put open interest (with 10.93 lakh contracts), which can act as a key level for the index. This was followed by the 60,000 strike (10.46 lakh contracts) and the 59,000 strike (5.23 lakh contracts).
The maximum Put writing was placed at the 59,500 strike (which added 92,040 contracts), followed by the 59,000 and 59,600 strikes (each added 35,850 contracts). The maximum Put unwinding was seen at the 61,000 strike, which shed 4.96 lakh contracts, followed by the 60,500 and 60,800 strikes, which shed 71,820 and 62,670 contracts, respectively.
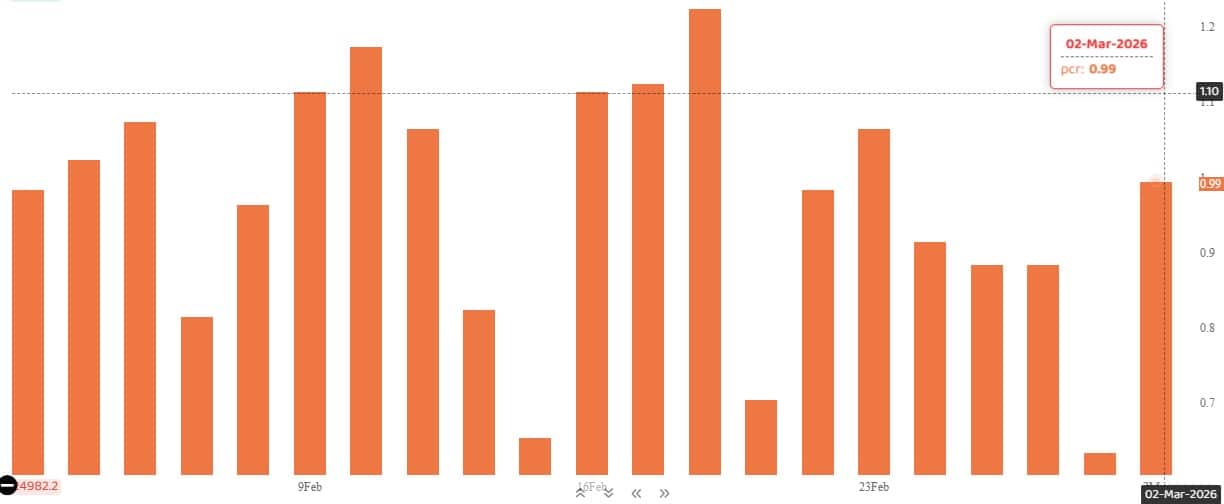
The Nifty Put-Call ratio (PCR), which indicates the mood of the market, spiked to 0.99 on March 2, compared to a 0.63 in previous session.
The increasing PCR, or being higher than 0.7 or surpassing 1, means traders are selling more Put options than Call options, which generally indicates the firming up of a bullish sentiment in the market. If the ratio falls below 0.7 or moves towards 0.5, then it indicates selling in Calls is higher than selling in Puts, reflecting a bearish mood in the market.
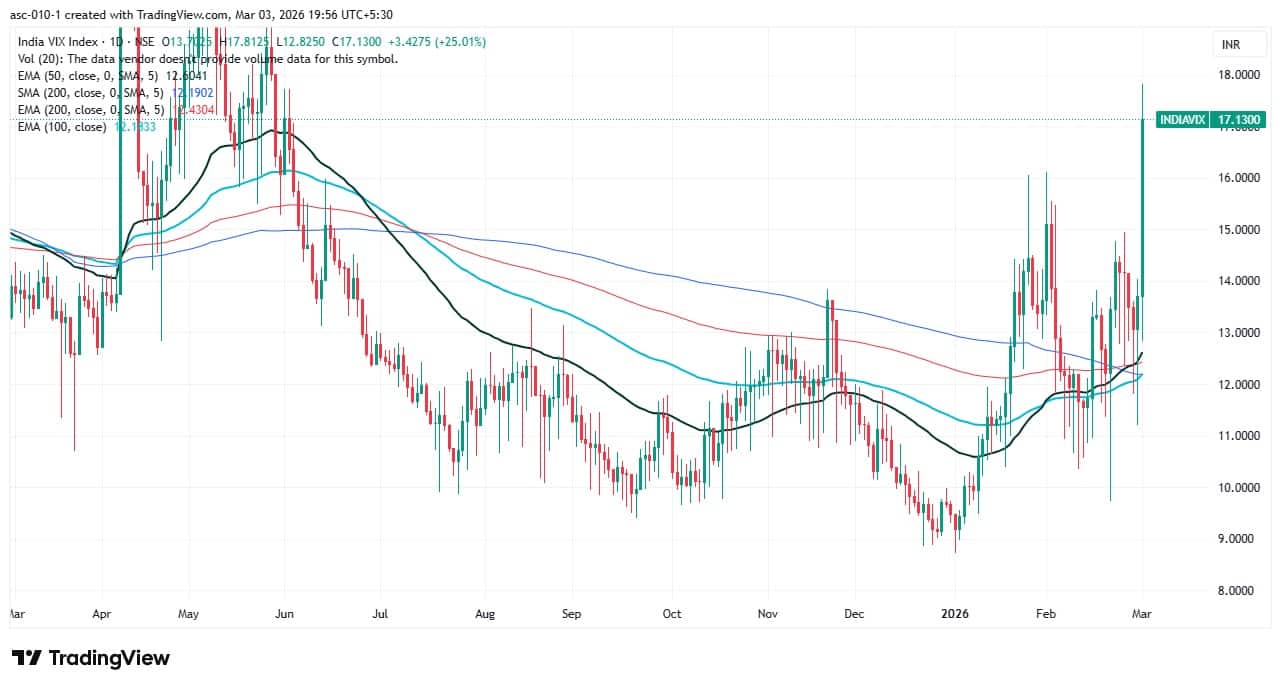
9) India VIX
The fear gauge, India VIX, zoomed to 17.13 — the highest closing level since June 2, 2025 — rising 25.01 percent on Monday, marking its highest single-day rally since April 7, 2025. This signals rising risk for the bulls. Elevated VIX levels may keep bulls in a discomfort zone.
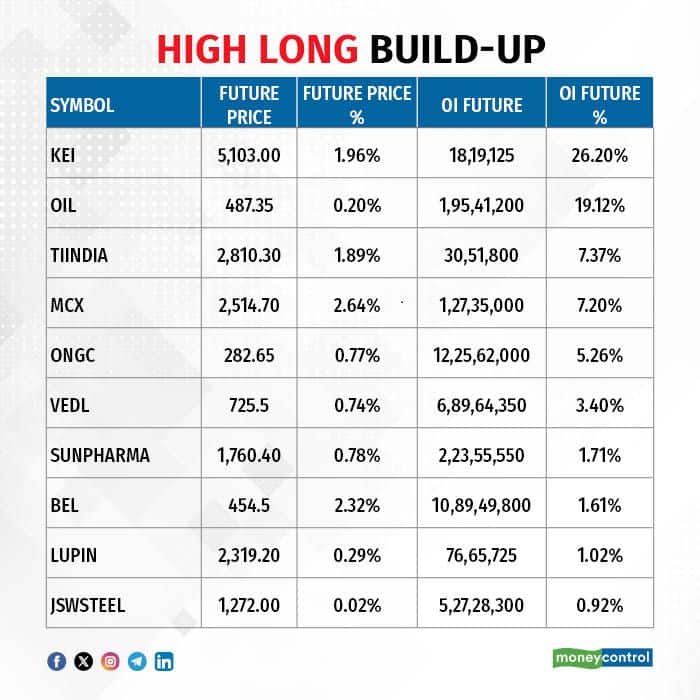
A long build-up was seen in 13 stocks. An increase in open interest (OI) and price indicates a build-up of long positions.
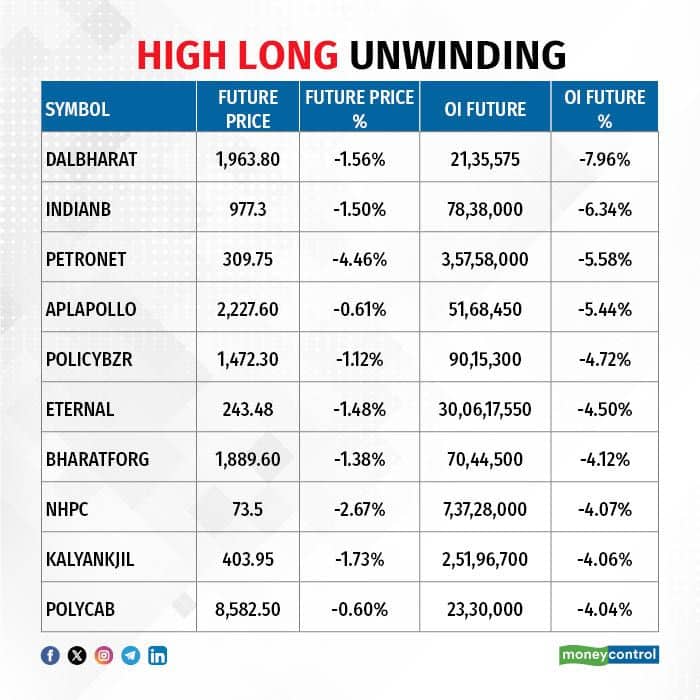
11) Long Unwinding (103 Stocks)
103 stocks saw a decline in open interest (OI) along with a fall in price, indicating long unwinding.
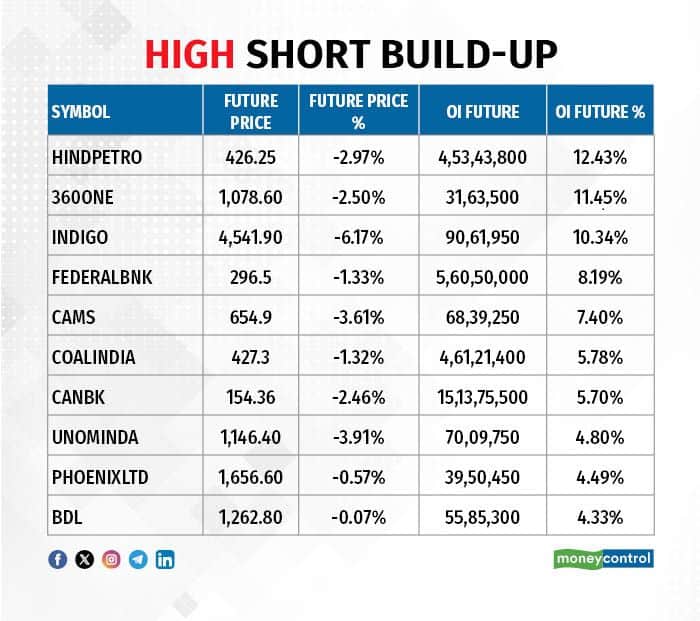
12) Short Build-up (86 Stocks)
86 stocks saw an increase in OI along with a fall in price, indicating a build-up of short positions.
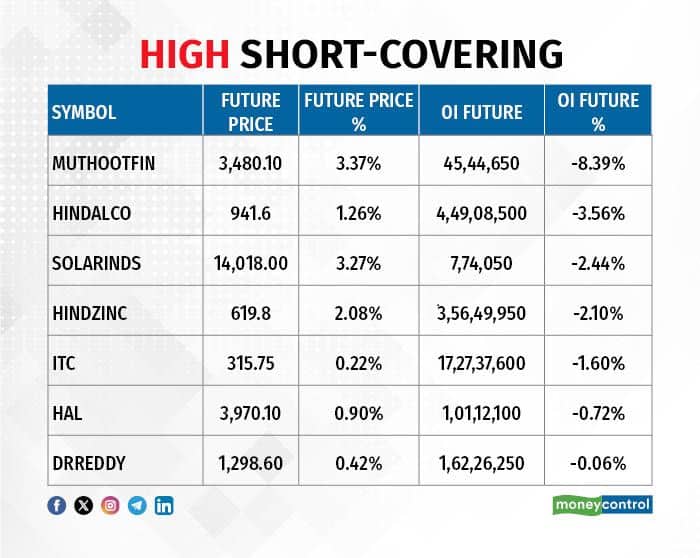
7 stocks saw short-covering, meaning a decrease in OI, along with a price increase.
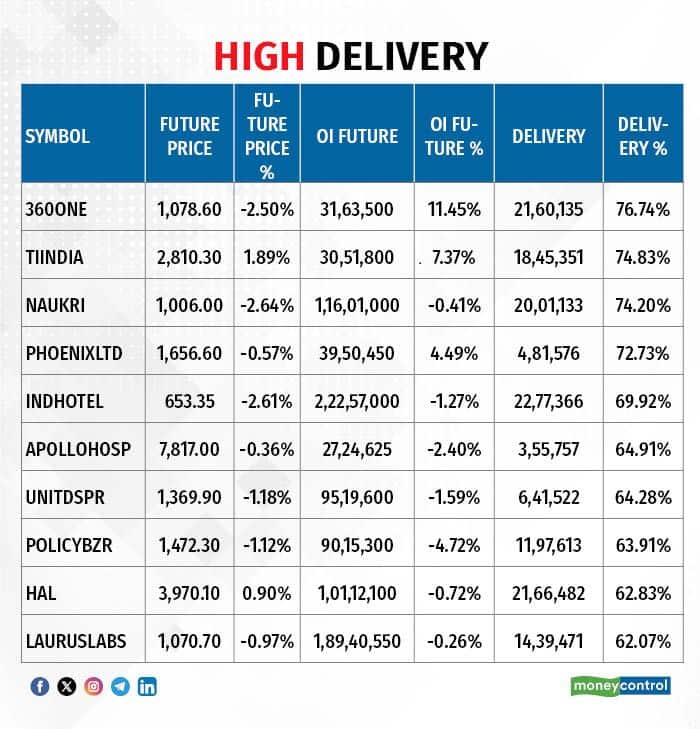
Here are the stocks that saw a high share of delivery trades. A high share of delivery reflects investing (as opposed to trading) interest in a stock.
Securities banned under the F&O segment include companies where derivative contracts cross 95 percent of the market-wide position limit.
Stocks added to F&O ban: Nil
Stocks retained in F&O ban: Sammaan Capital
Stocks removed from F&O ban: Nil
Disclaimer: The views and investment tips expressed by experts on Moneycontrol are their own and not those of the website or its management. Moneycontrol advises users to check with certified experts before taking any investment decisions.Disclaimer: Moneycontrol is a part of the Network18 group. Network18 is controlled by Independent Media Trust, of which Reliance Industries is the sole beneficiary.Discover the latest Business News, Sensex, and Nifty updates. Obtain Personal Finance insights, tax queries, and expert opinions on Moneycontrol or download the Moneycontrol App to stay updated!
Find the best of Al News in one place, specially curated for you every weekend.
Stay on top of the latest tech trends and biggest startup news.


