


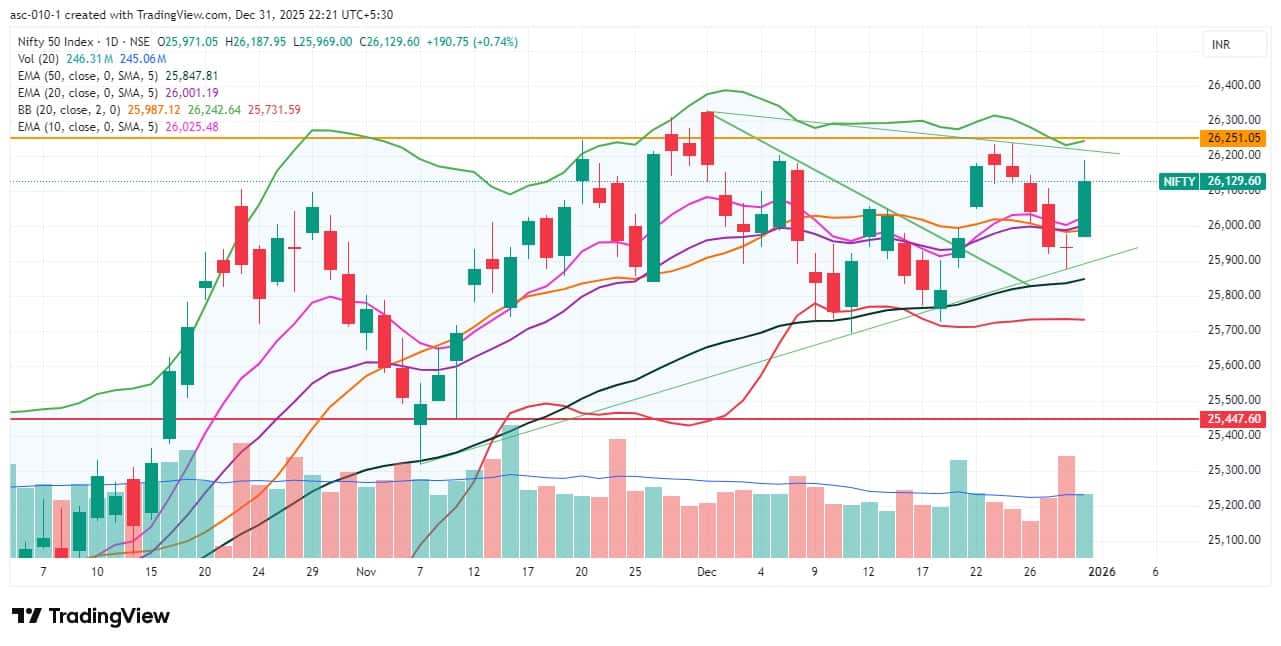
The Nifty 50 broke its four-day losing streak and negated the lower high–lower low formation of the previous three sessions, climbing decisively above the midline of the Bollinger Bands (i.e., the 20-day SMA at 25,987, which is close to 26,000) and closing 0.74 percent higher on December 31. This not only marked a healthy beginning to the January 2026 series but also brought the index back into momentum. Hence, as long as the index sustains above 26,000, 26,200—the immediate key resistance zone—remains the level to watch. Holding above it can open the door for a new high; however, the crucial support is now placed at 25,880, the low of the recent Doji formation, experts said.
Here are 15 data points we have collated to help you spot profitable trades:
1) Key Levels For The Nifty 50 (26,130)
Resistance based on pivot points: 26,179, 26,231, and 26,314
Support based on pivot points: 26,012, 25,960, and 25,877
Special Formation: The Nifty 50 formed a long bullish candle with a minor upper shadow on the daily charts following the Doji pattern formation in the previous session, which ultimately confirmed a higher-bottom formation and the continuation of the larger-degree higher high–higher low structure. The index sustained above short-term moving averages and the midline of the Bollinger Bands. Momentum indicators also showed improvement, with the RSI rising to 56.07 and registering a bullish crossover. The Stochastic RSI and MACD climbed toward their reference lines, with weakness fading in the histogram. All this indicates strengthening bullish momentum.
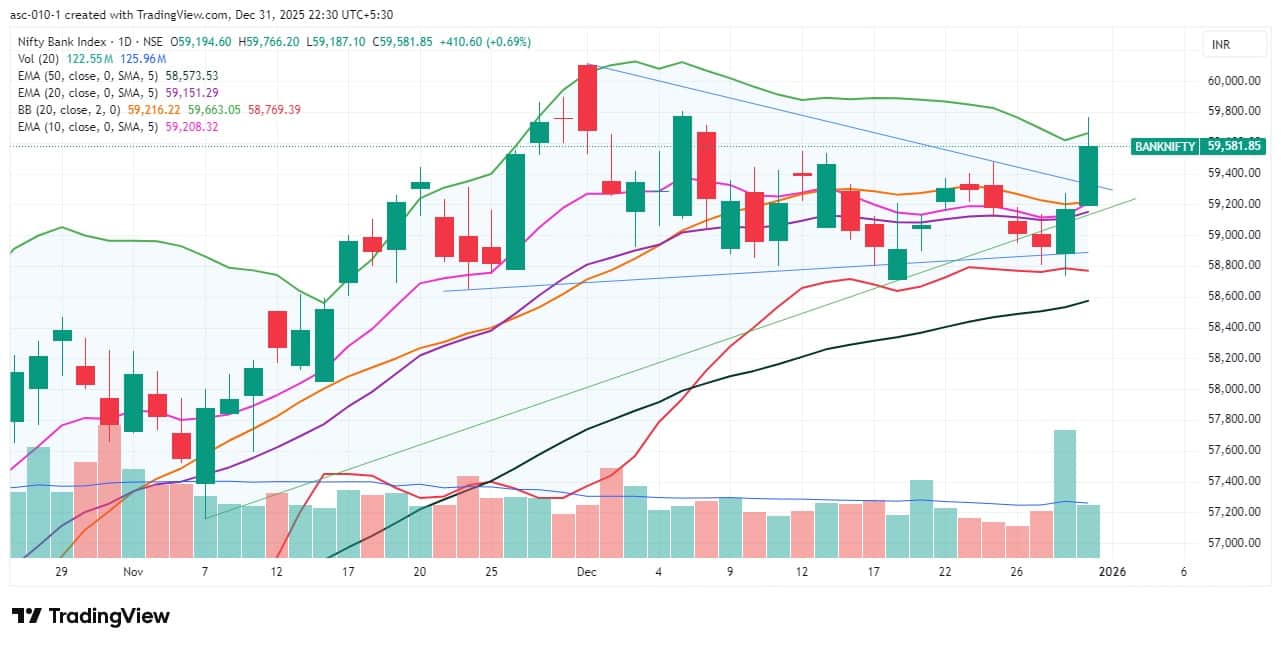
2) Key Levels For The Bank Nifty (59,582)
Resistance based on pivot points: 59,733, 59,870, and 60,091
Support based on pivot points: 59,291, 59,154, and 58,933
Resistance based on Fibonacci retracement: 60,875, 62,294
Support based on Fibonacci retracement: 58,985, 58,636
Special Formation: The Bank Nifty also reported a long green candle with a minor upper shadow on the daily timeframe and hit the upper Bollinger Bands after decisively breaking above the falling resistance trendline, signalling a healthy trend. The banking index convincingly climbed above the midline of the Bollinger Bands and short-term moving averages, indicating the beginning of momentum. Improvement was also visible in momentum indicators, with the RSI (60.07) and Stochastic RSI showing bullish crossovers, while the MACD moved toward its reference line with weakness fading in the histogram. All this indicates improving strength in the banking space.
According to the weekly options data, the maximum Call open interest was seen at the 26,400 strike (with 76.87 lakh contracts). This level can act as a key resistance level for the Nifty in the short term. It was followed by the 26,500 strike (68.99 lakh contracts) and 27,000 strike (64.11 lakh contracts).
Maximum Call writing was observed at the 26,400 strike, which saw an addition of 43.61 lakh contracts, followed by the 26,600 and 26,500 strikes, which added 27.24 lakh and 26.1 lakh contracts, respectively. The maximum Call unwinding was seen at the 26,000 strike, which shed 25.26 lakh contracts, followed by the 25,900 and 25,950 strikes, which shed 10.63 lakh and 9.63 lakh contracts, respectively.
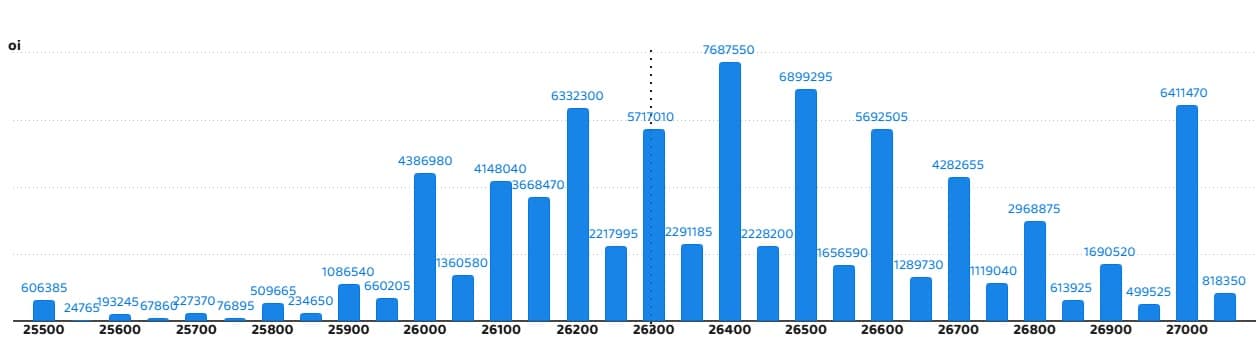
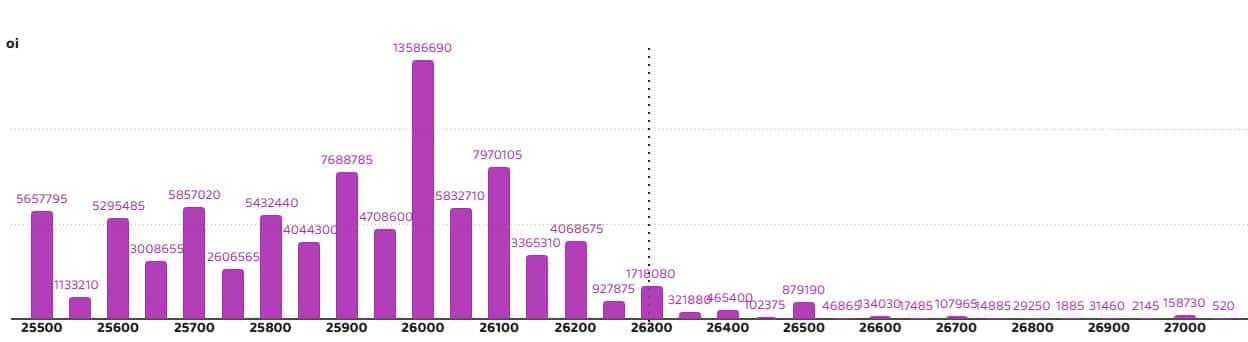
On the Put side, the 26,000 strike holds the maximum Put open interest (with 1.35 crore contracts), which can act as a key support level for the Nifty in the short term. It was followed by the 26,100 strike (79.7 lakh contracts) and the 25,900 strike (76.88 lakh contracts).
The maximum Put writing was placed at the 26,000 strike, which saw an addition of 87.38 lakh contracts, followed by the 26,100 and 26,050 strikes, which added 58.14 lakh and 50.96 lakh contracts, respectively. There was hardly any Put unwinding seen in the 25,500-27,000 strike band
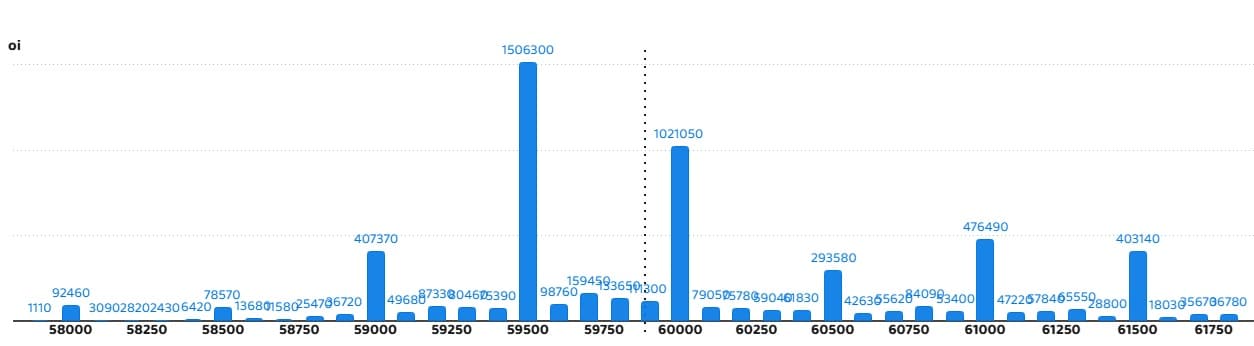
5) Bank Nifty Call Options Data
According to the monthly options data, the 59,500 strike holds the maximum Call open interest, with 15.06 lakh contracts. This can act as a key level for the index in the short term. It was followed by the 60,000 strike (10.21 lakh contracts) and the 61,000 strike (4.76 lakh contracts).
Maximum Call writing was observed at the 61,500 strike (with the addition of 1.4 lakh contracts), followed by the 60,000 strike (1.1 lakh contracts) and 59,700 strike (1.06 lakh contracts). The maximum Call unwinding was seen at the 59,100 strike, which shed 61,560 contracts, followed by the 59,000 and 61,000 strikes which shed 29,010 and 27,990 contracts, respectively.
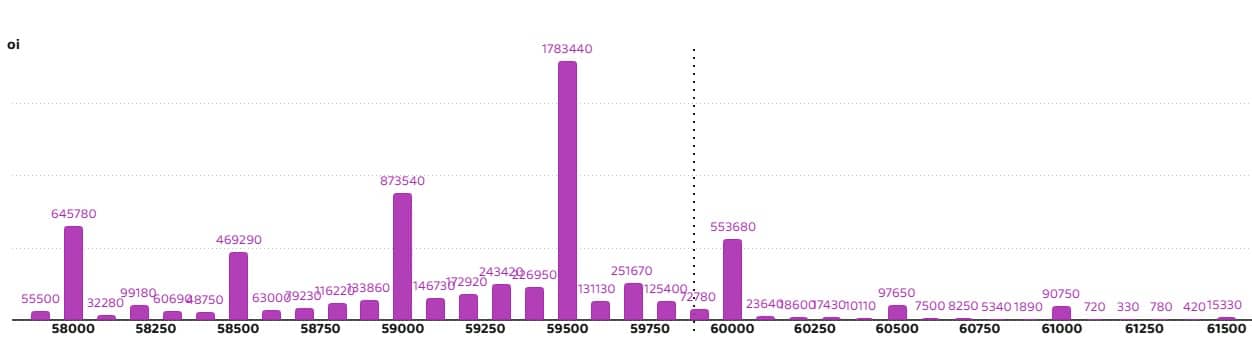
6) Bank Nifty Put Options Data
On the Put side, the maximum Put open interest was seen at the 59,500 strike (with 17.83 lakh contracts), which can act as a key support level for the index. This was followed by the 59,000 strike (8.73 lakh contracts) and the 58,000 strike (6.45 lakh contracts).
The maximum Put writing was placed at the 59,500 strike (which added 2.43 lakh contracts), followed by the 59,400 strike (1.7 lakh contracts) and the 60,000 strike (1.62 lakh contracts). There was hardly any Put unwinding seen in the 58,000-61,500 strike band.
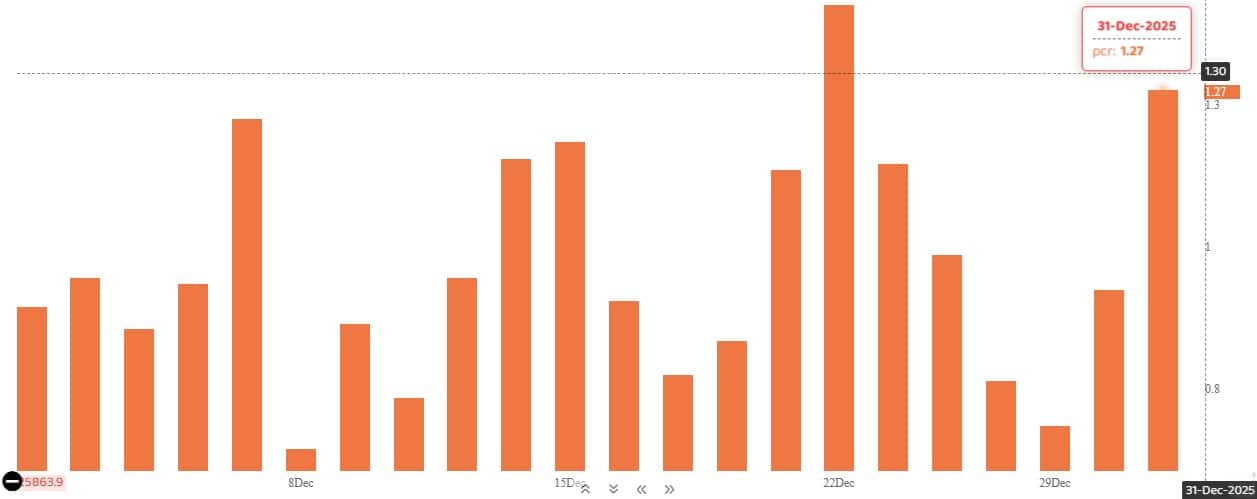
The Nifty Put-Call ratio (PCR), which indicates the mood of the market, climbed to 1.27 on December 31, compared to 0.92 in the previous session.
The increasing PCR, or being higher than 0.7 or surpassing 1, means traders are selling more Put options than Call options, which generally indicates the firming up of a bullish sentiment in the market. If the ratio falls below 0.7 or moves towards 0.5, then it indicates selling in Calls is higher than selling in Puts, reflecting a bearish mood in the market.
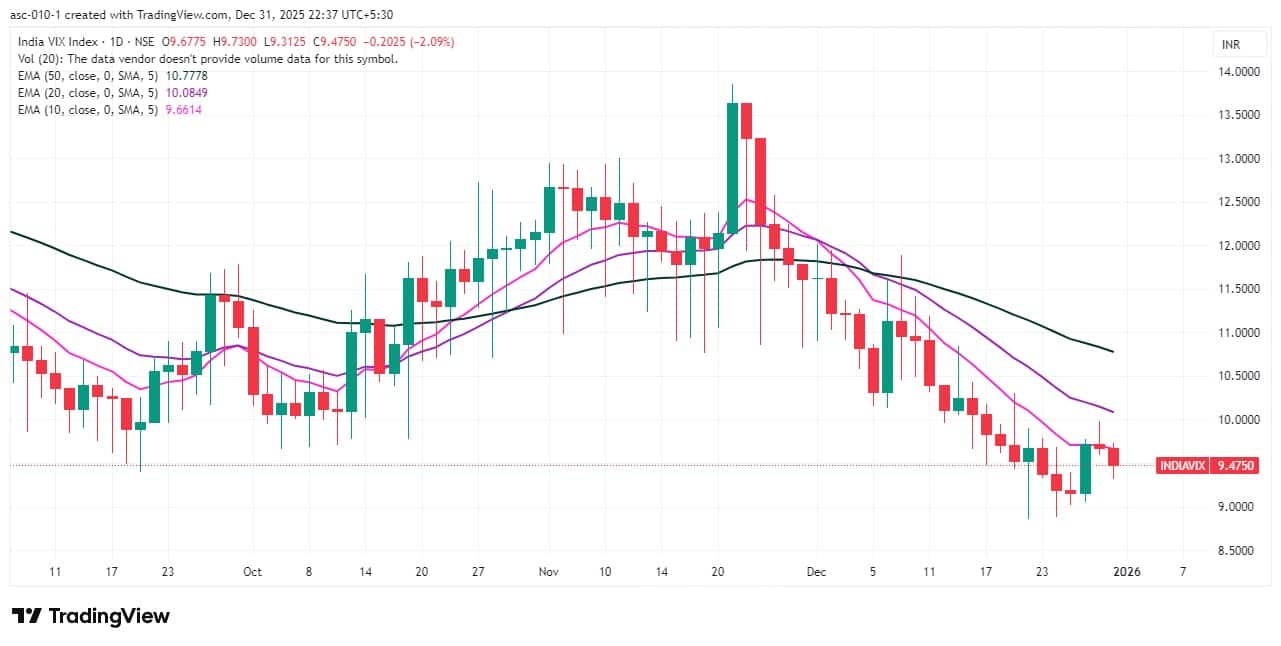
9) India VIX
The India VIX, which measures expected market volatility, sustained below all key moving averages and fell 2.09 percent to 9.47, signalling a comfort zone for bulls, low uncertainty, and rising complacency among traders.
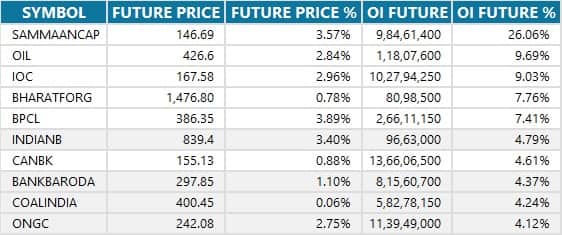
10) Long Build-up (116 Stocks)
A long build-up was seen in 116 stocks. An increase in open interest (OI) and price indicates a build-up of long positions.
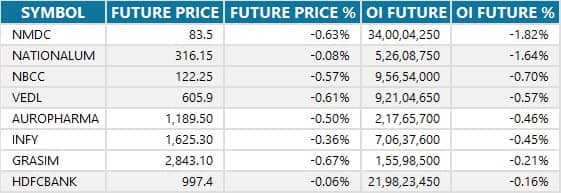
8 stocks saw a decline in open interest (OI) along with a fall in price, indicating long unwinding.
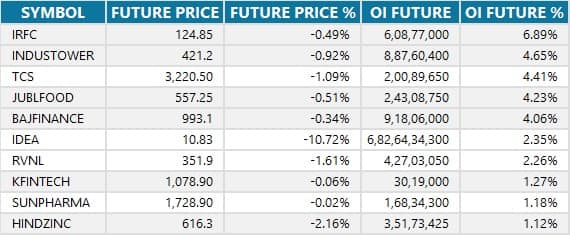
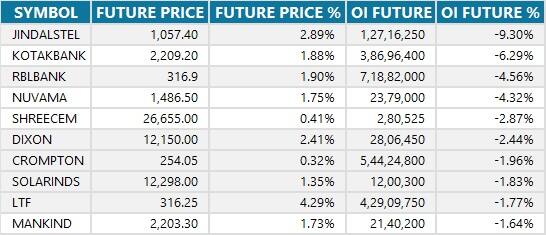
12) Short Build-up (18 Stocks)
18 stocks saw an increase in OI along with a fall in price, indicating a build-up of short positions.
13) Short-Covering (65 Stocks)
65 stocks saw short-covering, meaning a decrease in OI, along with a price increase.
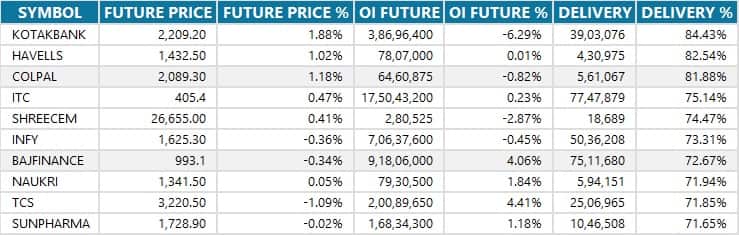
Here are the stocks that saw a high share of delivery trades. A high share of delivery reflects investing (as opposed to trading) interest in a stock.
Securities banned under the F&O segment include companies where derivative contracts cross 95 percent of the market-wide position limit.
Stocks added to F&O ban: Nil
Stocks retained in F&O ban: Nil
Stocks removed from F&O ban: Nil
Disclaimer: The views and investment tips expressed by experts on Moneycontrol are their own and not those of the website or its management. Moneycontrol advises users to check with certified experts before taking any investment decisions.Disclaimer: Moneycontrol is a part of the Network18 group. Network18 is controlled by Independent Media Trust, of which Reliance Industries is the sole beneficiary.Discover the latest Business News, Sensex, and Nifty updates. Obtain Personal Finance insights, tax queries, and expert opinions on Moneycontrol or download the Moneycontrol App to stay updated!
Find the best of Al News in one place, specially curated for you every weekend.
Stay on top of the latest tech trends and biggest startup news.


