


Following a day of sharp US deal-led rally, the Nifty 50 saw consolidation but maintained its northward journey for the third straight session, registering 0.2 percent gains on February 4. Momentum indicators gave a clear buy signal and the VIX dropped further, while the index sustained above all key moving averages as well as above the previous day’s bullish gap. Hence, experts believe the Nifty is likely to move decisively beyond 25,800 and then toward the psychological 26,000 level. Until then, minor consolidation with range-bound trading may be seen, with support placed at 25,650–25,500.
Here are 15 data points we have collated to help you spot profitable trades:
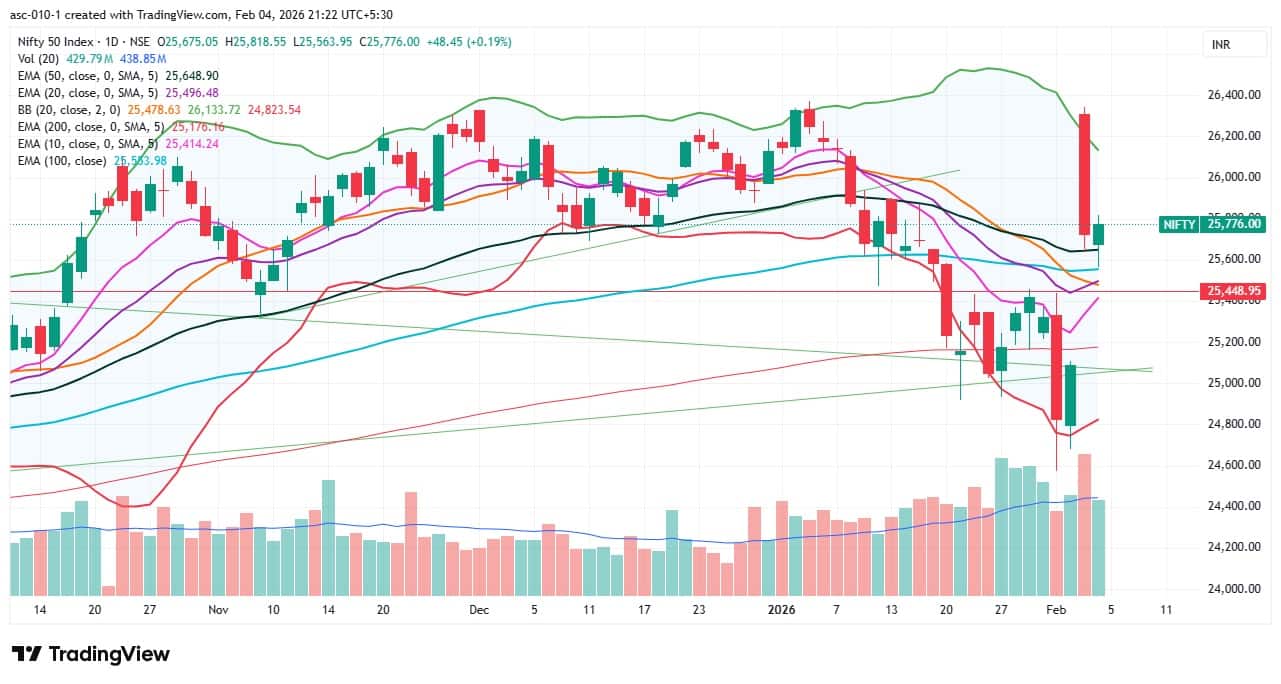
1) Key Levels For The Nifty 50 (25,776)
Resistance based on pivot points: 25,817, 25,877, and 25,974
Support based on pivot points: 25,622, 25,562, and 25,465
Special Formation: The Nifty 50 formed a bullish candle with a lower shadow on the daily charts, signalling a breather-type pattern after the massive rally in the previous session. The index not only sustained above all key moving averages, but the short- and medium-term moving averages also trended upward. The index is already in momentum after surpassing the midline of the Bollinger Bands, while the RSI rose to 54.61 and the Stochastic RSI climbed toward the upper band. The MACD maintained a bullish crossover (though below the zero line) with a further rise in the histogram. All this indicates strengthening bullish momentum.
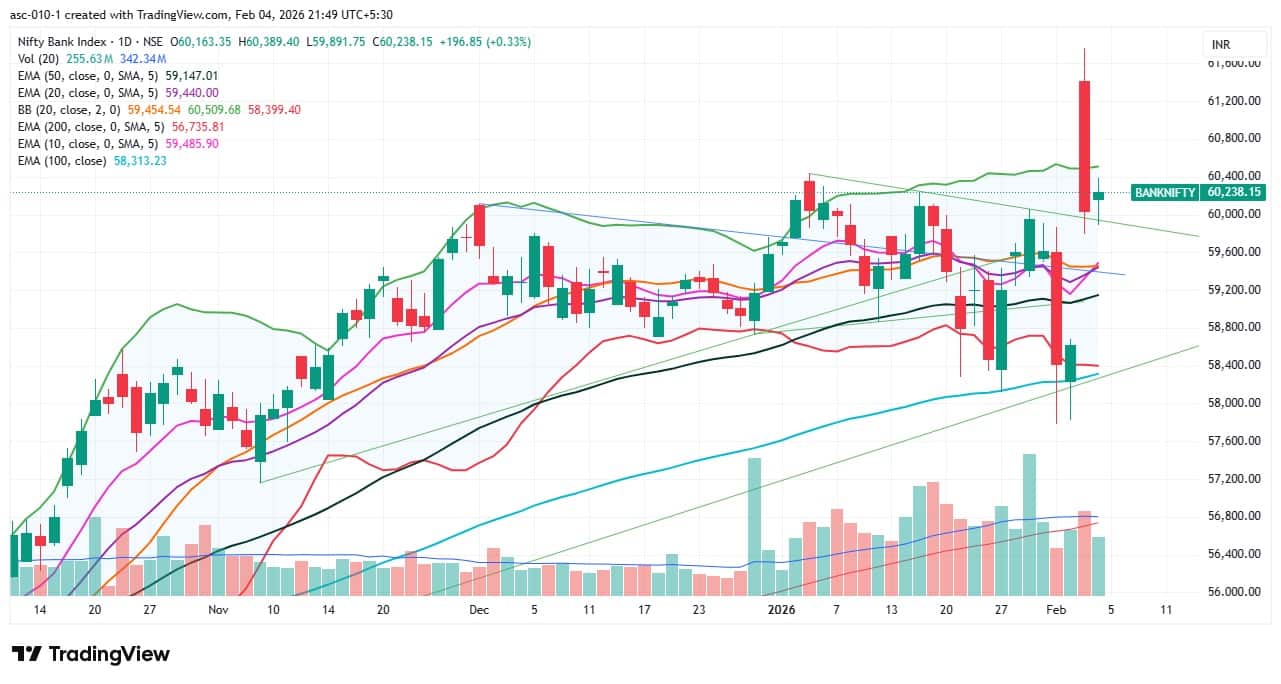
2) Key Levels For The Bank Nifty (60,238)
Resistance based on pivot points: 60,363, 60,481, and 60,671
Support based on pivot points: 59,983, 59,866, and 59,676
Resistance based on Fibonacci retracement: 60,437, 61,159
Support based on Fibonacci retracement: 59,461, 58,917
Special Formation: The Bank Nifty reported a small bullish candle with upper and lower shadows on the daily charts while trading within the previous day’s large candle, indicating consolidation. The index held above the falling support trendline and all key moving averages, with short-term moving averages trending northward. The RSI climbed to 57.22 and the Stochastic RSI turned bullish. The MACD showed a positive crossover above the zero line with an increase in the histogram. All this indicates continuation of the positive bias.
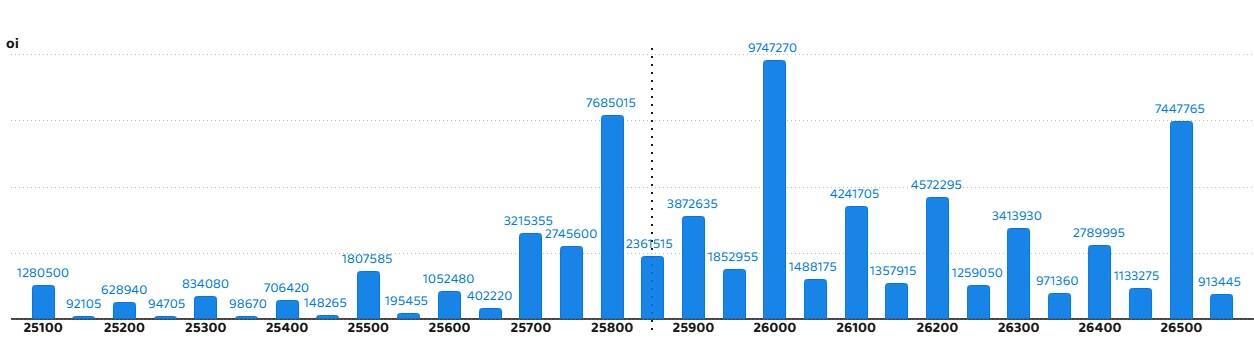
According to the weekly options data, the maximum Call open interest was seen at the 26,000 strike (with 97.47 lakh contracts). This level can act as a key resistance level for the Nifty in the short term. It was followed by the 25,800 strike (76.85 lakh contracts) and 26,500 strike (74.47 lakh contracts).
Maximum Call writing was observed at the 25,800 strike, which saw an addition of 24.28 lakh contracts, followed by the 26,100 and 26,000 strikes, which added 20.94 lakh and 19.54 lakh contracts, respectively. The maximum Call unwinding was seen at the 25,500 strike which shed 3.44 lakh contracts, followed by the 25,100 and 26,250 strikes, which shed 1.28 lakh and 1.1 lakh contracts, respectively.
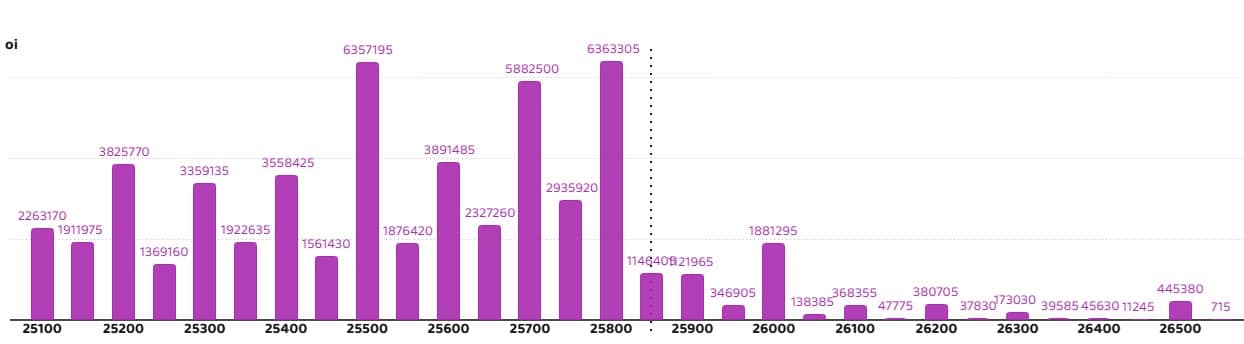
On the Put side, the 25,800 strike holds the maximum Put open interest (with 63.63 lakh contracts), which can act as a key level for the Nifty in the short term. It was followed by the 25,500 strike (63.57 lakh contracts) and the 25,700 strike (58.82 lakh contracts).
The maximum Put writing was placed at the 25,700 strike, which saw an addition of 27.63 lakh contracts, followed by the 25,800 and 25,500 strikes, which added 26.6 lakh and 23.95 lakh contracts, respectively. The maximum Put unwinding was seen at the 26,200 strike, which shed 95,225 contracts, followed by the 26,500 and 26,300 strikes, which shed 80,080 and 6,045 contracts, respectively.
5) Bank Nifty Call Options Data
According to the monthly options data, the maximum Call open interest was seen at the 60,000 strike, with 15.55 lakh contracts. This can act as a key level for the index in the short term. It was followed by the 61,000 strike (6.2 lakh contracts) and the 62,000 strike (5.78 lakh contracts).
Maximum Call writing was observed at the 60,500 strike (with the addition of 1.01 lakh contracts), followed by the 60,400 strike (91,950 contracts) and 62,000 strike (63,150 contracts). The maximum Call unwinding was seen at the 59,400 strike, which shed 31,620 contracts, followed by the 60,000 and 60,100 strikes which shed 28,020 and 18,810 contracts, respectively.
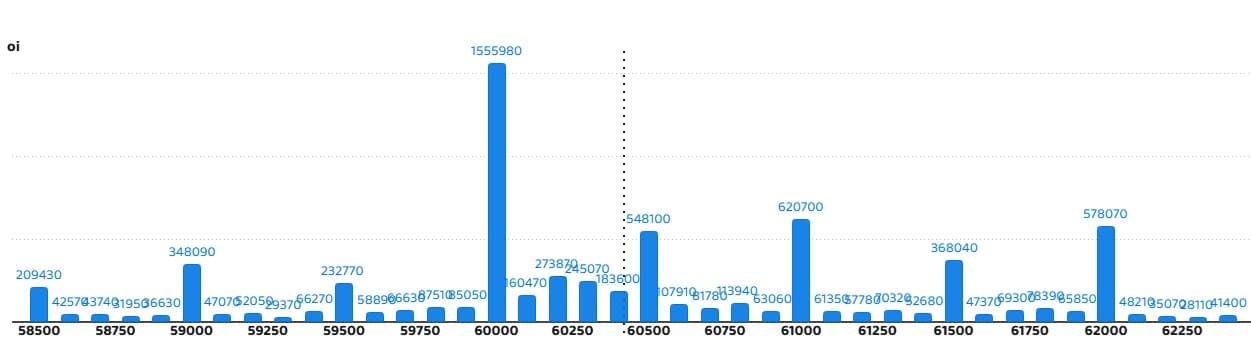
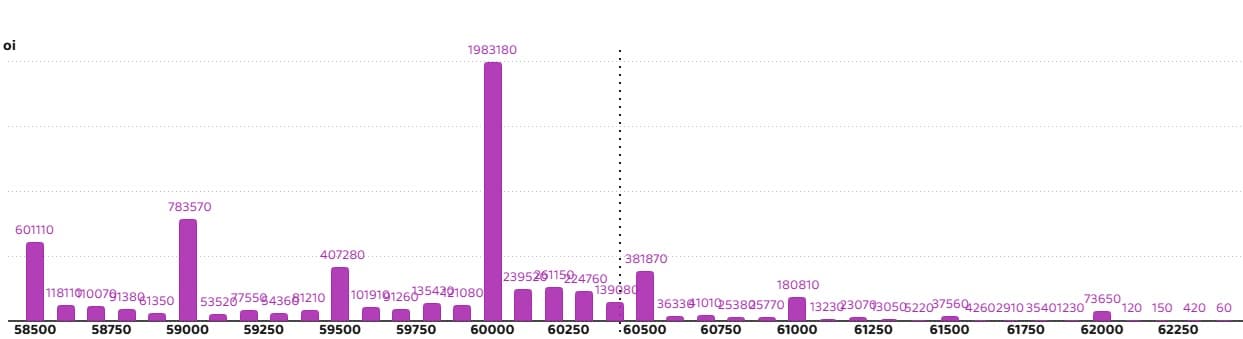
6) Bank Nifty Put Options Data
On the Put side, the 60,000 strike holds the maximum Put open interest (with 19.83 lakh contracts), which can act as a key support level for the index. This was followed by the 59,000 strike (7.83 lakh contracts) and the 58,500 strike (6.01 lakh contracts).
The maximum Put writing was placed at the 59,000 strike (which added 1.8 lakh contracts), followed by the 60,500 strike (1.62 lakh contracts) and the 60,000 strike (1.58 lakh contracts). There was hardly any Put unwinding seen in the 58,500-62,250 strike band.
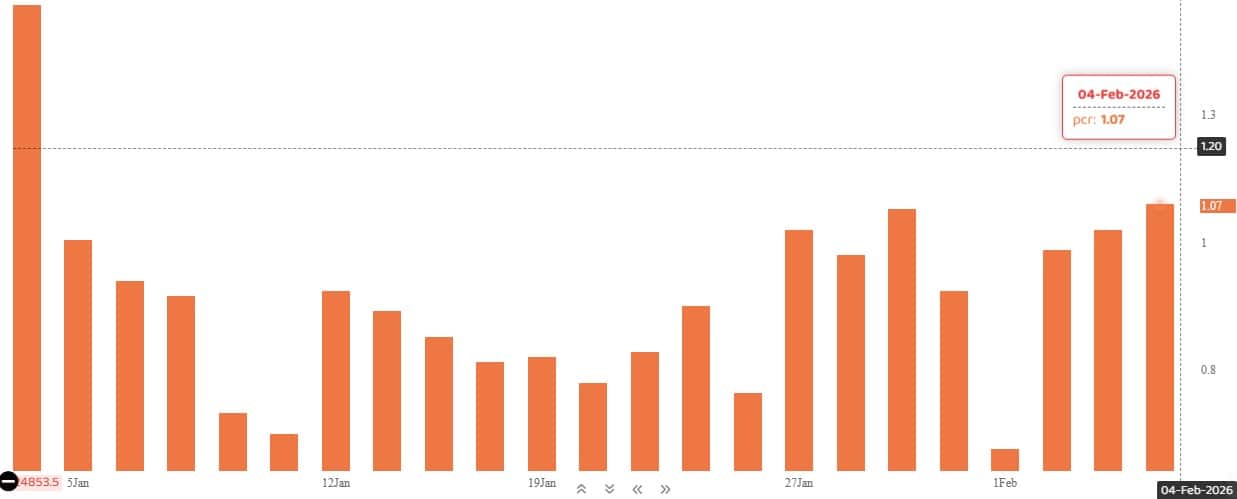
The Nifty Put-Call ratio (PCR), which indicates the mood of the market, jumped to 1.07 on February 4, compared to 1.02 in the previous session.
The increasing PCR, or being higher than 0.7 or surpassing 1, means traders are selling more Put options than Call options, which generally indicates the firming up of a bullish sentiment in the market. If the ratio falls below 0.7 or moves towards 0.5, then it indicates selling in Calls is higher than selling in Puts, reflecting a bearish mood in the market.
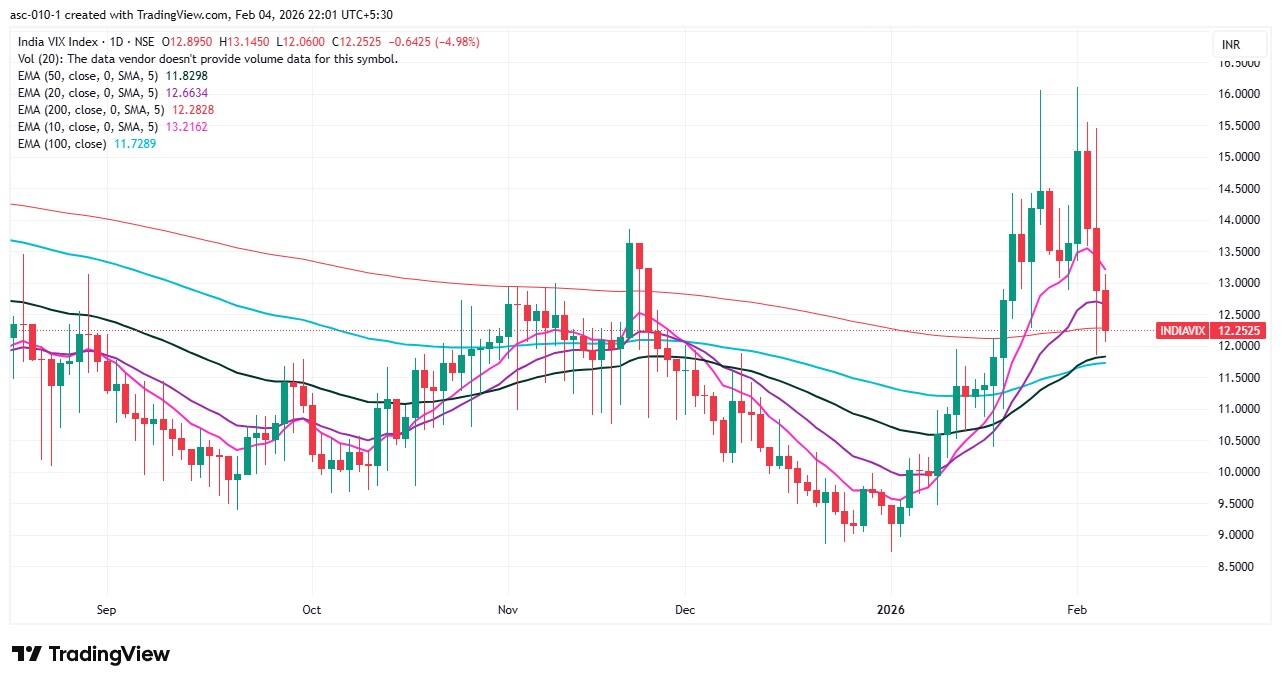
9) India VIX
The India VIX, also known as the fear gauge, fell 4.98 percent to 12.25, extending its downtrend since the start of the week, which provided comfort to bulls and further reduced uncertainty.
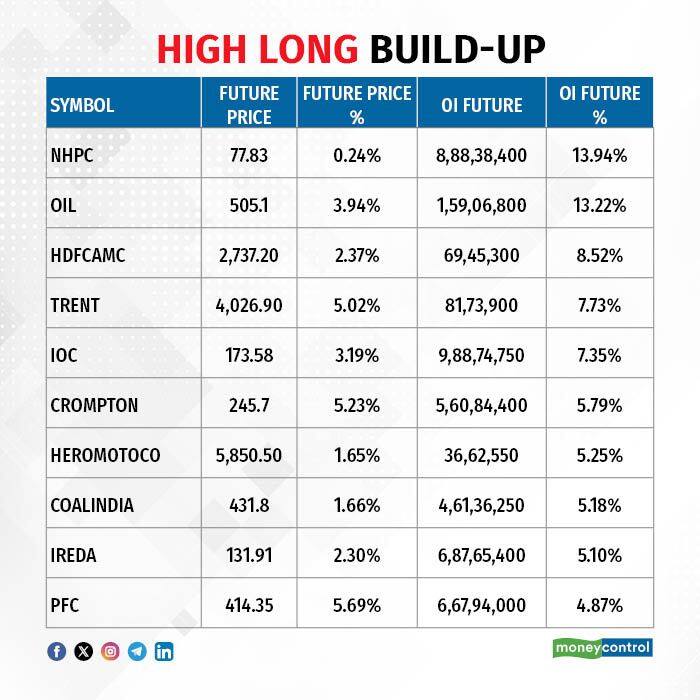
A long build-up was seen in 76 stocks. An increase in open interest (OI) and price indicates a build-up of long positions.
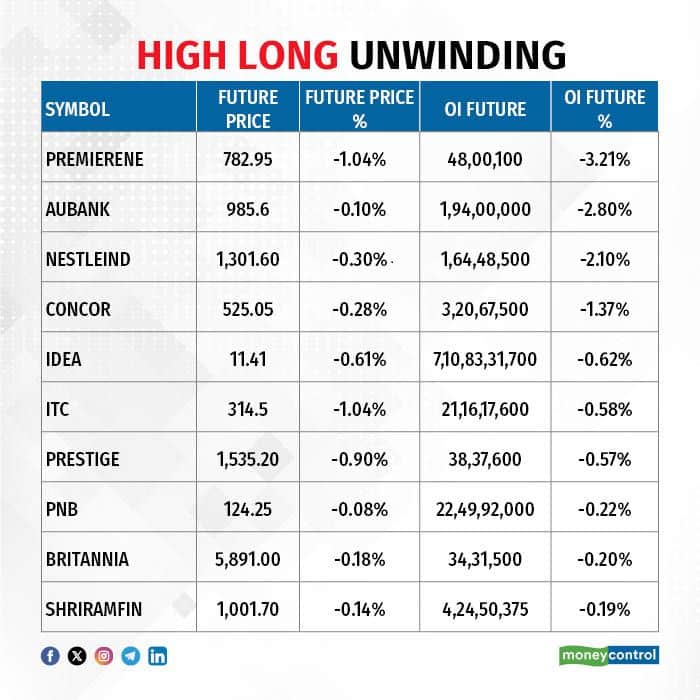
11) Long Unwinding (12 Stocks)
12 stocks saw a decline in open interest (OI) along with a fall in price, indicating long unwinding.
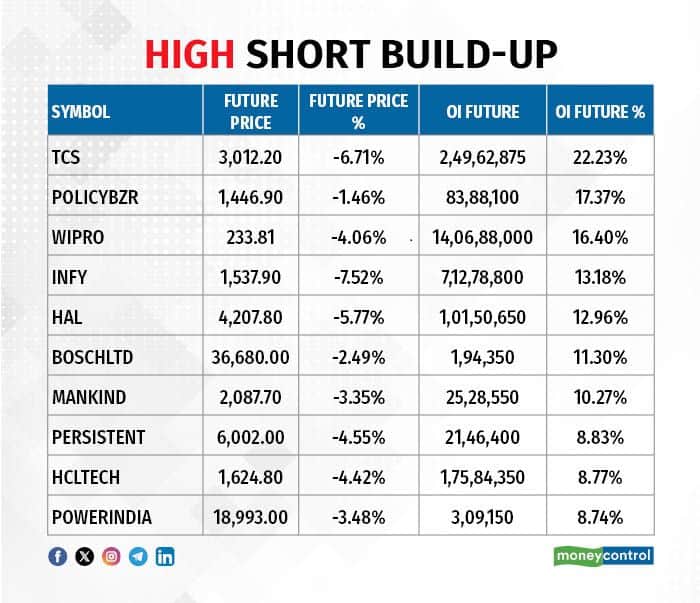
12) Short Build-up (41 Stocks)
41 stocks saw an increase in OI along with a fall in price, indicating a build-up of short positions.
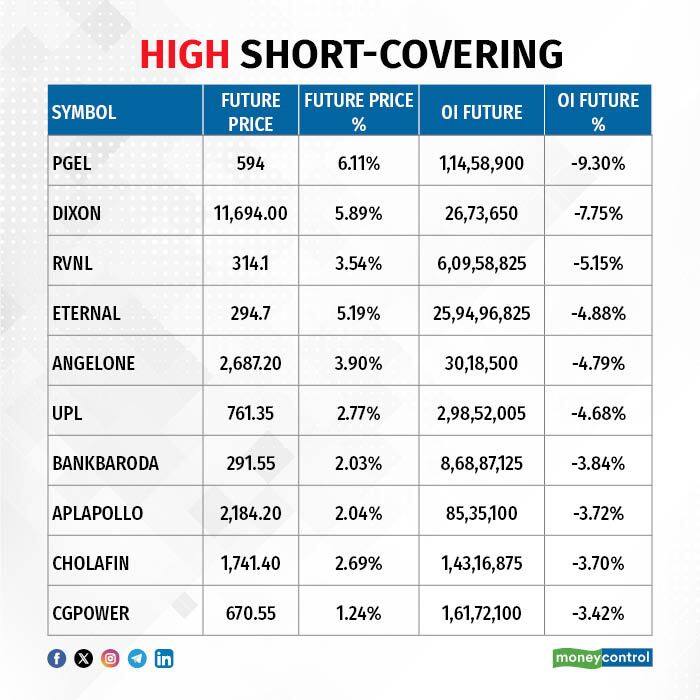
13) Short-Covering (82 Stocks)
82 stocks saw short-covering, meaning a decrease in OI, along with a price increase.
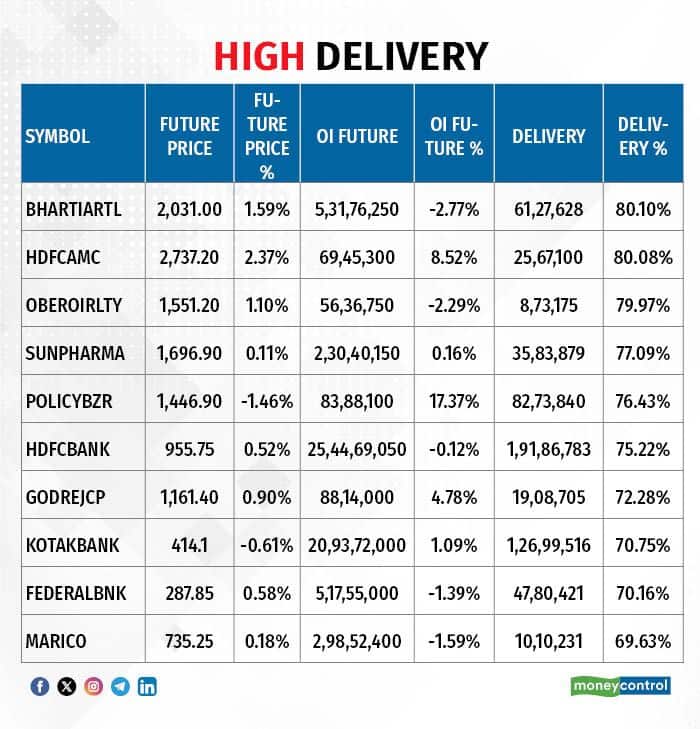
Here are the stocks that saw a high share of delivery trades. A high share of delivery reflects investing (as opposed to trading) interest in a stock.
Securities banned under the F&O segment include companies where derivative contracts cross 95 percent of the market-wide position limit.
Stocks added to F&O ban: Nil
Stocks retained in F&O ban: Sammaan Capital
Stocks removed from F&O ban: Nil
Disclaimer: The views and investment tips expressed by experts on Moneycontrol are their own and not those of the website or its management. Moneycontrol advises users to check with certified experts before taking any investment decisions.Disclaimer: Moneycontrol is a part of the Network18 group. Network18 is controlled by Independent Media Trust, of which Reliance Industries is the sole beneficiary.Discover the latest Business News, Sensex, and Nifty updates. Obtain Personal Finance insights, tax queries, and expert opinions on Moneycontrol or download the Moneycontrol App to stay updated!
Find the best of Al News in one place, specially curated for you every weekend.
Stay on top of the latest tech trends and biggest startup news.


