


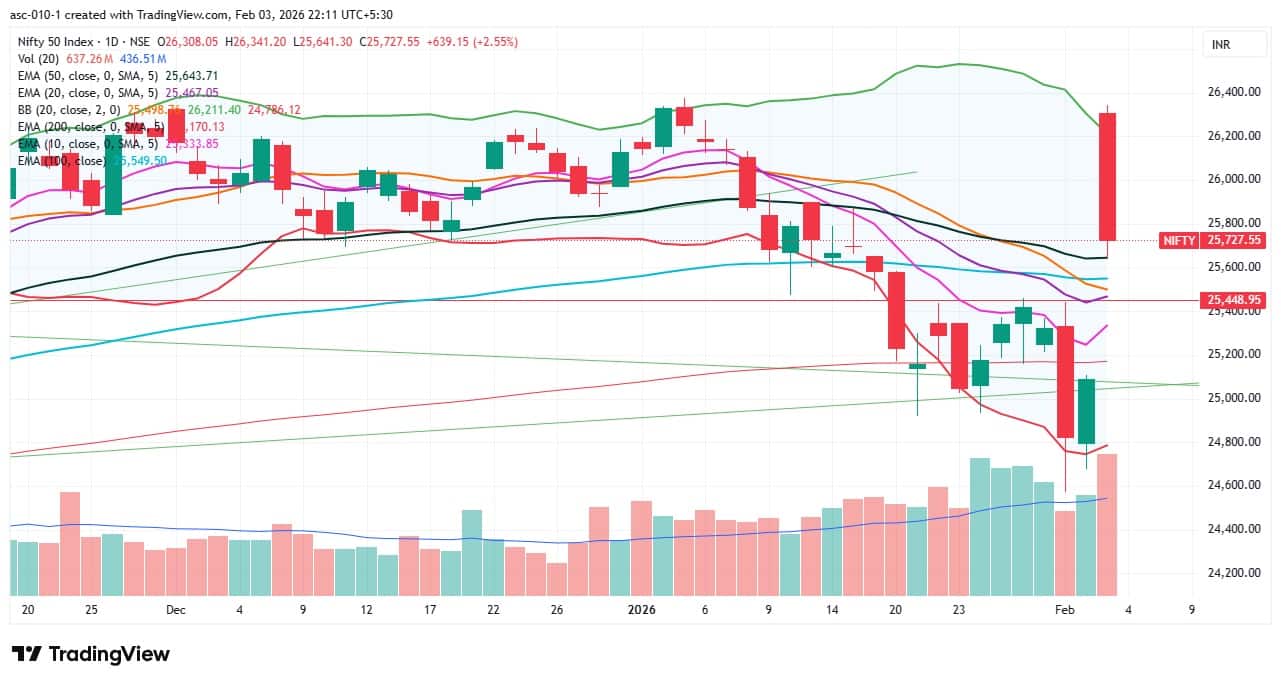
The Nifty 50 on February 3 recorded the biggest single-day rally of 2.5 percent in nearly nine months after the India–US trade deal removed a major sentiment overhang that had weighed on investor confidence for more than a year. Bulls returned in full force, supported by improving momentum indicators and a cooling VIX after a sharp gap-up opening. Hence, the overall trend remains positive, but after this stellar run, consolidation with support in the 25,600–25,500 zone cannot be ruled out. On the upside, 26,000 is likely to act as an immediate resistance, followed by the record high of 26,373 as a key resistance, experts said.
Here are 15 data points we have collated to help you spot profitable trades:
1) Key Levels For The Nifty 50 (25,728)
Resistance based on pivot points: 26,171, 26,336, and 26,603
Support based on pivot points: 25,636, 25,471, and 25,203
Special Formation: The Nifty 50 formed a big red candle on the daily charts after a gap-up opening, but the gap between 25,108 and 25,641 remained unfilled on a closing basis, signalling a healthy trend. The index climbed above all key moving averages, with short-term moving averages trending upward. The RSI rose to 53.72, and the Stochastic RSI turned positive, while the MACD also showed a bullish crossover with a green histogram bar. All these indicators suggest strengthening momentum despite some profit-taking.
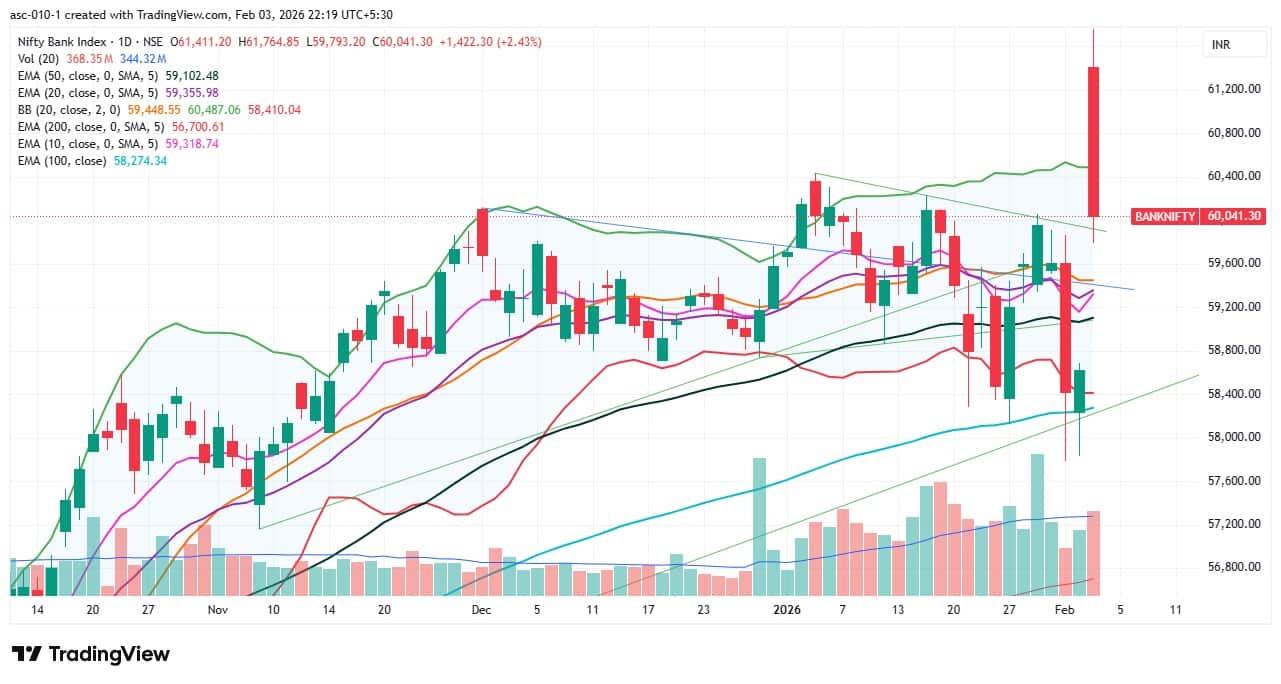
2) Key Levels For The Bank Nifty (60,041)
Resistance based on pivot points: 61,286, 61,752, and 62,505
Support based on pivot points: 59,780, 59,315, and 58,561
Resistance based on Fibonacci retracement: 60,437, 61,159
Support based on Fibonacci retracement: 59,461, 58,917
Special Formation: The Bank Nifty also formed a long bearish candle after a strong opening, but the gap between 58,687 and 59,793 remained unfilled at the close. The index sustained above the falling support trendline (which previously acted as resistance) and also held well above all key moving averages, with short-term moving averages starting to trend upward. The RSI rose to 55.82, while the MACD inclined upward, though it remained below the reference and zero lines. The weakness in the histogram also faded. All these signals indicate improving underlying strength in the banking index.
According to the weekly options data, the 26,000 strike holds the maximum Call open interest (with 77.92 lakh contracts). This level can act as a key resistance level for the Nifty in the short term. It was followed by the 26,500 strike (59.21 lakh contracts) and 25,800 strike (52.56 lakh contracts).
Maximum Call writing was observed at the 26,000 strike, which saw an addition of 41.15 lakh contracts, followed by the 25,800 and 26,500 strikes, which added 36.87 lakh and 36.25 lakh contracts, respectively. The maximum Call unwinding was seen at the 25,400 strike which shed 8.79 lakh contracts, followed by the 25,300 and 25,200 strikes, which shed 8.41 lakh and 6.14 lakh contracts, respectively.
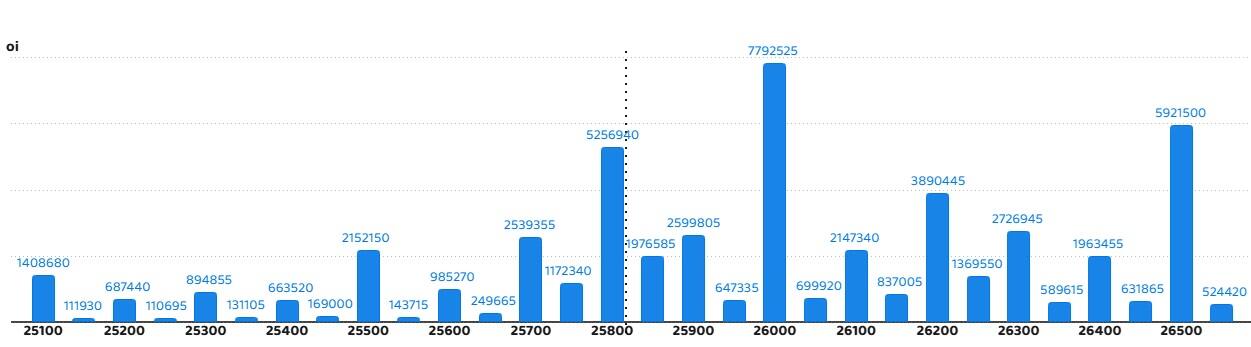
On the Put side, the maximum Put open interest was seen at the 25,500 strike (with 39.61 lakh contracts), which can act as a key support level for the Nifty in the short term. It was followed by the 25,800 strike (37.03 lakh contracts) and the 25,700 strike (31.19 lakh contracts).
The maximum Put writing was placed at the 25,800 strike, which saw an addition of 35.9 lakh contracts, followed by the 25,500 and 25,700 strikes, which added 33.03 lakh and 29.78 lakh contracts, respectively. There was hardly any Put unwinding seen in the 25,100-26,500 strike band.
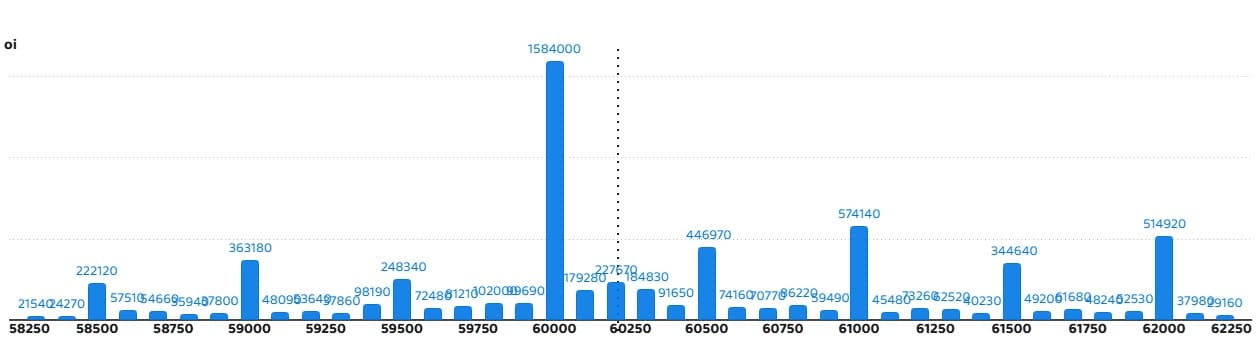
5) Bank Nifty Call Options Data
According to the monthly options data, the 60,000 strike holds the maximum Call open interest, with 15.84 lakh contracts. This can act as a key level for the index in the short term. It was followed by the 61,000 strike (5.74 lakh contracts) and the 62,000 strike (5.14 lakh contracts).
Maximum Call writing was observed at the 60,200 strike (with the addition of 1.17 lakh contracts), followed by the 60,300 strike (1 lakh contracts) and 60,100 strike (79,830 contracts). The maximum Call unwinding was seen at the 60,000 strike, which shed 3.03 lakh contracts, followed by the 59,000 and 58,500 strikes which shed 2.47 lakh and 1.64 lakh contracts, respectively.
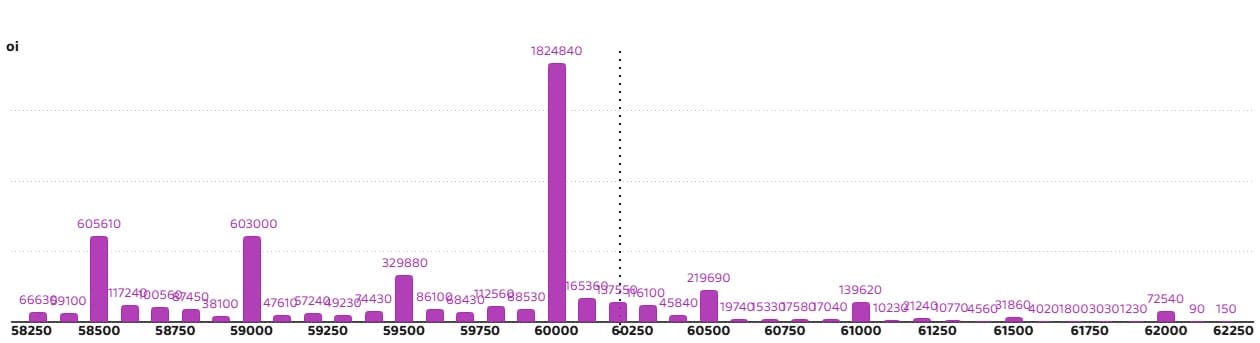
6) Bank Nifty Put Options Data
On the Put side, the maximum Put open interest was seen at the 60,000 strike (with 18.24 lakh contracts), which can act as a key level for the index. This was followed by the 58,500 strike (6.05 lakh contracts) and the 59,000 strike (6.03 lakh contracts).
The maximum Put writing was placed at the 60,000 strike (which added 3.93 lakh contracts), followed by the 60,100 strike (1.13 lakh contracts) and the 60,500 strike (1.04 lakh contracts). The maximum Put unwinding was seen at the 58,500 strike, which shed 32,850 contracts, followed by the 58,300 and 58,400 strikes, which shed 29,190 and 26,070 contracts, respectively.
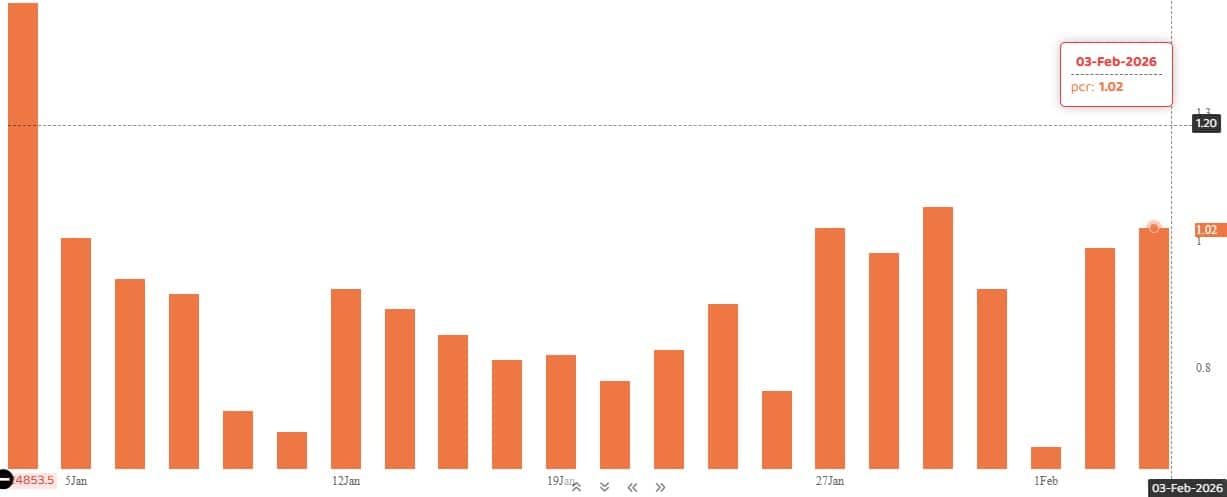
The Nifty Put-Call ratio (PCR), which indicates the mood of the market, rose to 1.02 on February 3, compared to 0.98 in the previous session.
The increasing PCR, or being higher than 0.7 or surpassing 1, means traders are selling more Put options than Call options, which generally indicates the firming up of a bullish sentiment in the market. If the ratio falls below 0.7 or moves towards 0.5, then it indicates selling in Calls is higher than selling in Puts, reflecting a bearish mood in the market.
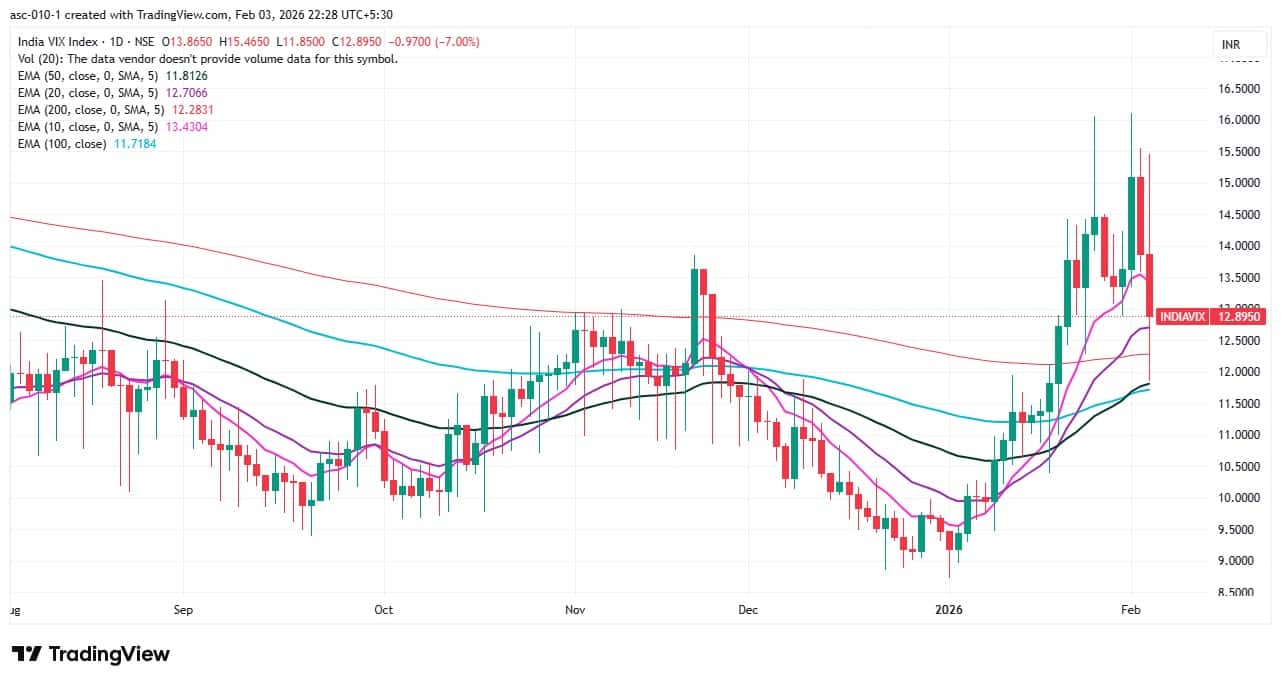
9) India VIX
The India VIX, which measures expected market volatility, corrected sharply for another session, falling 7 percent to 12.9. This provided further comfort for bulls; however, the VIX needs to decline further toward the 11 zone to make the market more confident.
A long build-up was seen in 98 stocks. An increase in open interest (OI) and price indicates a build-up of long positions.
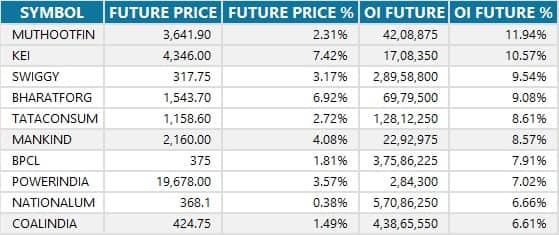
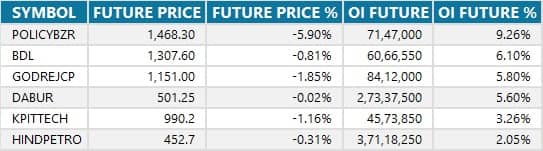
4 stocks saw a decline in open interest (OI) along with a fall in price, indicating long unwinding.
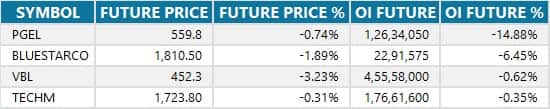
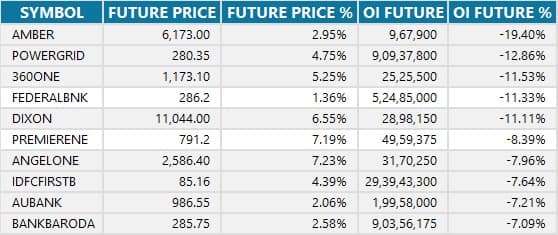
6 stocks saw an increase in OI along with a fall in price, indicating a build-up of short positions.
13) Short-Covering (104 Stocks)
104 stocks saw short-covering, meaning a decrease in OI, along with a price increase.
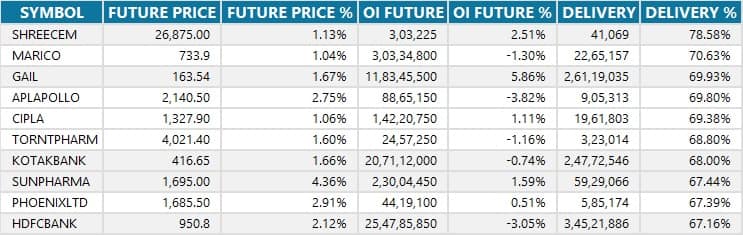
Here are the stocks that saw a high share of delivery trades. A high share of delivery reflects investing (as opposed to trading) interest in a stock.
Securities banned under the F&O segment include companies where derivative contracts cross 95 percent of the market-wide position limit.
Stocks added to F&O ban: Nil
Stocks retained in F&O ban: Sammaan Capital
Stocks removed from F&O ban: Nil
Disclaimer: The views and investment tips expressed by experts on Moneycontrol are their own and not those of the website or its management. Moneycontrol advises users to check with certified experts before taking any investment decisions.Disclaimer: Moneycontrol is a part of the Network18 group. Network18 is controlled by Independent Media Trust, of which Reliance Industries is the sole beneficiary.Discover the latest Business News, Sensex, and Nifty updates. Obtain Personal Finance insights, tax queries, and expert opinions on Moneycontrol or download the Moneycontrol App to stay updated!
Find the best of Al News in one place, specially curated for you every weekend.
Stay on top of the latest tech trends and biggest startup news.


