


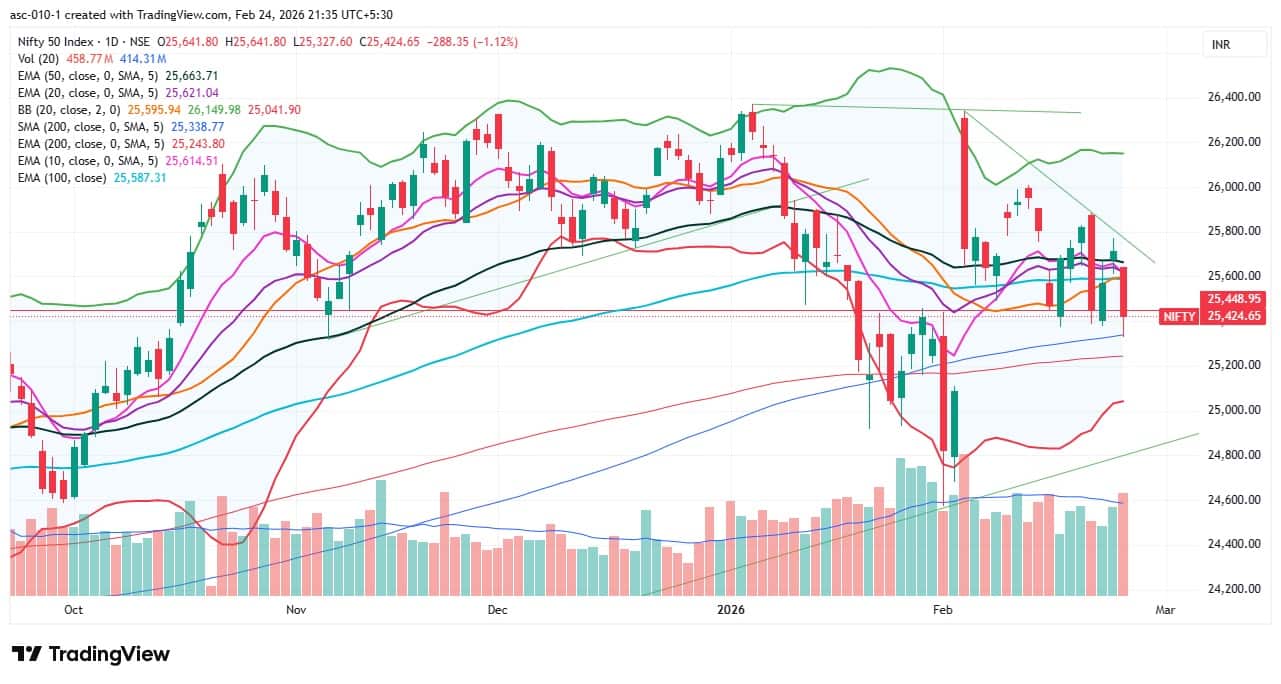
The benchmark Nifty 50 wiped out all its previous two-day gains and closed 1.1 percent lower on February 24, falling decisively below all key moving averages (except the 200-day EMA) in a single session. The momentum indicators also showed a sell signal. However, the index defended the 25,400 level on a closing basis in every decline since last week. Given the sharp sell-off, the index may attempt a bounce-back, facing resistance at the 25,500–25,600 levels, as sustaining above this zone alone can push the index toward 26,000. However, in the event of further consolidation, the 25,300–25,200 range is expected to act as an immediate support zone, according to experts.
Here are 15 data points we have collated to help you spot profitable trades:
1) Key Levels For The Nifty 50 (25,425)
Resistance based on pivot points: 25,585, 25,659, and 25,779
Support based on pivot points: 25,345, 25,271, and 25,151
Special Formation: The Nifty 50 formed a long red candle with a lower shadow on the daily timeframe and fell decisively below the 20-, 50-, and 100-day EMAs in a single session, signaling a bearish mood despite buying interest at lower levels. The momentum indicators also showed a sell signal, with the RSI sustaining below the signal line and falling to 45.39. The MACD registered a bearish crossover below the zero line, while the histogram fell below the zero line for the first time since February 2. All this indicates strengthening bearish momentum.
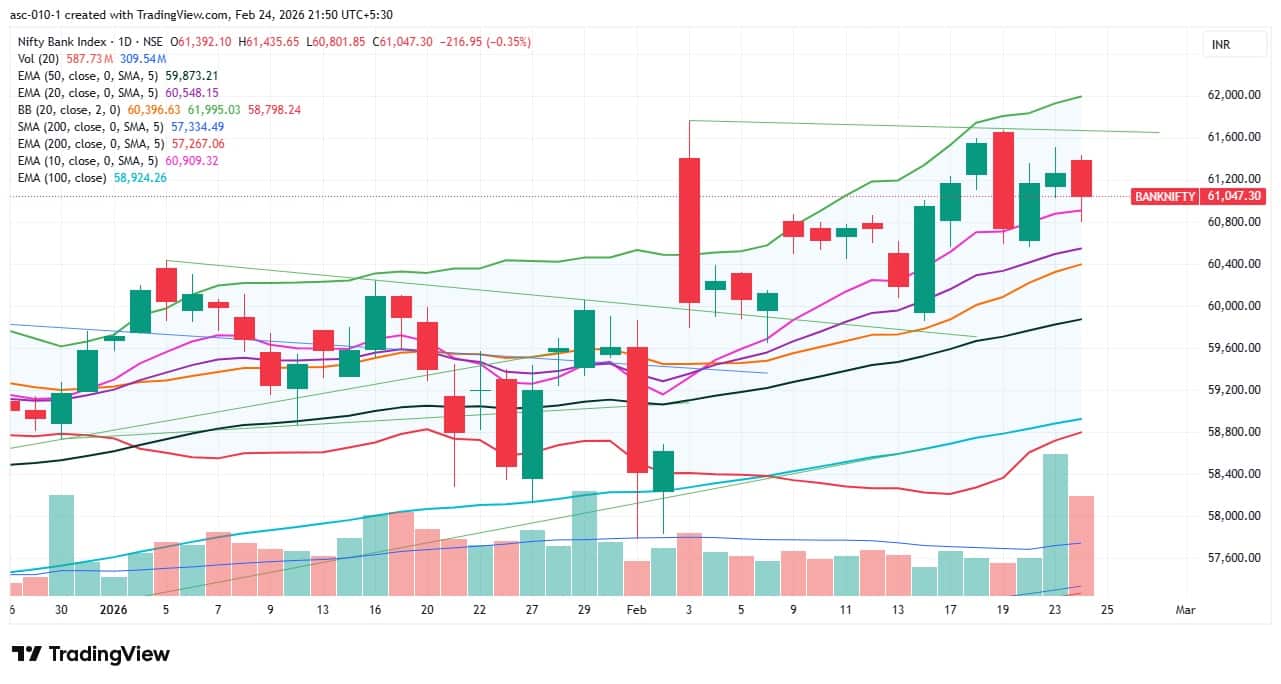
2) Key Levels For The Bank Nifty (61,047)
Resistance based on pivot points: 61,337, 61,487, and 61,729
Support based on pivot points: 60,853, 60,703, and 60,461
Resistance based on Fibonacci retracement: 62,064, 64,707
Support based on Fibonacci retracement: 60,819, 60,240
Special Formation: The Bank Nifty formed a bearish candle with a lower shadow on the daily charts, indicating weakness along with buying interest at lower levels. However, the banking index climbed back above the 10-day EMA on a closing basis and sustained above all key moving averages. In fact, the moving averages trended northward. The RSI remained in a consolidation phase, though it fell below the signal line to 57.14. The MACD remained above the reference line, while the histogram showed further fading momentum but stayed above the zero line. All this indicates underlying strength despite short-term weakness.
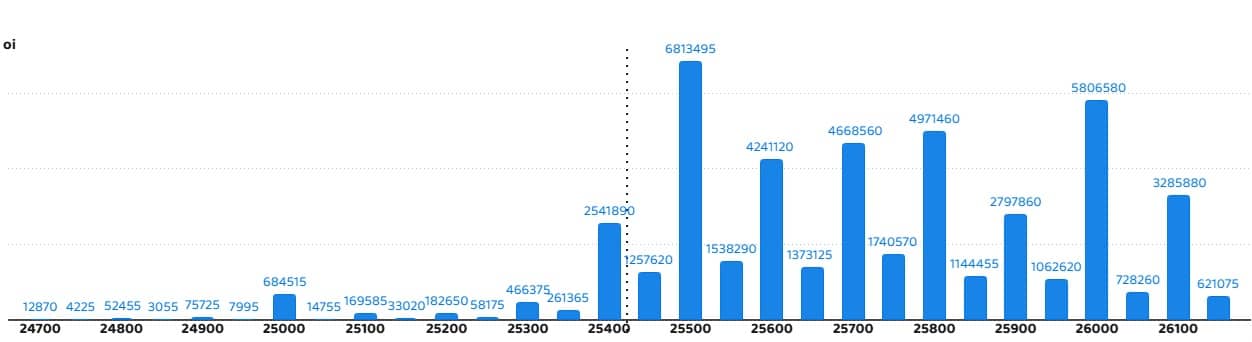
According to the weekly options data, the maximum Call open interest was seen at the 25,500 strike (with 68.13 lakh contracts). This level can act as a key resistance level for the Nifty in the short term. It was followed by the 26,000 strike (58.06 lakh contracts) and 25,800 strike (49.71 lakh contracts).
Maximum Call writing was observed at the 25,500 strike, which saw an addition of 57.26 lakh contracts, followed by the 26,000 and 25,600 strikes, which added 34.38 lakh and 32.98 lakh contracts, respectively. There was hardly any Call unwinding seen in the 24,700-26,100 strike band.
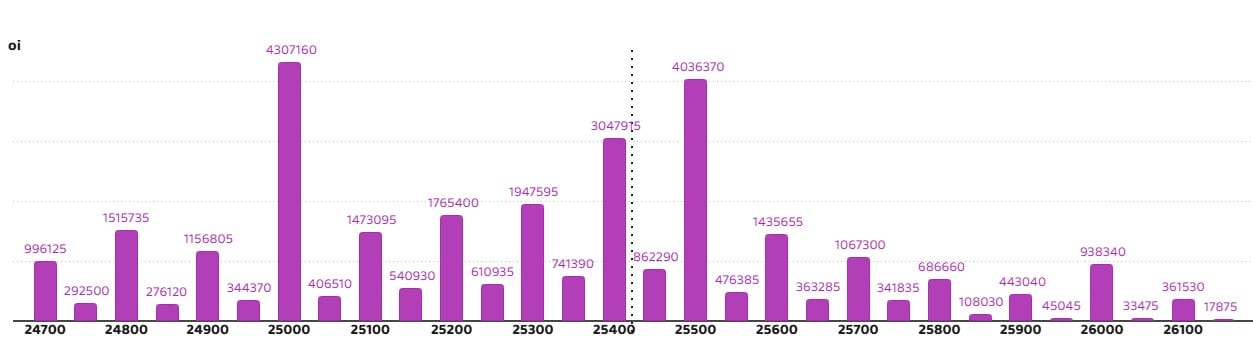
On the Put side, the 25,000 strike holds the maximum Put open interest (with 43.07 lakh contracts), which can act as a key support level for the Nifty in the short term. It was followed by the 25,500 strike (40.36 lakh contracts) and the 25,400 strike (30.47 lakh contracts).
The maximum Put writing was placed at the 25,000 strike, which saw an addition of 19.58 lakh contracts, followed by the 25,500 and 25,400 strikes, which added 15.74 lakh and 13.87 lakh contracts, respectively. The maximum Put unwinding was seen at the 25,700 strike, which shed 6.03 lakh contracts, followed by the 25,800 and 25,750 strikes, which shed 2.59 lakh and 1.8 lakh contracts, respectively.
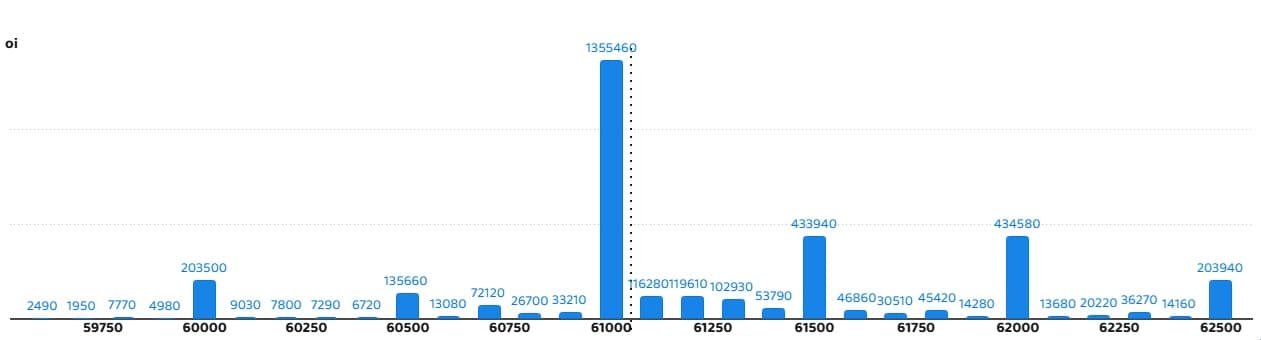
5) Bank Nifty Call Options Data
According to the monthly options data, the maximum Call open interest was seen at the 61,000 strike, with 13.55 lakh contracts. This can act as a key level for the index in the short term. It was followed by the 62,000 strike (4.34 lakh contracts) and the 61,500 strike (4.33 lakh contracts).
Maximum Call writing was observed at the 61,000 strike (with the addition of 1.69 lakh contracts), followed by the 61,500 strike (1.48 lakh contracts) and 62,000 strike (54,600 contracts). The maximum Call unwinding was seen at the 60,300 strike, which shed 1,740 contracts, followed by the 59,900 and 60,200 strikes which shed 930 and 630 contracts, respectively.
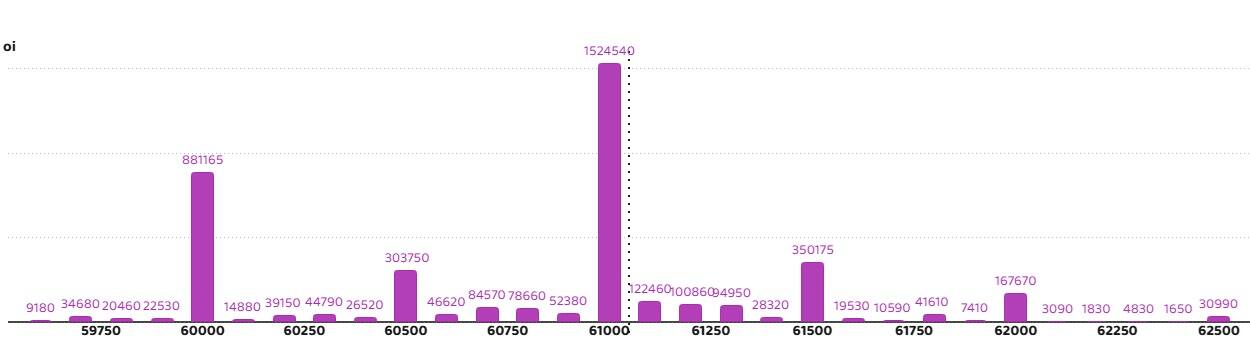
6) Bank Nifty Put Options Data
On the Put side, the 61,000 strike holds the maximum Put open interest (with 15.24 lakh contracts), which can act as a key level for the index. This was followed by the 60,000 strike (8.81 lakh contracts) and the 61,500 strike (3.5 lakh contracts).
The maximum Put writing was placed at the 61,000 strike (which added 1.35 lakh contracts), followed by the 60,000 strike (1.2 lakh contracts) and the 61,500 strike (1.03 lakh contracts). The maximum Put unwinding was seen at the 60,700 strike, which shed 1,230 contracts, followed by the 62,200 strike, which shed 630 contracts.
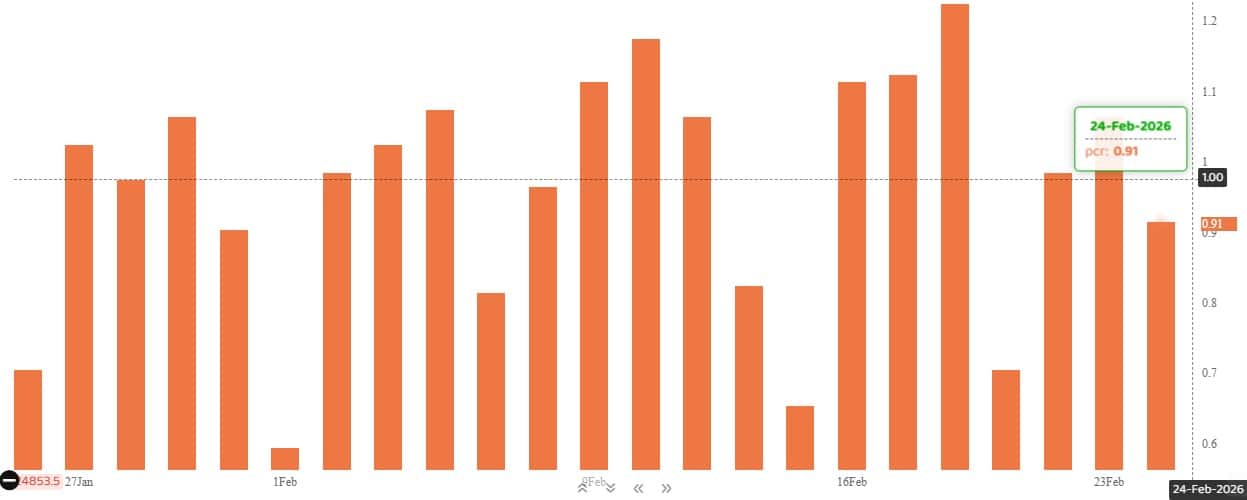
The Nifty Put-Call ratio (PCR), which indicates the mood of the market, dropped to 0.91 on February 24, compared to 1.06 in the previous session.
The increasing PCR, or being higher than 0.7 or surpassing 1, means traders are selling more Put options than Call options, which generally indicates the firming up of a bullish sentiment in the market. If the ratio falls below 0.7 or moves towards 0.5, then it indicates selling in Calls is higher than selling in Puts, reflecting a bearish mood in the market.
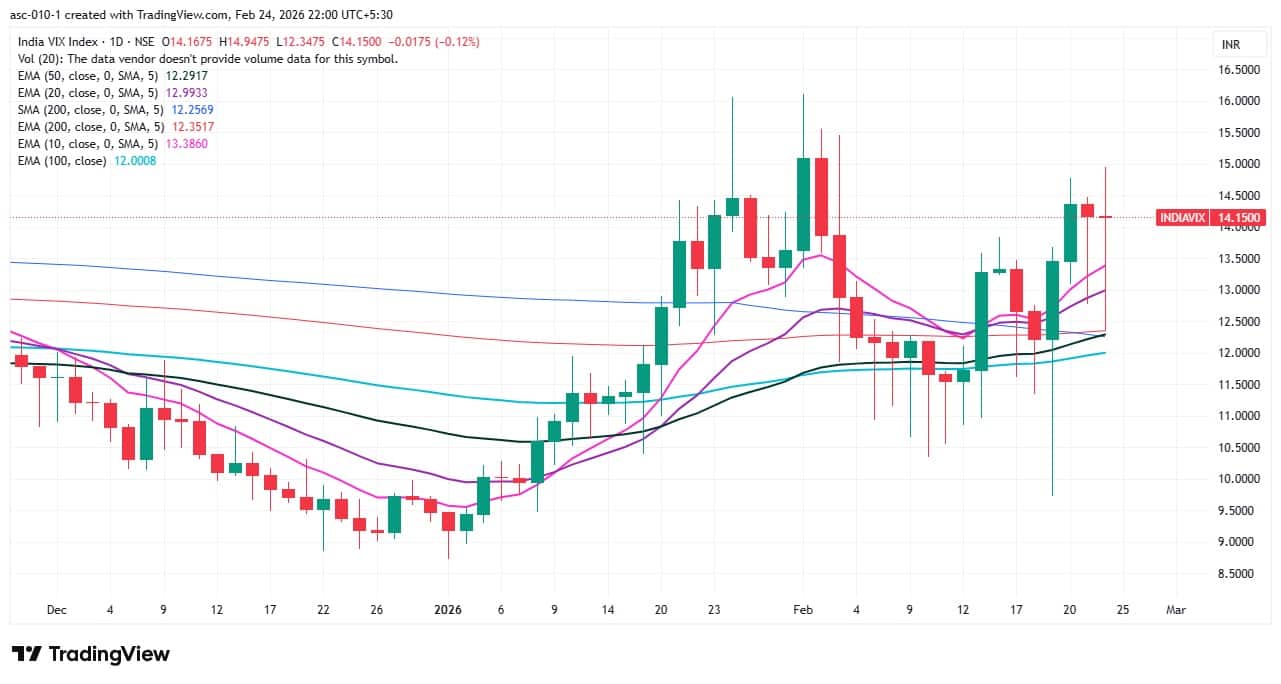
9) India VIX
The India VIX, also known as the fear gauge, declined 0.12 percent to 14.15 after moving in a wide range of 12.3–14.9, but it remained at elevated levels, which is a concern for bulls. Unless it sustains below the 12 zone, bulls may remain uncomfortable.
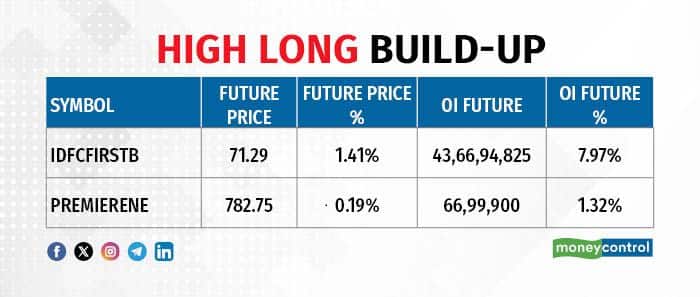
A long build-up was seen in 2 stocks. An increase in open interest (OI) and price indicates a build-up of long positions.
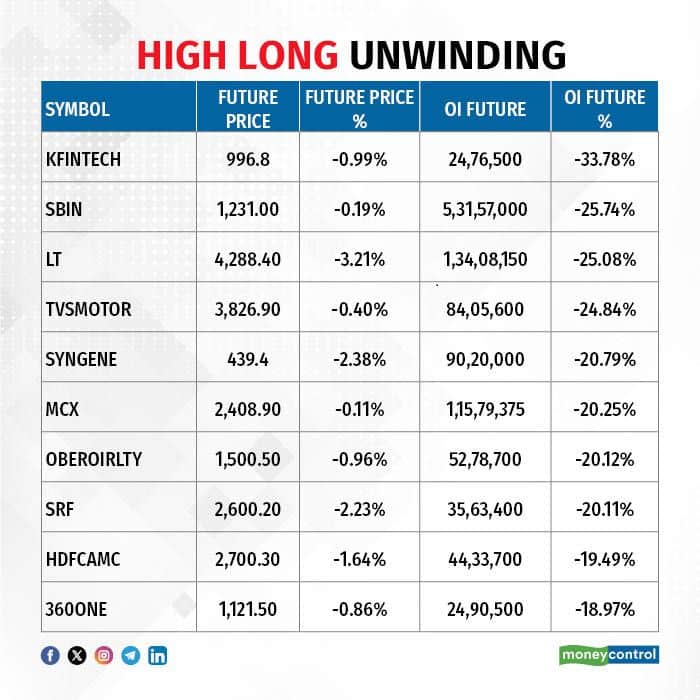
11) Long Unwinding (96 Stocks)
96 stocks saw a decline in open interest (OI) along with a fall in price, indicating long unwinding.
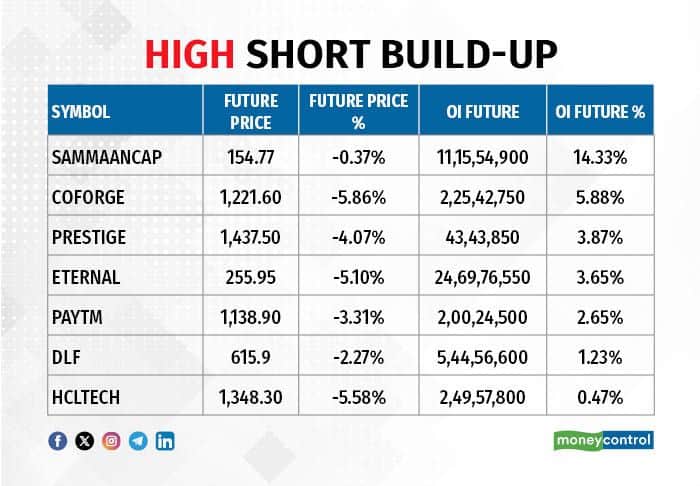
7 stocks saw an increase in OI along with a fall in price, indicating a build-up of short positions.
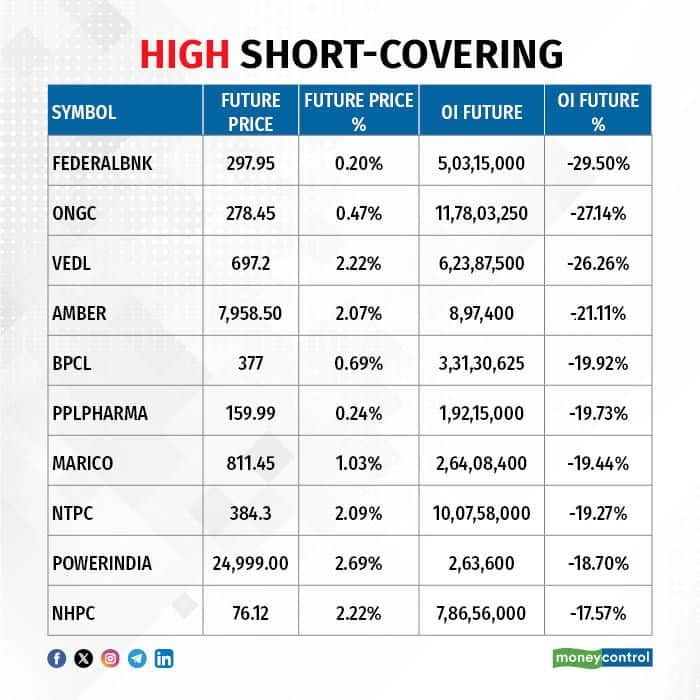
13) Short-Covering (104 Stocks)
104 stocks saw short-covering, meaning a decrease in OI, along with a price increase.
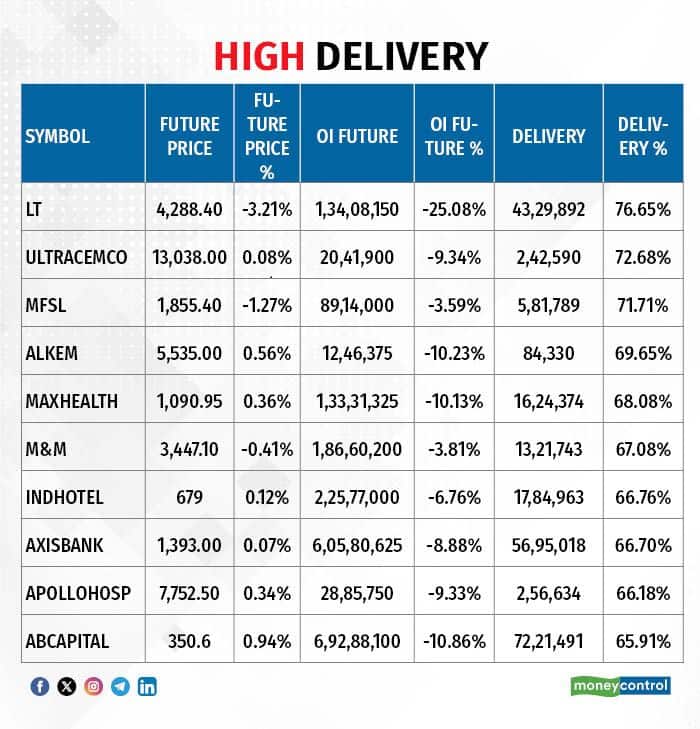
Here are the stocks that saw a high share of delivery trades. A high share of delivery reflects investing (as opposed to trading) interest in a stock.
Securities banned under the F&O segment include companies where derivative contracts cross 95 percent of the market-wide position limit.
Stocks added to F&O ban: Nil
Stocks retained in F&O ban: Nil
Stocks removed from F&O ban: Nil
Disclaimer: The views and investment tips expressed by experts on Moneycontrol are their own and not those of the website or its management. Moneycontrol advises users to check with certified experts before taking any investment decisions.Disclaimer: Moneycontrol is a part of the Network18 group. Network18 is controlled by Independent Media Trust, of which Reliance Industries is the sole beneficiary.Discover the latest Business News, Sensex, and Nifty updates. Obtain Personal Finance insights, tax queries, and expert opinions on Moneycontrol or download the Moneycontrol App to stay updated!
Find the best of Al News in one place, specially curated for you every weekend.
Stay on top of the latest tech trends and biggest startup news.


