


The market has been trading within the Budget day range of 17,353 to 17,972 for the seventh straight session on February 10 but, with strong support at 17,800 level, the Nifty50 seems to be preparing the ground for an upward move.
Hence, there is a possibility that the Nifty may test the psychological 18,000 mark, followed by 18,200 in the coming sessions, with strong support at 17,800-17,650, and also if the index surpasses the downward sloping resistance trendline adjoining highs of December 1, 2022 (record high) and January 24, 2023, then more upward move may be on cards, according to experts.
The Nifty50 closed the week on a flat note at 17,856, forming a Doji sort of candle on the weekly scale, indicating indecisiveness among bulls and bears about future market trend.
"Now since we are trading around the crucial juncture, the market is awaiting some solid trigger to come off the recent slumber phase. The breakout could happen either side but if we have to predict one, we would certainly like to stay positive," Sameet Chavan, Chief Analyst-Technical and Derivatives at Angel One, said.
He further said that hopefully the contraction of range breaks out higher and the trend deciding level to watch out for would be 18,000. "This will confirm the completion of the long corrective phase. We can then see some exuberant moves in the market as the sentiments are likely to improve drastically post the breakout," Chavan said.
On the flipside, the support range is visible around 17,800 - 17,700.
Apart from this, the broader market did well towards the latter half of the week as the Nifty Midcap 100 and Midcap 50 indices gained 2 percent each, and the Smallcap 100 index up over 1 percent. "The way the Nifty Midcap50 index is shaped up, we remain hopeful to see some encouraging moves in the coming week," he said.
Let's check out the top 10 trading ideas from experts for the next three-four weeks. Returns are based on the February 10 closing prices.
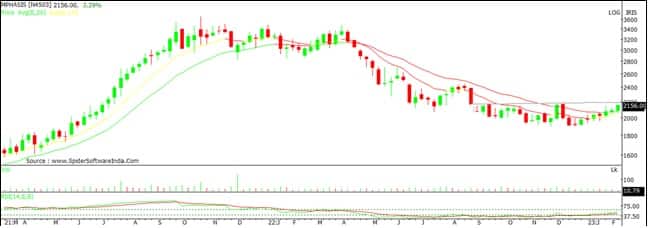
Mphasis: Buy | LTP: Rs 2,153 | Stop-Loss: Rs 1,990 | Target: Rs 2,480 | Return: 15 percent
The attached weekly timeframe chart of this IT stock (Mphasis) indicates a gradual up-move over the last few weeks. The stock price was in an intermediate down trend in the past and has declined as per lower tops and bottoms on the weekly chart. It seems to have formed a bottom reversal around Rs 1,900 level in December and moving up sustainably since then.
The previous negative chart pattern is at the verge of turning into bullish formation like higher tops and bottoms. Hence, the stock price is expected to move up in the coming weeks. A sustainable move above Rs 2,200 level could be considered as a decisive upside breakout of the accumulation pattern. Daily 14 period RSI (relative strength index) shows positive indication.
Buying can be initiated in Mphasis at CMP (Rs 2,153), add more on dips down to Rs 2,050, wait for the upside target of Rs 2,350 and next Rs 2,480 in the next 3-5 weeks, with a stop-loss at Rs 1,990.
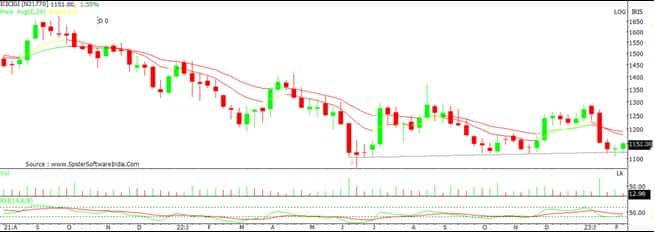
ICICI Lombard General Insurance: Buy | LTP: Rs 1,152 | Stop-Loss: Rs 1,075 | Target: Rs 1,325 | Return: 15 percent
After showing weakness within a broader range in the last one month, the stock price showed bottom reversal at the support of Rs 1,100 levels in the last couple of weeks. The weekly candle pattern indicates multiple bottom reversal formation.
As per the broader range movement of Rs 1,150-Rs 1,300 levels, the stock price is expected to move up from near the present area of lower range. Daily and weekly 14 period RSI shows positive indication.
One may look to buy ICICI Lombard at CMP (Rs 1,152), add more on dips down to Rs 1,105 and wait for the upside targets of Rs 1,240 and next Rs 1,325 in the next 3-5 weeks, with a stop-loss of Rs 1,075.
Laurus Labs: Buy | LTP: Rs 340 | Stop-Loss: Rs 310 | Target: Rs 385 | Return: 13 percent
Though Laurus Labs is looking weak at the current juncture, one needs to pay attention to its last two months' fall from Rs 440 to date. Selling volume is not rising with a fall in price which is an anomaly according to volume spread analysis.
In another word, volume is not in sync with the price. Also, on a weekly scale bullish AB=CD pattern has formed near its historical support zone of Rs 320-330 along with the weekly MACD (moving average convergence divergence) histogram is losing downward momentum, thus hinting towards some bounce in the coming few weeks.
One can buy Laurus Labs only in the range of Rs 333-340 with a stop-loss of Rs 310 and for target of Rs 385.

Gujarat Gas: Buy | LTP: Rs 480 | Stop-Loss: Rs 455 | Target: Rs 530 | Return: 10 percent
Since the last couple of months, the said counter has corrected almost 18 percent and currently, it has made nice bottom near Rs 450-455. Buying volume is gradually increasing from lower levels thus indicating bullish momentum in the coming few sessions.
From the indicator perspective, on a daily scale of MACD histogram and RSI bullish divergence was seen thus confirming the bullish stance in the counter.
One can buy in the range of Rs 475-485 with a target of Rs 530 and a stop-loss of Rs 455 on a daily close basis.

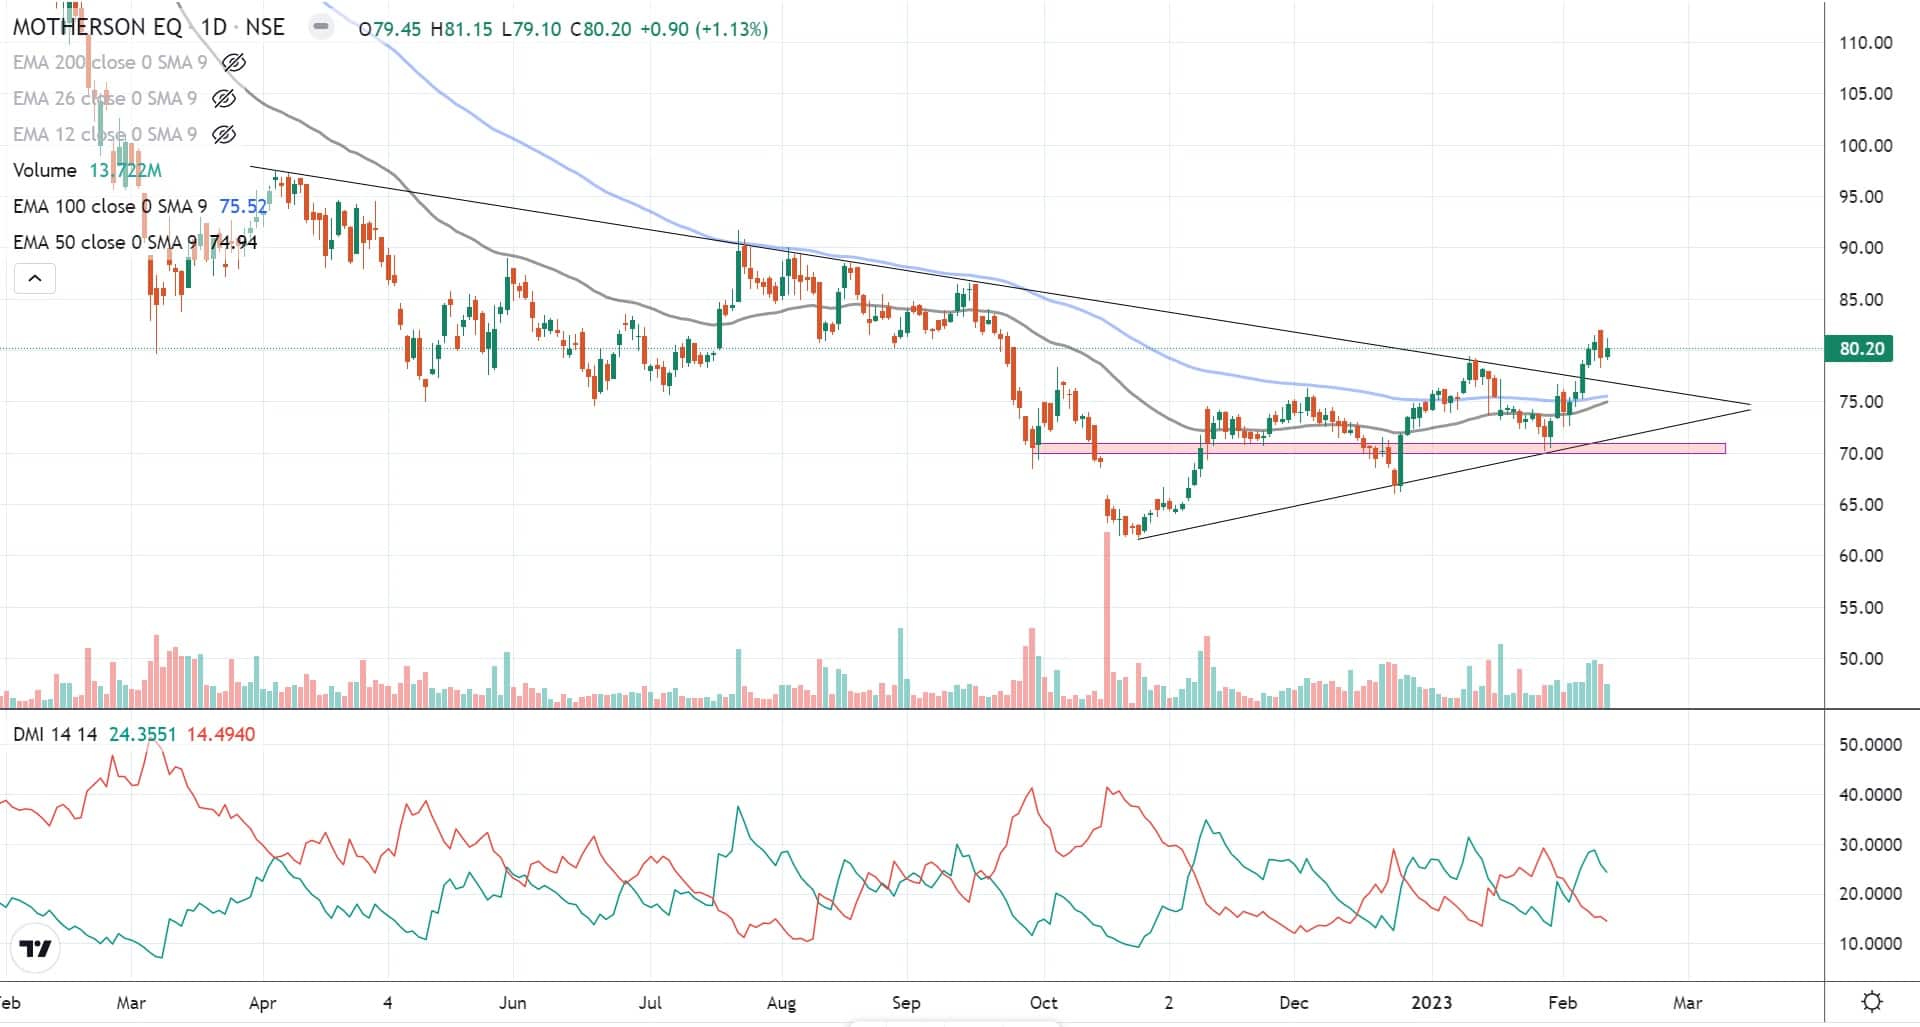
Samvardhana Motherson International: Buy | LTP: Rs 80.2 | Stop-Loss: Rs 72 | Target: Rs 95 | Return: 18 percent
Since the last 3 months, the said counter has been making higher highs and higher lows structure. Recently it broke its previous swing high of Rs 79.45 along with the 6-month-old trendline was broken and currently is sustaining above it thus hinting upside in the counter.
Moreover, the said counter has made nice base around 100 and 50-day EMA (exponential moving average) along with decent volume buying has seen from every lower levels which is looking lucrative.
On the indicator front, daily DMI (directional movement index) is in bullish mode also it broke its previous swing thus indicating bullishness in the counter.
One can buy in small tranches around Rs 79-81 and another around Rs 77-76 (if tested). Target is expected around Rs 95 and stop-loss would be Rs 72 on daily close basis.
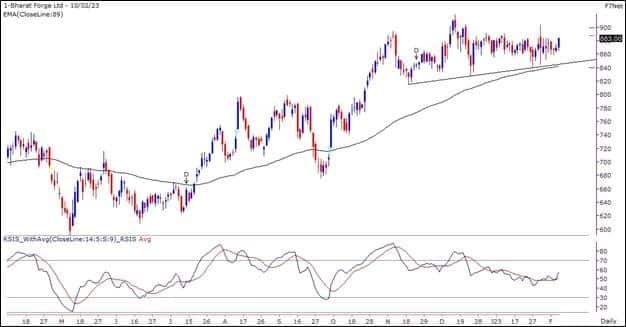
Bharat Forge: Buy | LTP: Rs 883 | Stop-Loss: Rs 863 | Target: Rs 920 | Return: 4 percent
The stock has been forming a ‘Higher Top Higher Bottom’ on the weekly chart and is thus in a broader uptrend. In last couple of weeks, prices have consolidated with lower volume which indicates it to be a time-wise correction within an uptrend.
Now the RSI Smoothed oscillator has given a positive crossover on the daily chart and hence, we expect the prices to resume the uptrend soon.
Hence, short term traders can look for buying opportunities around current market price of Rs 883 for near term targets of Rs 903 and Rs 920. The stop-loss for long positions should be placed below Rs 863.
ICICI Lombard General Insurance: Buy | LTP: Rs 1,152 | Stop-Loss: Rs 1,116 | Target: Rs 1,218 | Return: 6 percent
The stock has recently seen a price-wise correction along with other insurance stocks. However, prices are trading around the previous swing low support and the momentum readings have given a positive crossover from the oversold zone indicating probability of a pullback move.
The stock is trading in triangle pattern and we expect prices to pullback towards the resistance end.
Hence, traders can look to buy the stock around current market price of Rs 1,152 for potential targets around Rs 1,188 and Rs 1,218. The stop-loss for long positions should be placed below Rs 1,116.

Mphasis: Buy | LTP: Rs 2,153 | Stop-Loss: Rs 2,000 | Target: Rs 2,450 | Return: 14 percent
The stock is progressing in the double bottom formation since September 2022, it needs to close above Rs 2,180 on daily basis to validate the same. If we consider the price pattern from August 2022, then based on that we can also consider it as a Rounding bottom formation, which will lift the stock towards Rs 2450 in the medium term.
It is a buy at the current level and further on the decline at Rs 2,050, keeping a stop-loss at Rs 2,000 for the same.

Poonawalla Fincorp: Buy | LTP: Rs 301 | Stop-Loss: Rs 270 | Target: Rs 350 | Return: 16 percent
It is a mid-sized NBFC company that is forming a typical bullish continuation formation. It was at Rs 250 when the broad market started to weaken from the high of 18,900, however, later it started doing relatively better. When Nifty fell to 17,350, the stock made a higher bottom at Rs 280 than the previous low it made at Rs 250 suggesting to us that the stock is relatively strong.
Since January 2023, the stock has started forming a flag formation, which indicates further upside in the medium term. We can expect Rs 340 or Rs 350 in the medium term and Rs 400 in long term. Buy 50 percent at current levels and the balance at Rs 285. For this keep the final stop-loss at Rs 270.

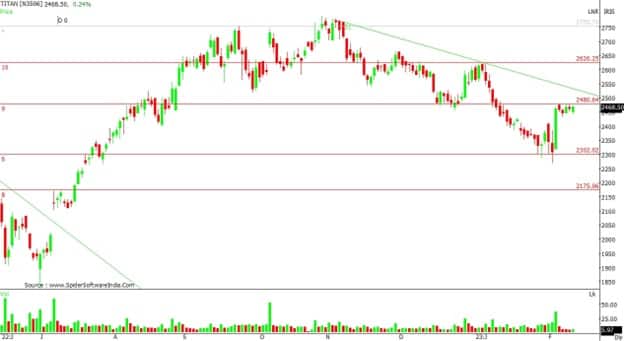
Titan Company: Buy | LTP: Rs 2,468.5 | Stop-Loss: Rs 2,350 | Target: Rs 2,625 | Return: 6 percent
The stock has completed a corrective pattern at Rs 2,269.60. It was a 50 percent retracement of the previous rally, which started at Rs 1,825 and ended at Rs 2,791. In the past Rs 2,325-2,275, acted as a major support zone for the stock and exactly at the same zone, the stock took a breather at Rs 2,300 in the recent sell-off and reversed sharply.
After a massive run from Rs 2,269.60 to Rs 2,470 last week, the stock has taken a pause, which could act as a continuation formation for the market.
The strategy should be to buy at the current level and more on dips at Rs 2,400. On the upside, the stock may go up to Rs 2,550 and Rs 2,625. Buy with stop-loss at Rs 2,350.
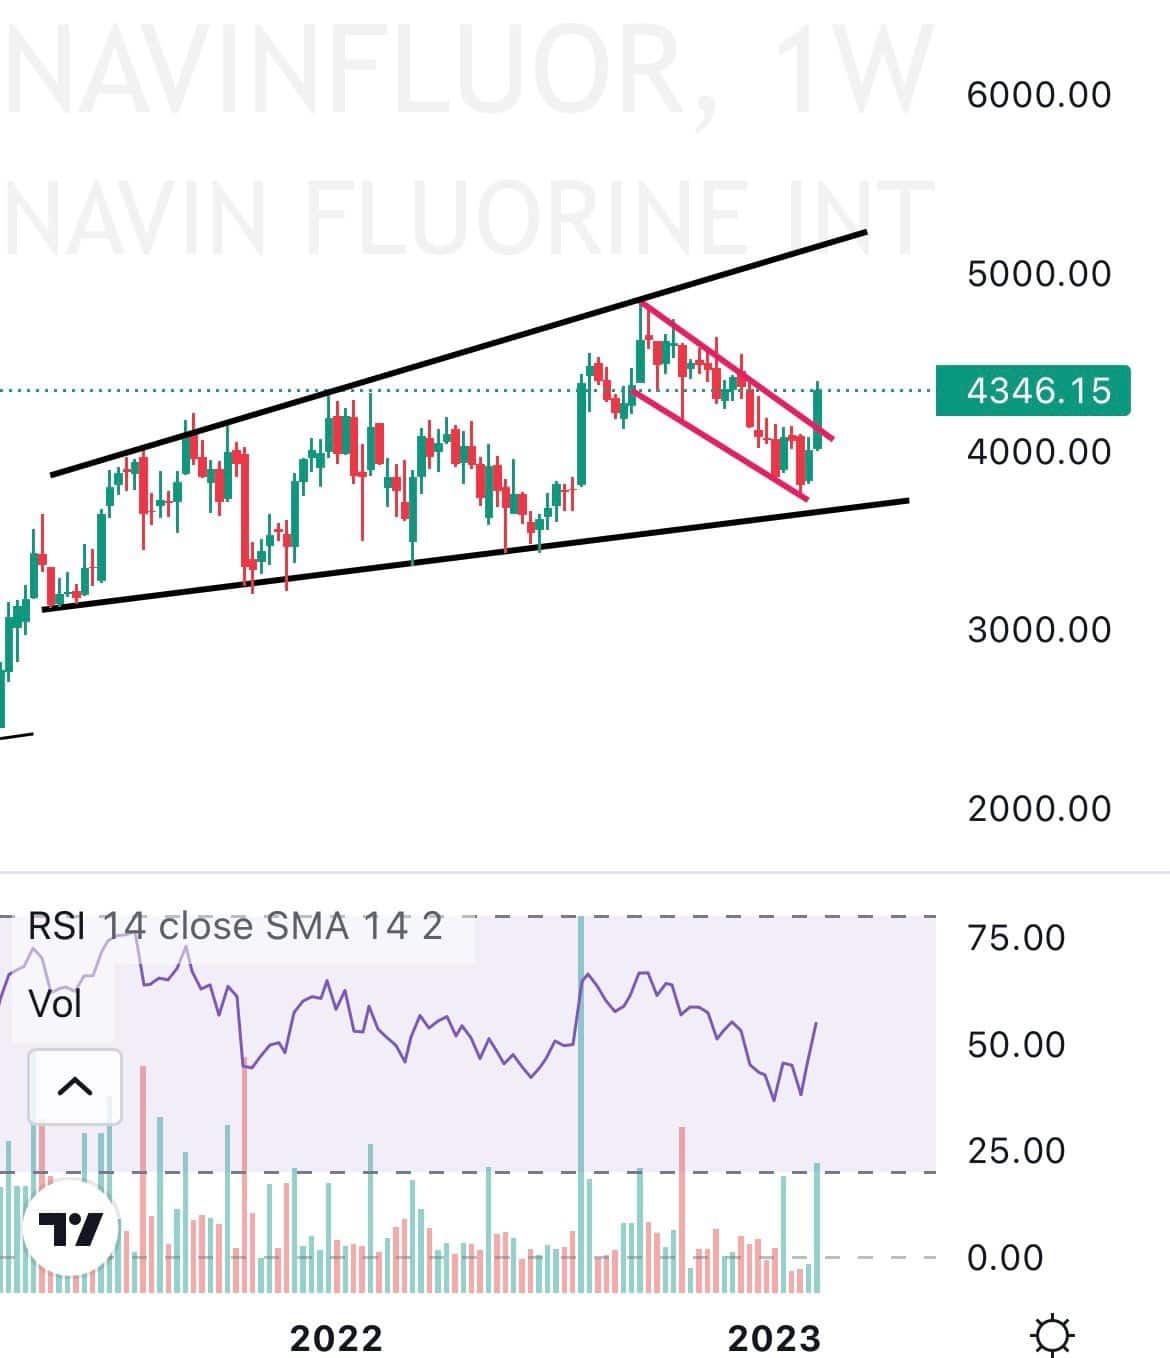
Navin Fluorine International: Buy | LTP: Rs 4,346 | Stop-Loss: Rs 3,160 | Target: Rs 4,600 | Return: 6 percent
Navin Fluorine has seen to be breaking out of a downwards sloping parallel channel pattern with a bullish candlestick on the daily timeframe, whereas on the weekly timeframe the stock has seen to be trading in a broadening wedge formation.
On the indicator front, the supertrend indicator is indicating a bullish reversal which can be used as a confluence towards the bullish view. The 200-day EMA is at Rs 4,129 on the daily timeframe and the stock is comfortably sustaining above it.
The ichimoku cloud is also suggesting a bullish move as the price is trading above the ichimoku cloud on the daily timeframe. Momentum oscillator RSI (14) is at around 65 on the daily time frame indicating strength by sustaining above 50.
Observation of the above factors indicates that a bullish move in Navin Fluorine is possible for targets upto Rs 4,600. One can initiate a buy trade in between the range of Rs 4,340-4,346 with a stop-loss of Rs 3,160 on daily closing basis.
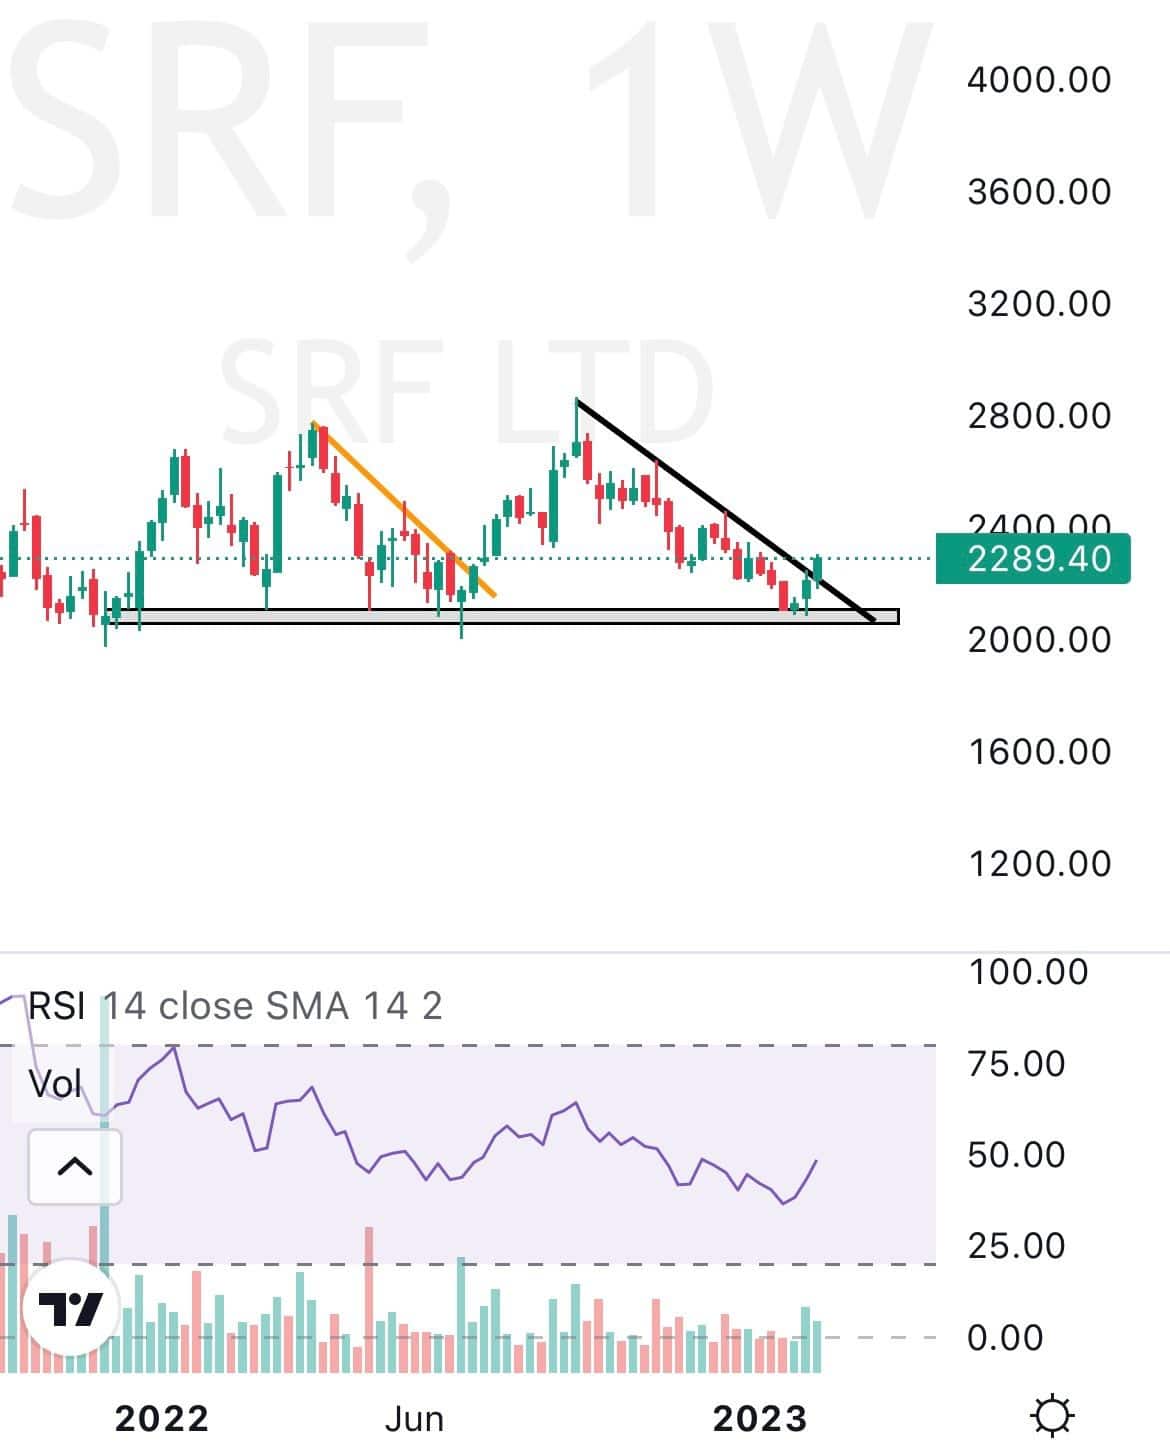
SRF: Buy | LTP: Rs 2,289 | Stop-Loss: Rs 2,190 | Target: Rs 2,435 | Return: 6 percent
SRF has seen to be taking support from its previous support zone and breaking a downwards sloping trendline with a strong bullish candle on the daily timeframe and the supertrend indicator is also indicating a bullish trend reversal which can be used as a confluence towards the bullish view.
Momentum oscillator RSI (14) is at around 62 on the daily time frame indicating strength by sustaining above 50 and the ichimoku cloud is also suggesting a bullish move as the price is trading above conversion and base line.
Observation of the above factors indicates that a bullish move in SRF is possible for targets upto Rs 2,435. One can initiate a buy trade in between the range of Rs 2,284-2,289 with stop-loss of Rs 2,190 on daily closing basis.
Discover the latest Business News, Sensex, and Nifty updates. Obtain Personal Finance insights, tax queries, and expert opinions on Moneycontrol or download the Moneycontrol App to stay updated!
Find the best of Al News in one place, specially curated for you every weekend.
Stay on top of the latest tech trends and biggest startup news.


