


Chandan Taparia
A candlestick is formed with the help of a stock's opening, high, low and closing price of the day. If the opening price is above the closing price then a filled candlestick is drawn. Normally, black or red colour is used for filling the candle.
If the closing price is above the opening price, then a hollow candlestick is displayed in white or green colour.
The filled or the hollow portion of the candle is known as body or real body which can be long, normal or short, proportionate to the line above or below it.
The lines, long or short, above and below the body or real body represent the high or low price range and these lines are known as shadows, tails or wicks.
For a particular day, the highest price is declared by the top of the upper shadow and the lowest price is marked by the bottom of the lower tail.
Candlestick patterns are widely used by technical analysts. There are basically three types of Candlestick patterns:
1. Single Candlestick Patterns
2. Two Candlestick Patterns
3. Triple Candlestick Patterns
In this session, we will be talking about single candlestick patterns.
Single Candlestick Patterns:
Marubozu Candlestick:
It is the single candlestick pattern which has no upper and lower shadow and it has just the real body. There are two types of marubozu – the Bullish Marubozu and the Bearish Marubozu.
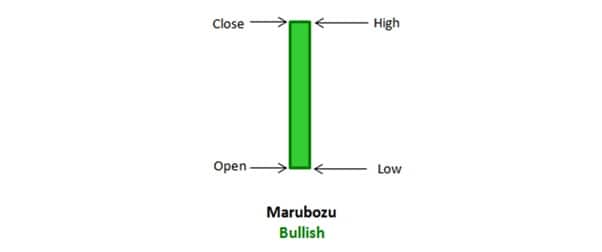
Bullish Marubozu
Bullish marubozu means extreme bullishness and there is absence of the upper and lower shadow which implies that the low is equal to the open and the high is equal to the close. Therefore whenever there is Open = Low and High = close, a bullish marubozu is formed.
It also indicates that there is so much buying interest in the stock that the market participants were willing to buy the stock at every price point during the day so much so that the stock closed near its high point for the day.
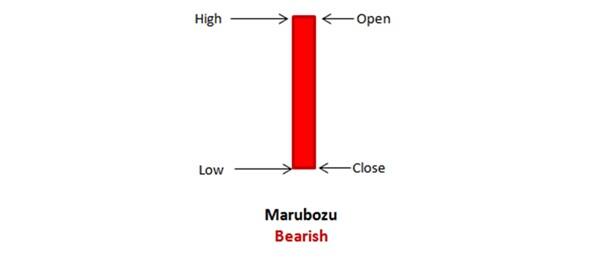
Bearish Marubozu:
Bearish Marubozu indicates extreme bearishness and in this candlestick the open is equal to the high and close is equal to low. Open = High, and Close = Low.
It indicates that there is so much selling pressure in the stock that the market participants actually sold at every price point during the day so much so that the stock closed near its low point of the day.
Disclaimer: The author is Associate Vice President | Analyst-Derivatives at Motilal Oswal Financial Services Limited. The views and investment tips expressed by investment expert on moneycontrol.com are his own and not that of the website or its management. Moneycontrol.com advises users to check with certified experts before taking any investment decisions.

Discover the latest Business News, Sensex, and Nifty updates. Obtain Personal Finance insights, tax queries, and expert opinions on Moneycontrol or download the Moneycontrol App to stay updated!
Find the best of Al News in one place, specially curated for you every weekend.
Stay on top of the latest tech trends and biggest startup news.


