


By Chandan Taparia
In technical analysis, chart patterns play a vital role in understanding the current state of the stock and predict its prospect with regards to the market.
The "broadening bottom" and "broadening top" patterns are important chart patterns that throw light on the movement of a particular stock.
The Pattern forms a megaphone like an appearance with higher highs and higher lows that widens over time. The broadening pattern has 2 major sub-types under bottom and top that includes upward breakouts and downward breakouts.
There are 5 touchpoints in the megaphone appearance that leads to pattern formation.
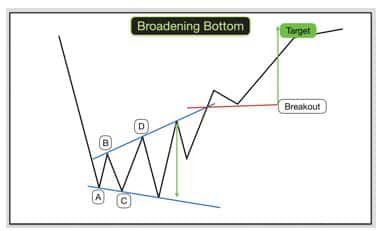
Broadening Bottom
A downtrend leads to the formation of broadening bottom. It is further classified as an upward breakout and downward breakout, where the former is a short-term bullish reversal pattern while the latter is a short-term bearish continuation pattern.
The broadening bottom formation in terms of an upward breakout called as a five-point reversal pattern as it has the 2 minor lows and 3 minor highs.
The average width of this pattern is between 1 and 2 months long. If the price pierces the trend line, then the penetration point becomes the breakout point, either way upward or downward.
Up breakouts do better when the volume trend is falling, and downward breakouts do better with a rising volume trend.
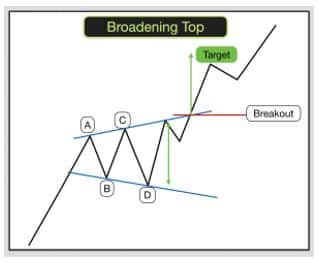
Broadening Top
An uptrend leads to the formation of the broadening top. It is further classified as an upward breakout and downward breakout, where the former is a short-term bullish continuation pattern while the latter is a short-term bearish reversal pattern.
There should be at least two minor highs and two minor lows before the chart pattern becomes a broadening top.
The average pattern length ranges in between 50 to 65 days. Patterns in bull markets do better with a falling volume trend. Bear market patterns excel with a rising volume trend.
A breakout happens when prices move outside the trend-line boundaries or follow a trend line for an extended time.
(The author is a derivatives analyst at Motilal Oswal Financial Services)
Disclaimer: The views and investment tips expressed by investment experts on moneycontrol.com are their own and not that of the website or its management. Moneycontrol.com advises users to check with certified experts before taking any investment decisions.
Discover the latest Business News, Sensex, and Nifty updates. Obtain Personal Finance insights, tax queries, and expert opinions on Moneycontrol or download the Moneycontrol App to stay updated!
Find the best of Al News in one place, specially curated for you every weekend.
Stay on top of the latest tech trends and biggest startup news.


