

Shabbir Kayyumi
There are many advanced candlestick chart pattern based on two consecutive candlesticks namely: Piercing Line Pattern, Bullish Harami Cross Pattern, Bearish Harami Cross Pattern, Tweezer Top Pattern, Tweezer Bottom Pattern etc. These advanced candlestick patterns are popular
among professional traders and many automated trading algorithm makes extensive use of these patterns.
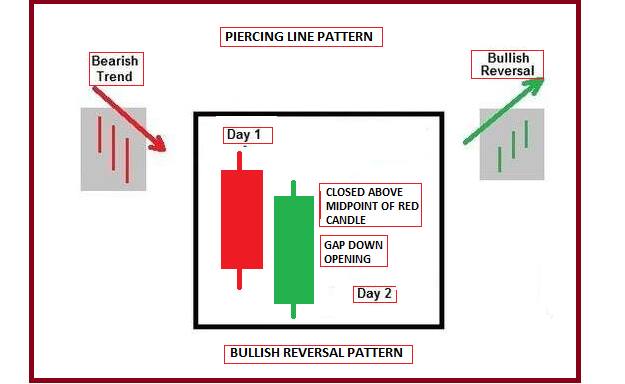
Piercing Line Pattern
Definition
A piercing line pattern occurs in the candlestick chart of a financial instrument when manages to closes more than halfway into the prior
candlestick’s red body, leading to the formation of a strong green candlestick. This pattern usually occurs during a down trend and is
thought to signal the beginning of a bullish trend in the stock, commodity or currency.
Identification Criteria
• The market is in an existing downtrend.
• A red solid body is observed on the first day.
• The green body is formed on the second day has managed to close above halfway of the red body of the prior day.
Interpretation
The market opens lower with a significant gap down in the direction of the existing downtrend. After the market opening, sentiment changes
rapidly and the market moves in the opposite direction towards upside. This causes fear among traders who have short positions, leading to
the covering of short positions faster, which further adds strength in the rally in the market. However the buying force overcomes the selling
force and in the end markets manages to close above the close and halfway of the prior day.
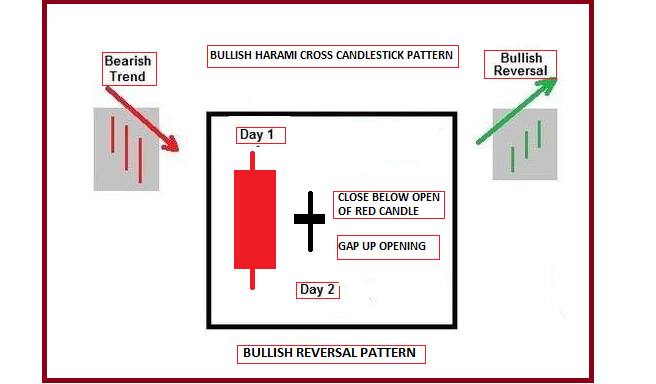
Bullish Harami Cross Pattern
Definition
This pattern consists of a large red body on the first day followed by a small green body (doji) the next day that is completely inside the
range of the first day’s red body. It tends to act as a reversal pattern.
Identification Criteria
• The market is in an existing downtrend.
• A large red solid body is observed on the first day.
• The green small body (doji) is formed on the second day completely engulfed by the red body of the prior day.
Interpretation
The pattern appears in a downtrend and forecasts its bullish reversal. The Bullish Harami Cross pattern needs confirmation on the subsequent
candles. The first red candles indicate an existing downward trend in the stock, and the doji candle represents a slightly upward trend on the
second day, which is completely contained by the body of the previous candle. The second day prices open higher or at the close of the
preceding day and steadily rises bringing a sense of fear among the short sellers. This creates a doubt in existing downtrend and leads to the
covering of short positions, causing the price to rise further.
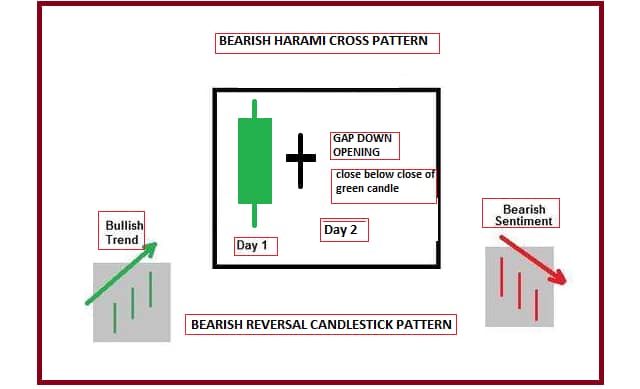
Bearish Harami Cross Pattern
Definition
This pattern consists of a large green body on the first day followed by a small doji the next day that is completely inside the range of the
first day’s green body. It tends to act as a bearish reversal pattern.
Identification Criteria
• The market is in an existing uptrend.
• A green solid body is observed on the first day.
• The doji candle is formed on the second day completely engulfed by the green body of the prior day.
Interpretation
The market is in an existing uptrend and there is heavy buying interest indicated by a green body, which indicate support the bullishness.
However, the next day prices open lower or at the close of the preceding day and trades in a small range throughout the day, but still within
the prior day’s body. The bulls now begin to doubt the strength of the market, and trend reversal to downtrend is confirmed by another
confirmation bearish candle after doji candle of indecisiveness.
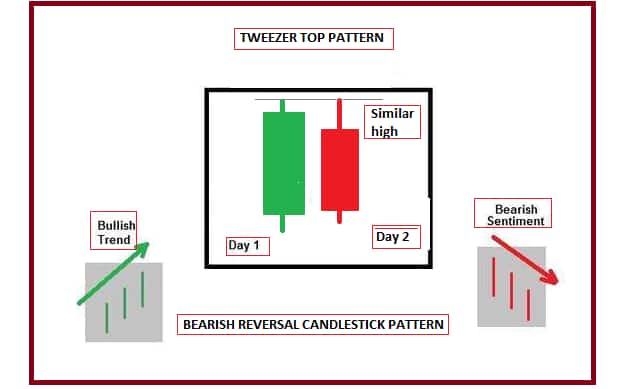
Tweezer Top Pattern
Definition
This is a bearish reversal pattern with two candlesticks. A green candlestick appears on the first day while an uptrend is in progress. The
second day opens and makes an almost a same high of the previous candle.
Identification Criteria
• The market is in an existing uptrend.
• A green solid body is observed on the first day.
• The red body is formed on the second day has similar high of the previous candle’s high.
Interpretation
The high of the second candle signifies an area of resistance. Although the bulls were pushing the price higher, they aren’t willing to buy
above the highest price. So the bears force their way into the action, returning with great force, and drive the price back down. The identical
height of the topmost candles shows the strength of the resistance and indicates that the uptrend will either pause or reverse, forming a
downtrend. Bearish reversal candle formation on third day confirms the trend reversal.
Tweezer Bottom Pattern
Definition
This is a bullish reversal pattern with two candlesticks. A red candlestick appears on the first day while a downtrend is in progress. The
second day’s low is almost similar to the previous candle’s low.
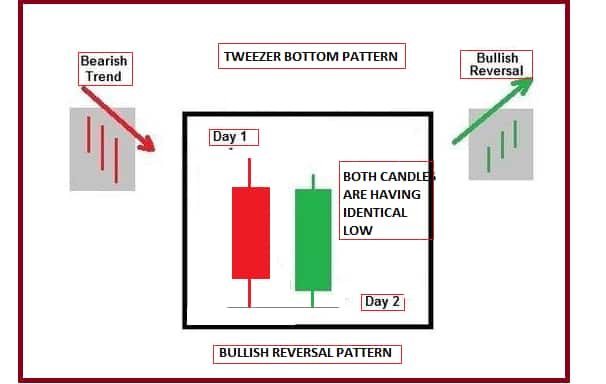
Identification Criteria
• The market is in an existing down trend.
• A red solid body is observed on the first day.
• The green body is formed on the second day has similar low of the previous candle’s low.
Interpretation
The low of the second candle signifies an area of support. Although the bears were pushing the price lower, they aren’t willing to sell below
the lower price. So the bulls force their way into the action, returning with great force, and drive the price back upward. The identical low of
the two candles shows the strength of the support and indicates that the down trend will either pause or reverse. Bullish reversal candle
formation on third day confirms the trend reversal.
Conclusion
• Piercing Line is strong bullish reversal candlestick pattern exactly opposite to Dark Cloud cover.
• Bearish Harami Crosss is bearish reversal pattern, which requires confirmation candle on the next day.
• Tweezer bottom is bullish reversal pattern; since both candles low are identical, it indicates strong support on lower levels.
• Tweezer top is a bearish reversal candlestick pattern where both candles are having identical high showing strong resistance near
top. A bearish reversal pattern on next day will confirm the trend reversal to down trend.
(The author is Head - Technical & Derivative Research, Narnolia Financial Advisors)
Disclaimer: The views and investment tips expressed by investment expert on Moneycontrol.com are his own and not that of the website or its management. Moneycontrol.com advises users to check with certified experts before taking any investment decisions.
Discover the latest Business News, Sensex, and Nifty updates. Obtain Personal Finance insights, tax queries, and expert opinions on Moneycontrol or download the Moneycontrol App to stay updated!
Find the best of Al News in one place, specially curated for you every weekend.
Stay on top of the latest tech trends and biggest startup news.


