


On a weekly timeframe, we can spot that the prices in the latest week have given a breakout from the downward slopping channel which suggests an impending reversal to the upside.
The Nifty on the weekly charts has given a positive breakout of the Inside bar candlestick pattern, which is a bullish reversal pattern. Momentum indicator RSI (relative strength index), plotted on the weekly timeframe is sustaining above 50 which shows presence of positive momentum.
The Nifty has immediate resistance placed at 18,265 (multiple touches) followed by 18,700 - 18,887 (life time high) levels. The downside support for the index is placed at 17,650 (2-week low) followed by 17,353 (swing low).
Based on the overall trend and indications from indicators, we infer that a move beyond 18,265 is likely to spark further bullish momentum till the life highs.
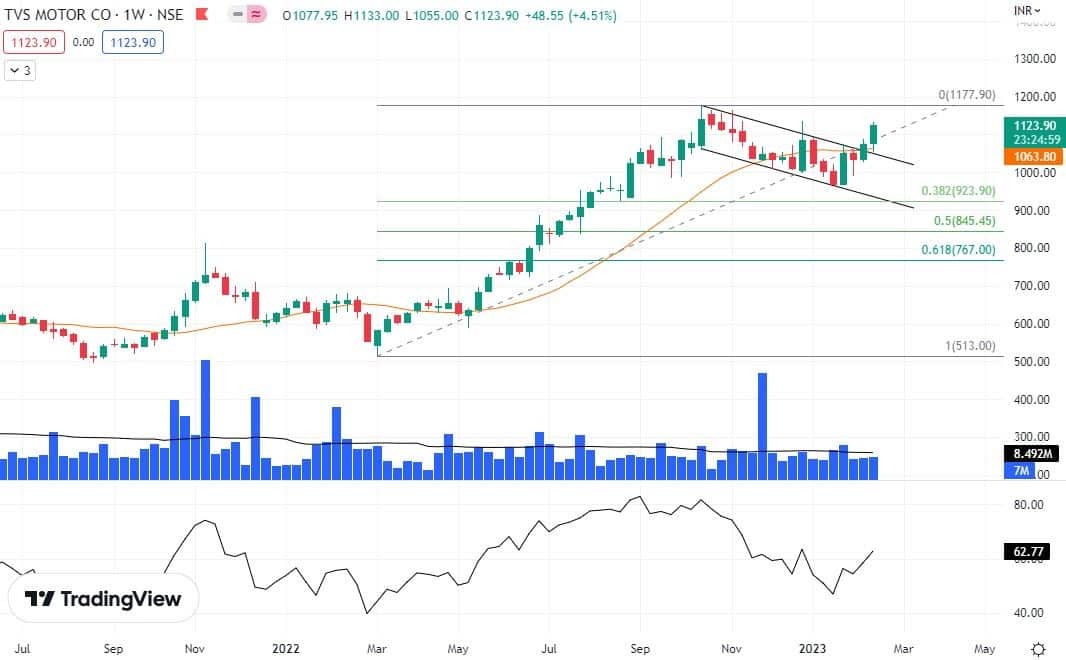
Here are three buy calls for next 2-3 weeks:TVS Motor Company: Buy | LTP: Rs 1,124 | Stop-Loss: Rs 1,045 | Target: Rs 1,300 | Return: 15 percent
TVS Motor current stock prices are nearing an all-time high, which demonstrates the strong upward momentum of the stock.
The stock in the latest week has given a breakout from the downward slopping channel which suggest a reversal and a continuation of prior uptrend.
The expansion of the Bollinger band on the daily chart is a sign of increased price volatility, indicating potential for further upward movement.
The prices have sustained well above key moving averages of 50, 100 & 200-day EMA (exponential moving average).
The sustained level of the RSI above 50 reflects a positive momentum for a potential upward trend.
Going ahead we expect the prices to move higher till the level of Rs 1,300 where the stop-loss must be Rs 1,045 on the closing basis.
Siemens: Buy | LTP: Rs 3,223 | Stop-Loss: Rs 3,015 | Target: Rs 3,750 | Return: 16 percent
The correction post September 2022 in Siemens was done in very structured form as the stock did not get into lower low, lower high formation.
The stock in the prior week gave a breakout of Rectangle pattern, which indicates beginning of the trend to the upside.
The breakout was preceded by prices taking support from 20-week SMA (simple moving average), which acted as a variable support for the prices.
The ratio charts against the Nifty50 Index is rising and has shown a breakout too which illustrates the outperformance of the stock.
Going ahead we expect the prices to move higher till the level of Rs 3,750 where the stop-loss must be Rs 3,015 on the closing basis.

APL Apollo Tubes: Buy | LTP: Rs 1,321 | Stop-Loss: Rs 1,210 | Target: Rs 1,500 | Return: 13 percent
APL Apollo Tubes is in a stellar uptrend since March 2020 and has never corrected much, this shows positive undertone of the prices.
The stock has witnessed a breakout in the rectangle pattern in the last week of November 2022, the breakout was preceded by a short fall in the pattern, which shows the crowd enthusiasm behind the prices for breakout.
The stock price on the daily timeframe is continually hovering near upper Bollinger band which shows the rising volatility of the prices for an up move.
The weekly relative strength index (RSI) has exhibited a breakout too which reflects the strong momentum in the prices.
Going ahead we expect the prices to go higher till Rs 1,500 level where stop-loss must be Rs 1,210 on the closing basis.


Discover the latest Business News, Sensex, and Nifty updates. Obtain Personal Finance insights, tax queries, and expert opinions on Moneycontrol or download the Moneycontrol App to stay updated!
Find the best of Al News in one place, specially curated for you every weekend.
Stay on top of the latest tech trends and biggest startup news.


