


The Nifty index exhibits a robust, bullish trend, characterized by a consistent pattern of higher tops and higher bottoms across various time frames, including weekly and monthly charts. The recent achievement of fresh life highs underscores the prevailing positive sentiment in the market for the medium to long term.
However, on the weekly chart, there has been a notable instance of profit-booking in the current week, following the establishment of a fresh life high at the 21,593 level. This marks the first occurrence of a red candle after seven weeks of consistent green candles, reflecting a healthy correction in the market. Despite this, the Nifty maintains its higher top higher bottom formation on the weekly chart, indicating a strong bullish undertone.
A closer look at shorter time frames, such as the daily chart, reveals some structural damage to the bullish trend as the Nifty breached its five-day low. Nevertheless, the index found robust support at its 20-day SMA (simple moving average), signaling a rebound and affirming that the Bulls still exert control.
Critical technical indicators, particularly the relative strength index (RSI), consistently portray positive momentum, maintaining levels above 65 across daily, weekly, and monthly intervals. This sustained strength in RSI instills confidence in the durability of positive momentum in the medium to long term.
Looking ahead, the immediate resistance for Nifty is identified at the record high level of 21,593, with an additional resistance level at 21,800. On the downside, crucial support levels are recognized at 20,760 and 20,290 levels.
In light of the overall chart structure, we maintain a bullish stance with specific targets set at 21,593 and 21,800 for the short to medium term. This analysis suggests a positive trajectory for the index, indicating a likelihood of sustained gains in the near term.
Here are three buy calls for next 2-3 weeks:
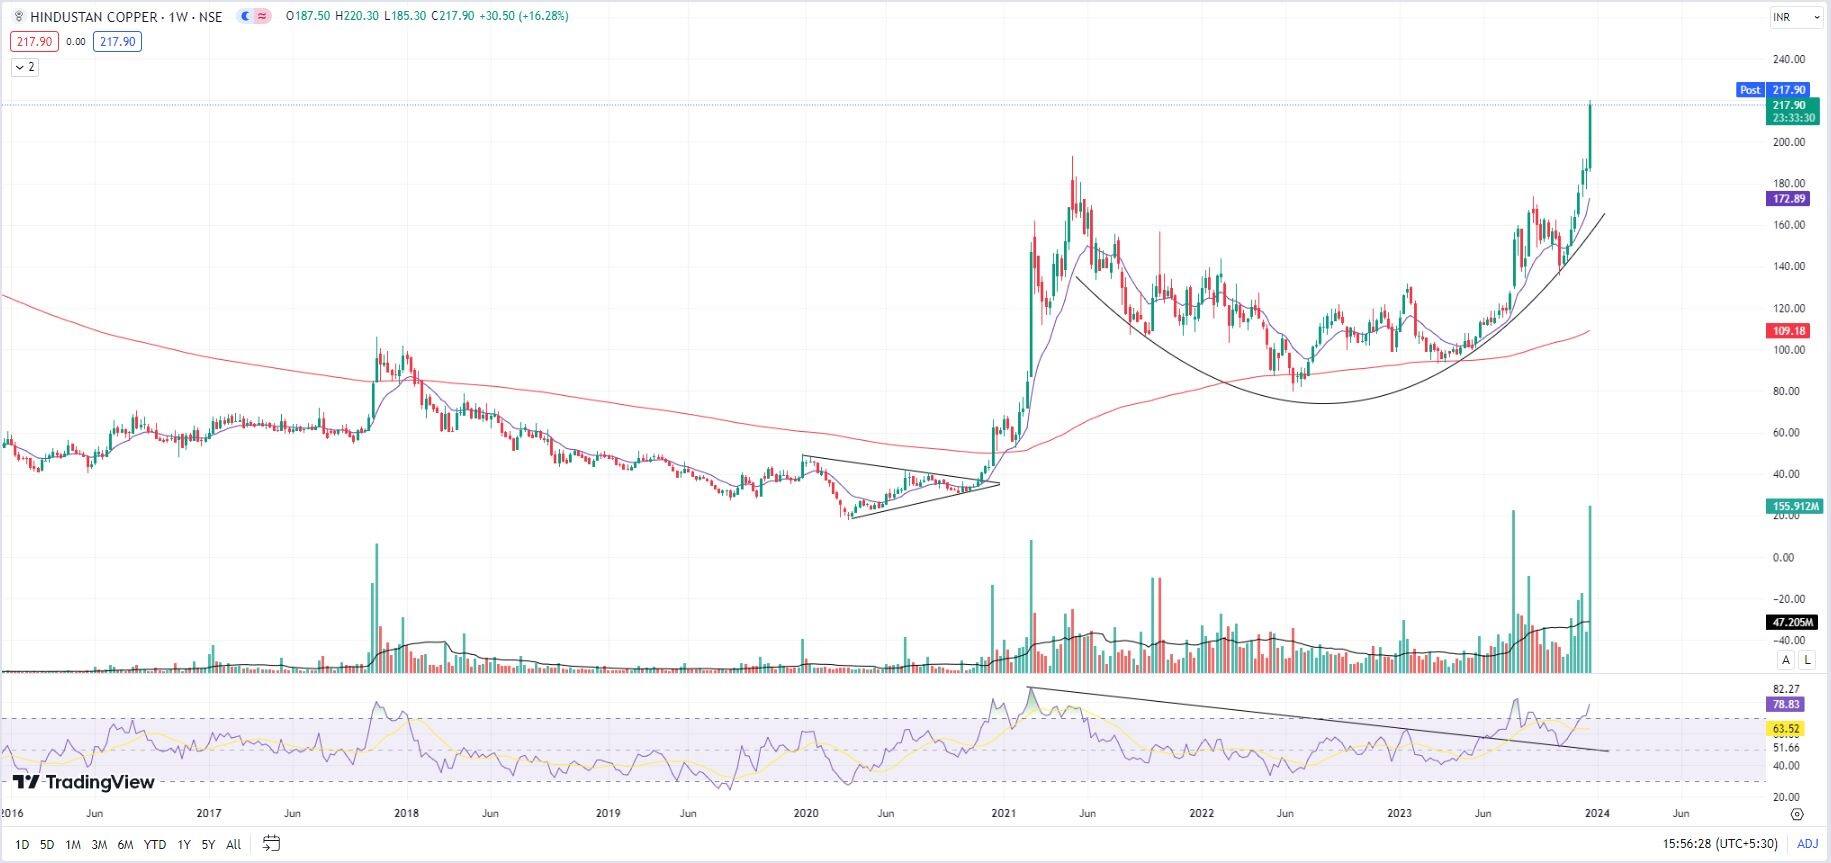
Hindustan Copper: Buy | LTP: Rs 217.90 | Stop-Loss: Rs 190 | Target: Rs 270 | Return: 24 percent
Hindustan Copper is currently at its 52-week high, and has maintained a rising trend since the swing low in March 2023, signifying a positive trajectory.
Notably, the stock experienced a robust breakout from a substantial base that lasted around 2.5 years, spanning from May 2021 to December 2023.
The remarkable aspect is that this extended base formation occurred around the key long-term average of the 200- week EMA (exponential moving average), indicating a robust and healthy foundation. The breakout in the current week was marked by strong volumes, indicating investor anticipation.
Additionally, a range shift is observed in the RSI (relative strength index), further reinforcing the stock's robust momentum for sustained upward trajectory. The concept of mean reversion has also come into play, with dips towards the short-term 12-week EMA acting as crucial support levels.
Looking forward, there is an anticipation of further price ascent towards Rs 270 mark. It is recommended to set a stop-loss at Rs 190, strictly based on the closing basis.
Cyient: Buy | LTP: Rs 2,323 | Stop-Loss: Rs 2,207 | Target: Rs 2,579 | Return: 11 percent
Cyient stock exhibits a healthy uptrend with a consistent pattern of higher tops and higher bottoms, signaling the potential for further upward movement.
Since November 2022, the stock has been on a steady upward trajectory, marked by a shallow retracement over 9 weeks in November 2023. The noteworthy aspect is the efficiency of the price structure, where the 9-week fall retraced in just 5 weeks, underscoring the stock's resilience and potential for sustained upward momentum.
An interesting observation is the efficient mean reversion process in Cyient since the initiation of the rally in November 2022. During retracements, the stock consistently finds support near the 12-week, illustrating a clear and sustained uptrend.
Analyzing the ratio chart of Cyient against Nifty reveals a multiyear breakout indicating potential outperformance compared to the broader market.
Looking ahead, we anticipate further upward movement in prices, targeting Rs 2,579 levels. It is recommended to set a stop-loss at Rs 2,207 based on closing values.

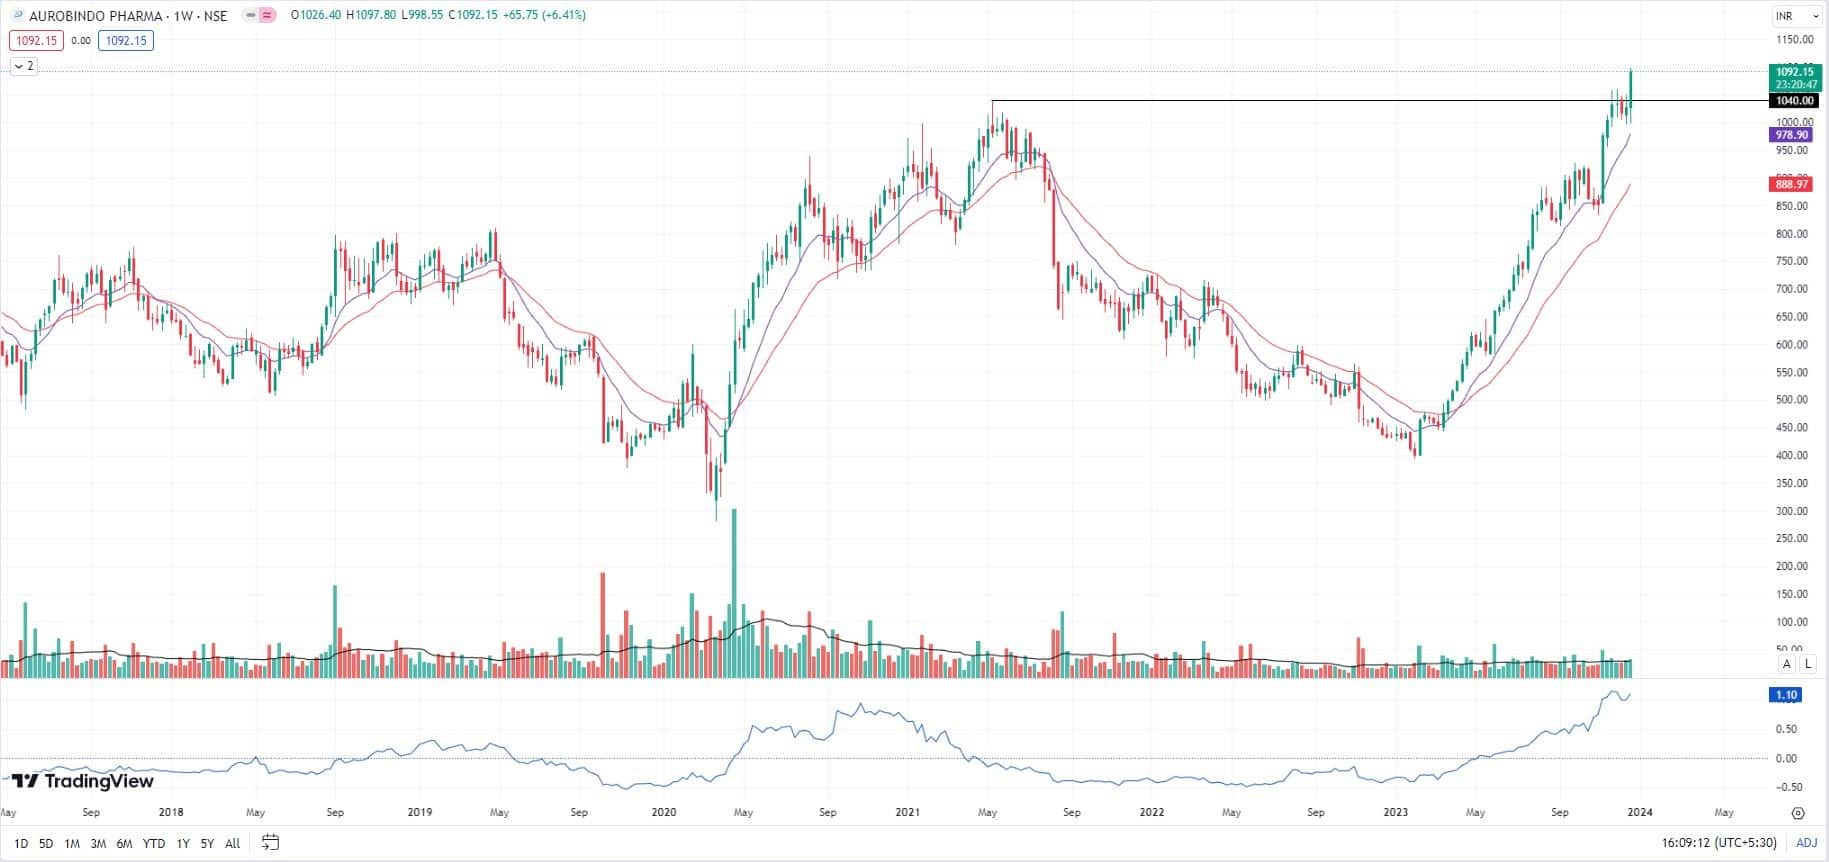
Aurobindo Pharma: Buy | LTP: Rs 1,092 | Stop-Loss: Rs 1,048 | Target: Rs 1,201 | Return: 10 percent
Aurobindo Pharma is currently trading at its life highs, displaying a clear and continuous rising trend since February 2023, indicative of robust momentum.
In the current week, the stock experienced a breakout from its prior significant swing high formed in May 2021, accompanied by a surge in 10-week average volume. This breakout signifies inherent strength in the ongoing trend, suggesting the potential for further upside.
A notable aspect is the stock's consistent trading above both the 12-week and 26-week EMAs during the rally from February 2023. Any dip in the stock's price tends to find support at the 12-week average, reflecting effective mean reversion and reinforcing the stock's resilience.
The ratio chart of Aurobindo Pharma against Nifty aligns with the prevailing trend and momentum in the stock, suggesting its outperformance compared to the broader market.
Looking ahead, we anticipate further upward movement in prices, targeting Rs 1,201 levels. It is recommended to set a stop-loss at Rs 1,048 based on closing values.
Disclaimer: The views and investment tips expressed by investment experts on Moneycontrol.com are their own and not those of the website or its management. Moneycontrol.com advises users to check with certified experts before taking any investment decisions.

Discover the latest Business News, Sensex, and Nifty updates. Obtain Personal Finance insights, tax queries, and expert opinions on Moneycontrol or download the Moneycontrol App to stay updated!
Find the best of Al News in one place, specially curated for you every weekend.
Stay on top of the latest tech trends and biggest startup news.


