


On the daily timeframe, the Nifty is moving with a lower highs and lower lows formation in a downward sloping Channel. The index managed to sustain above the 20-day moving average (17,155) but has been forming narrow range Doji Candles suggesting indecision between the buyers and sellers.
The RSI (relative strength index) is flat and has been hovering around the 50 mark.
The index has made multiple price rejection at 17,600 (supply zone). On the downside 17,000 will acts as a strong psychological support.
From the broader point of view, looking at the price action we expect the Nifty to consolidate between 17,000-17,600.
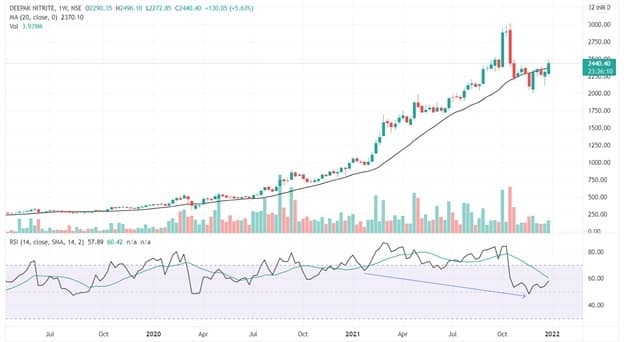
Here are three buy calls for next 2-3 weeks:Deepak Nitrite: Buy | LTP: Rs 2,440.40 | Stop-Loss: Rs 2,265 | Target: Rs 2,950 | Return: 20.88 percent
On the daily timeframe, Deepak Nitrite has given a breakout of a 2 months long Head and Shoulder bottom formation (Rs 2,400 neckline) with an increase in volume activity.
Along with Rs 2,400 neckline breakout the prices have also broken above the 20-week SMA (Rs 2,370). Indicator on weekly is signaling a positive reversal (prices making Higher low but RSI making a lower low) indicating Bullish momentum to continue.
Going ahead Rs 2,370-2,400 zone will act as a strong support for this counter. One can look forward to chart pattern target of Rs 2,800 followed by Rs 2,950 levels on the upside, keeping a stop loss of Rs 2,265 on daily closing basis.
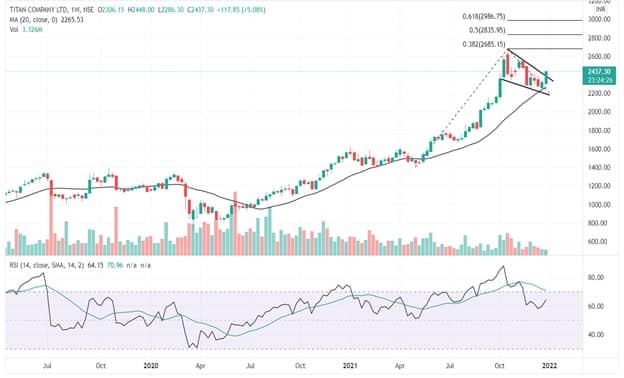
Titan Company: Buy | LTP: Rs 2,437.30 | Stop-Loss: Rs 2,200 | Target: Rs 2,980 | Return: 22 percent
Titan on mid-term charts is moving in a higher-highs and higher-lows formation, indicating that the mid-term trend of Titan remains strongly bullish. Currently the stock is breaking out of a consolidation pattern (falling wedge) on weekly charts after taking support at its 20-week moving average (Rs 2,265).
On the indicator front the RSI can be seen moving higher after forming a bullish hinge near the 60 mark, indicating increasing bullish momentum in the prices.
Going forward, we expect the price to move to the previous swing high of Rs 2,670. If the prices manage to sustain above this level, we might see the price move towards Rs 2,980.
We would recommend to follow a strict stop-loss of Rs 2,200 for this trade.
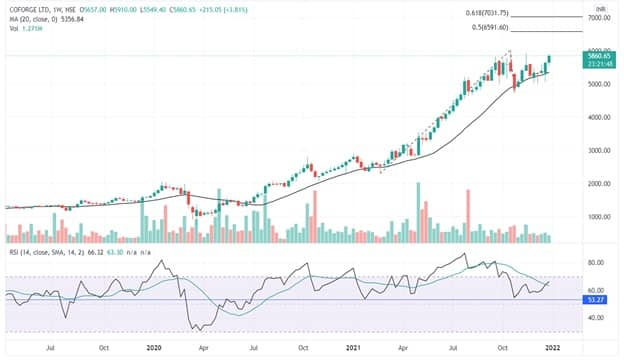
Coforge: Buy | LTP: Rs 5,860.65 | Stop-Loss: Rs 5,300 | Target: Rs 7,030 | Return: 20 percent
Coforge on long term charts has been continuously moving with a higher highs and lows formation since March 2020.
The stock has consistently taken support at its 20-week moving average (Rs 5,353) and moved higher after forming multiple price rejection candles.
RSI indicator plotted on weekly has witnessed a range shift and is sustaining above 50 level since July 2020.
Looking at the price action and technical parameters, we expect the prices to move higher towards Rs 6,590 followed by Rs 7,030 levels. We recommend to follow a stop-loss of Rs 5,300 on the downside.

Discover the latest Business News, Sensex, and Nifty updates. Obtain Personal Finance insights, tax queries, and expert opinions on Moneycontrol or download the Moneycontrol App to stay updated!
Find the best of Al News in one place, specially curated for you every weekend.
Stay on top of the latest tech trends and biggest startup news.


