


On the first day of the February series, January 29, the Nifty ended with its biggest single-day gain since December 4 with heavyweight Reliance Industries contributing the most to the gains. At close, the Nifty was up 1.8 percent or 385 points at 21,738.
Short-term trend in the Nifty turned positive as it broke out from a downward sloping trendline, adjoining the highs of January 16 and January 23. The Nifty also closed above its 11-day and 20-day EMA (exponential moving average) suggesting a bullish trend reversal.
In the options segment, we have seen aggressive Put writing at the 21,500-21,600 levels. This level coincides with the 5, 11 and 20-day EMA which are placed at 21,540, 21,565 and 21,534, respectively. Therefore, we believe that on the downside, 21,500-21,600 levels would act as a strong support.
Traders are advised to accumulate longs in the Nifty with a stop-loss at 21,500 on a closing basis.
There is an unfilled gap in the range of 21,850-21,970 which can act as an immediate resistance for the Nifty. Moreover, in the options segment, we have seen aggressive Call writing at the 22,000 level. So, on the higher side, 21,850-22,000 will act as a strong resistance.
Broader market indices like midcaps and smallcaps have continued their outperformance during the current corrective phase of the benchmark indices. On January 29, Nifty smallcap Index broke out on the daily chart to close at an all-time high levels. The ongoing bullish trend is likely to continue in broader market indices for the coming weeks.
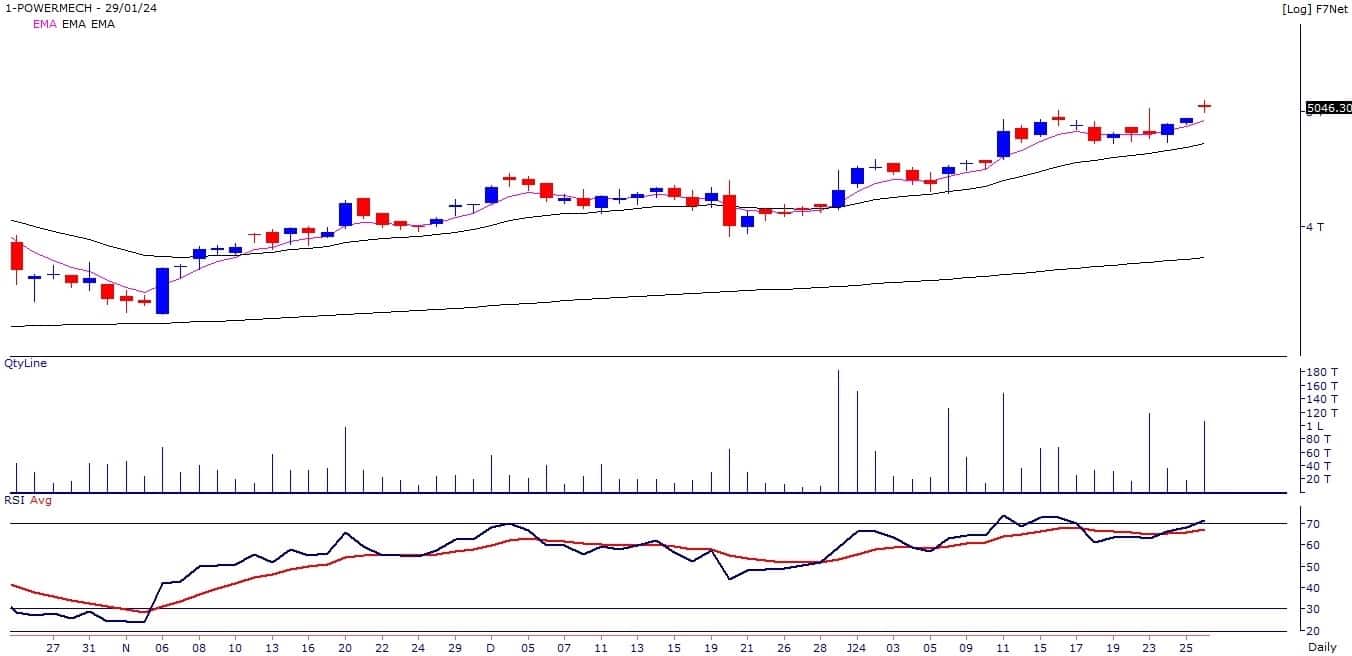
Here are three buy calls for the next 3-4 weeks:Power Mech Projects: Buy | LTP: Rs 5,046 | Stop-Loss: Rs 4,700 | Target: Rs 5,450-5,700 | Return: 13 percentThe stock price has broken out on the weekly and monthly chart to close at all-time high levels with higher volumes. The stock price has been forming bullish higher top, higher bottom formation on the weekly chart. Momentum Indicators and oscillators are showing strength in the stock.
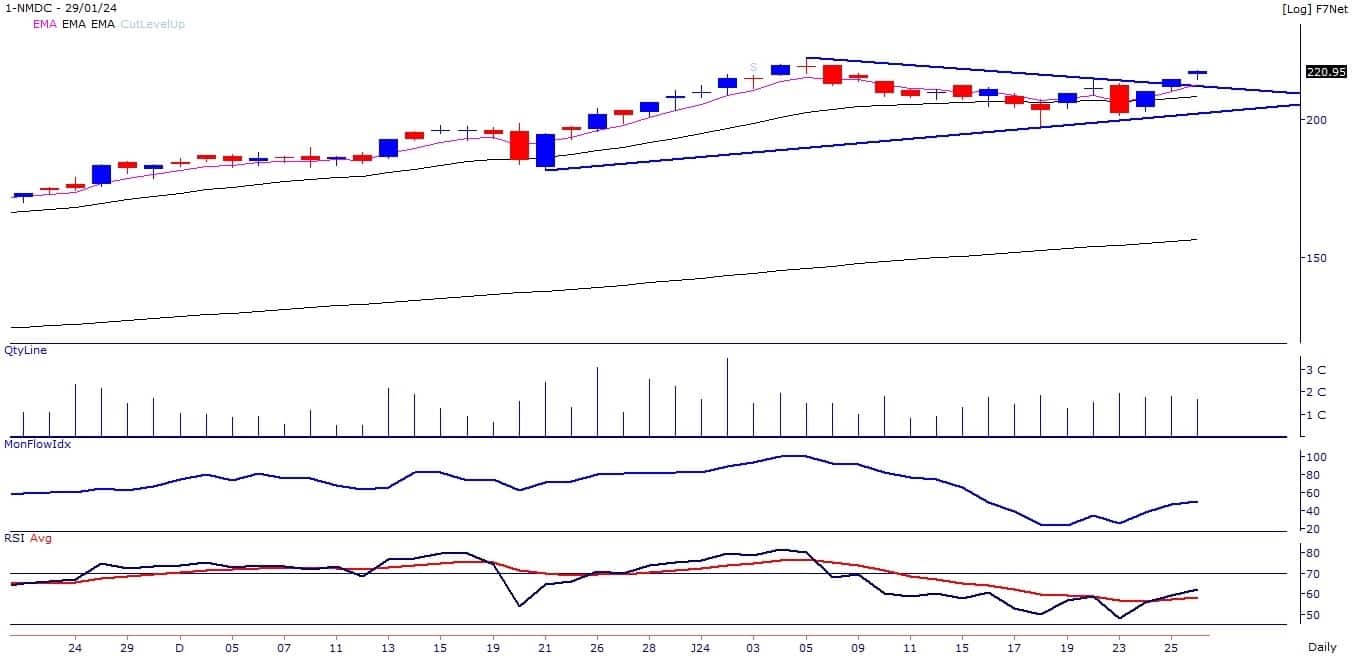
 NMDC: Buy | LTP: Rs 221 | Stop-Loss: Rs 208 | Target: Rs 236-245 | Return: 11 percent
The stock price has broken out from Symmetrical triangle on daily chart. Primary trend of the stock is positive as stock price is trading above important medium and long term moving averages.
Momentum indicators and oscillators like RSI (relative strength index) and MFI (money flow index) are in rising mode and placed above 60 on the daily chart, indicating strength in the stock.
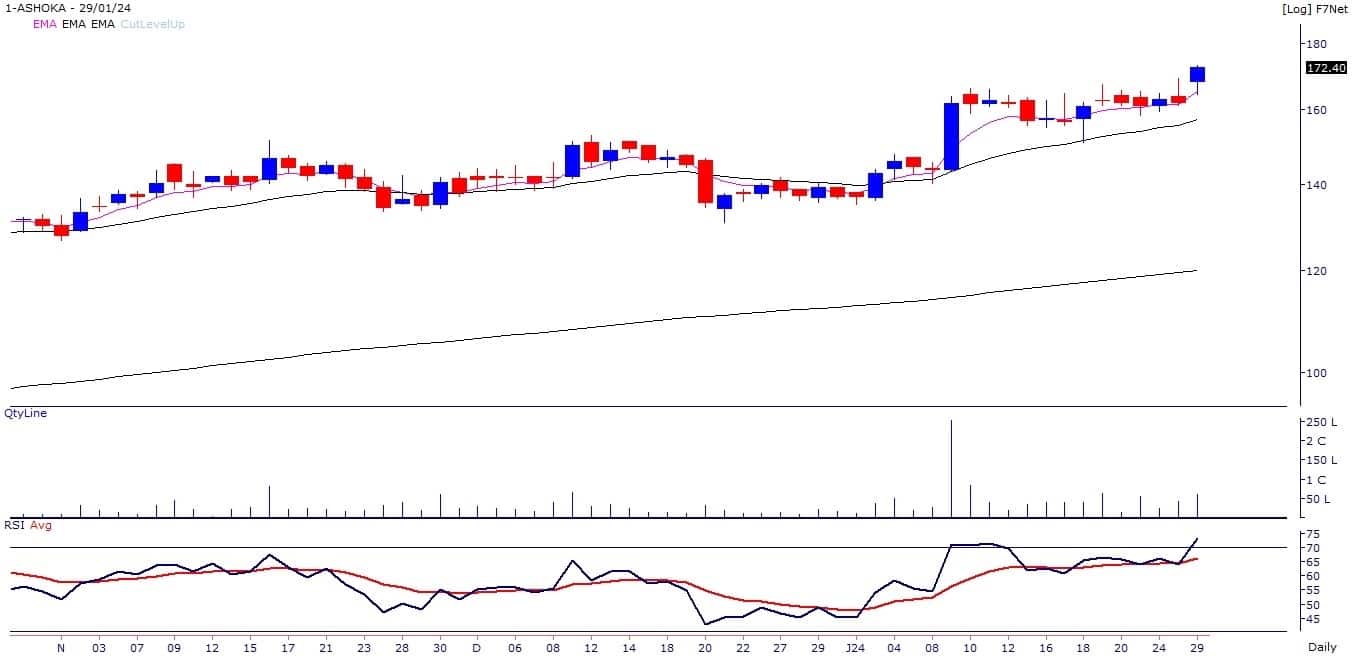
The stock price has broken out on the daily and weekly chart with higher volumes to close at highest level since May 2018. The price has been forming bullish higher top, higher bottom formation on the weekly chart. Construction/Infra stocks are looking strong on the short to medium term charts.
 Disclaimer: The views and investment tips expressed by investment experts on Moneycontrol.com are their own and not those of the website or its management. Moneycontrol.com advises users to check with certified experts before taking any investment decisions.
Discover the latest Business News, Sensex, and Nifty updates. Obtain Personal Finance insights, tax queries, and expert opinions on Moneycontrol or download the Moneycontrol App to stay updated!
Find the best of Al News in one place, specially curated for you every weekend.
Stay on top of the latest tech trends and biggest startup news.


