

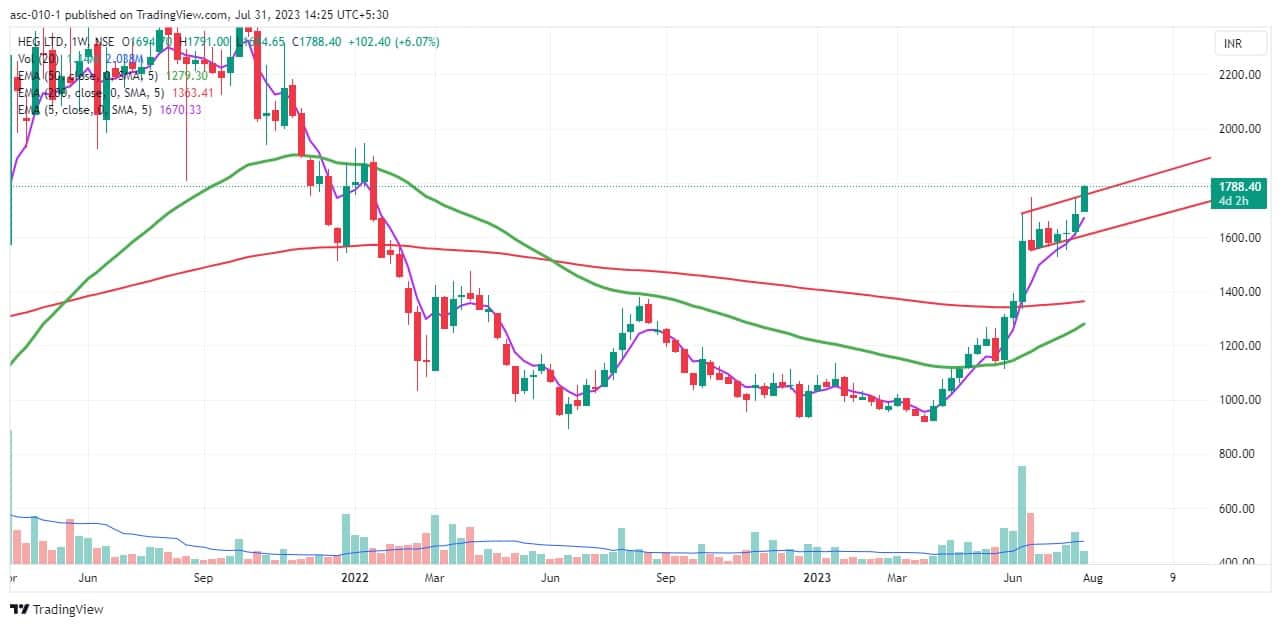
Graphite product manufacturer HEG has given a flag-and-pole pattern breakout, with strong volumes on the first day of the week on July 31, which is a positive sign. The stock can give healthy returns in the coming days if it stays above Rs 1,700, experts said.
The stock rallied more than 5 percent to trade around Rs 1,775 at 1:50pm.
In the week ended June 2, the stock had formed a bullish engulfing pattern on the weekly scale, followed by a rally for another two weeks with healthy volumes. In the next three weeks, it has given more than 38 percent returns, creating a pole.
In following five-odd weeks, it has seen some consolidation and in the last week, ended July 28, the stock has given a good close above those five-week consolidation (which is a flag), followed by today's strong flag-and-pole pattern breakout.
The upward trending flag breakout is a bullish sign and can give strong returns in coming weeks. Generally, traders feel the stock can either give flag or pole size target or both can be possible.
Hence, if it comes true and acts as per this pattern formation, then experts see the stock (HEG) hitting Rs 2,200 in coming weeks, followed by Rs 2,500, which is near to the high of year 2021.
"Analysing the weekly chart, we can observe the formation of a Flag and Pole Pattern, with a potential breakout level at Rs 1,700-level. If the stock manages to break out above Rs 1,700 with convincing volumes, it is likely to trigger a substantial rally, targeting levels of Rs 2,200 and Rs 2,500," Viraj Vyas, CMT, Technical and Derivatives Analyst for Institutional Equity at Ashika Stock Broking, said.
He feels it is important to note that the critical support for the stock is identified at Rs 1,550-level.
As the stock is in a recovery phase, rather than a strength phase, he advised traders to exercise caution while making decisions related to HEG.
HEG has been maintaining a higher top, higher bottom formation since last four months and sustained at a 52-week high, indicating strong positive undertone of the stock.
"The stock is giving a bullish flag pattern breakout in this week, which further strengthens the positive trend. On the daily charts the stock is forming CIP (change in polarity) near Rs 1,530 - 1,500 levels and bounced back which is a bullish reversal signal," Vidnyan Sawant, AVP - Technical Research at GEPL Capital, said.
Momentum indicator like RSI (relative strength index) is sustaining above the 60 mark on all the time frames like daily, weekly and monthly, indicating strong positive momentum of the stock.
One can buy this stock for potential upside of Rs 2,025 followed by Rs 2,200 levels and put a strict stop-loss at Rs 1,630 on closing basis, Vidnyan advised.
Disclaimer: The views and investment tips expressed by investment experts on Moneycontrol.com are their own and not those of the website or its management. Moneycontrol.com advises users to check with certified experts before taking any investment decisions.Discover the latest Business News, Sensex, and Nifty updates. Obtain Personal Finance insights, tax queries, and expert opinions on Moneycontrol or download the Moneycontrol App to stay updated!
Find the best of Al News in one place, specially curated for you every weekend.
Stay on top of the latest tech trends and biggest startup news.


